
REPORT No. 652 - UNT Digital Library
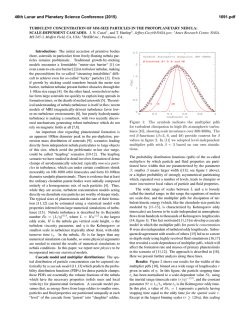
REPORT No. 652
AIR FLOW IN THE BOUNDARY LAYER OF AN ELLIPTIC CYLINDER
By G. B. SCHUBAVER
SUMMARY
The bounday layer of an el~ipticcylinder of major and
minor axes 11.78 and 3.98 inohes, respectively, WCM
kw.stigated in an air stream in which the turbulence could be
raried. Conditions were arranged so that the $OW uw
!aco-dimensionalwith the major axis of the ellipse parallel
to the undisturbed stream. Speed distributions acrosg the
boundary kyer were determined with a hot-wire anernonaeter at a numberof positions aboutthe surfacefor the lowed
and highest intensities of twrbulencelwith the air speed in
bothcases su.iently high to produce a turbulentbounday
layer ozer the downstreampart of the surface, The magnitude and thefrequency oj thegped$uctua+ions in the boundary layer were also measured by the use of the conrentionul
dype of hot-wire turbulenceapparatus. Stream turbulence
wasfound to a~ect boththe nature of transitionfrom laminar to turbu[ent$ow in the layer and the position on the
wuface at which transition occurred.
Transition was then investigated in detail u~th Wream
turbulence of seueral di~erent scales and intensities. It
wasfound thatitheposition of transition could be expressed
as afunction of the intem”iy dkided by the$fth root of the
scale,
INTRODUCTION
The present boundary-layer irmestigat.ion was conducted on an elliptic cylinder of major and minor axes
11.78 and 3.98 inches, respectively, placed in the 4#foot
wind tunnel of the hTationalBureau of Standards with
the major axis of the ellipse parallel to the wind. This
wune cylinder, sim.ilarlyplaced in the same tunnel, was
used in earlier work (reference 1), in which the hninar
“boundary layer and the kminar separation were in-restigated. at a low air speed. The present investigation
was carried out for the purpose of supplementing the
+arlier work with information on the boundary layer
under such conditions of air speed and turbulence that
transition occun and the layer is partly hminar and
partly turbulent. The investigation comprised the
measurement of mean speeds and speed fluctuations
in various sections of the boundary layer and the location of the transition and the separation points. Special
attention was given to the nature and the position of
the transition and the manner in which they are affected by stream turbulence and Reynolds Number.
In the work reported in reference 1, the air speed was
about 12 feet per second, and it was assumed that the
boundary layer remained in the Iaminar condition until
after separation because the separation point remained
fied and the pressure distribution about the cylinder
was unaffected until an air speed of about 15 feet per
second was reached. Above 15 feet per seoond the
separation point began to shift toward the trailing edge
and the pressure distribution began to change, indicating that transition was begiming either in the attached part of the layer or in the separated layer near
enough to the cylinder to affect the flow. It was therefore assumed that a turbulent layer could be obtained
over the rear part of the cylinder simply by increasing
the speed. Acecmiingly, at the outset of the present
work, the pressure distribution was determined at successively increasing speeds until a critical speed region,
similar to that found with spheres, had been paased
and the pressure distribution again attained a staticnmry
value. The critical region ended in the neighborhood
of 55 feet per second. Since the dowmtream part of
the boundary layer was assumed to be turbulent above
the critical region, a speed of 70 feet per second was
chosen as a suitable -working speed for the boundarylayer invedgation.
Not until the speed profiles in the boundary layer had
been determined at numerous points about the surface
and studies of separation had been made, was it discovered that the actual flow conditions were more cornplicated than those origidly
assumed. There fist
occurred the separation of a layer having the general
characteristics of a laminar layer; this separation was
followed by a reattachment of the layer to the surfaoe
as a turbulent layer; and finally the separation of the
turbulent layer occurred. In this part of the work, the
stream turbulence was as low as couId be attained in
the tunneI.
Under such conditions the turbulent layer was too
limited in extent for the type of investigation originally
planned, and an effort was made to obtain a greater
length of turbulent layer by increasing the turbulence
of the air stream with a l-inch square mesh screen
placed 18 inches upstream from the leading edge of the
cylinder. This increased turbulence was found to have
a marked effect on the layer, in that a turbulent layer
developed without the intervening separation. Since
the layer was now more like that origina~y sought, the
measurements were repeated.
207
‘“
..—
208
REPORT
NO. 652-NATIONAL
AD}rISORY
When it was found from the measurements that the
amount of stream turbulence had an important effect on
transition from laminar to turbulent flow in the layer,
the investigation was extended to include a detailed
study of transition as a function of both the scale and
the intensity of the turbulence.
The present investigation therefore covers:
1, Boundary-layer phenomena at low stream turbulence.
2. Boundary”-layer phenomena at high stream turbulence.
-.
—.
COMMITTEE
FOR AERONAUTICS
a smooth surface. obtained by alternate varnisbiug md
sandpapering and finally polishing with crocus paper,
Twenty-one pressure orifices were inserted in tlm cylinder 2X inches below the center for obtaining the pressure distribution over the surface. Eglltewl
of the
orifices were distribut~d around the side on which
boundary-layer measurements were to bo made, onc
was at the leading edge and two were placed on the
opposite side near the leading edge to aid in dining tho
cylind& with its major axis parallel to the wind direction. Oily this position was used in the invmtigat ion.
. .
e.
..- .-.
DESCRIPTION OF ELLIPTIC CYLINDER, HOT-WIRE
ANEMOMETER, AND TRAVERSING EQUIPMENT
THE ELLIPTIC CYLINDER
As stated in the introduction, the elliptic cylinder
had major and minor axes of 11.78 and 3,98 inches,
respectively, and was 4% feet long. When mounted
vertically in the wind tunnel, it extended complet elv
from the upper to the lower face of the octagonal working section, The cylinder was made of wood, and had
-
—
ml
FIC+UBEI.–Photograph showhg details of hot-wire anemometer and traversing equiprnet.
A, mlcrometar oarrtag~ S, fixed way; C, mkzormtar soraw, D, horrsfng; E, tubnlar m~mbti.”
3. The effect of intensity arid scale d stream turbulence on transition at a iixed Reynolds Number.
The work was conducted at the National Bureau of
Standards with the cooperation and financial assistance
of the hTationalAdvisory Committee for Aeronautics.
The author wishes to acknowledge his indebtedness
to Dr. Hugh L. Dryden for rniii.q valuable suggestions,
to W. H. Boyd for the design and construction of traversing equipment, and to W. C. Mockl Jr., for his
assistance with the experimental program.
r
o
?-
W
FIGKIBB2—Phatagraph showing 0WF811 vfaw of ellh)t[c cslhdcr
and traversing equ[pment,
I
HOT-WIRE
A3EMOMEXEIt
AND TRAVERSING
EQUIPMENT
Speed measurements in the boundary layer wore made
with a hotAre anemometer consisting of a fine platinum
wire m&mted on the end of a pair of prongs through
which an electric current could be passed to heat t]m
wire. , The particular arrangement of the anemometer
used for the measurement of mean speeds is shown with
the traversing mechanism in figure 1, The requirement that the prongs and the mounting be rigid enough
to withstand deflection in the wind and still cause no
measurable interference led to the arrangement E.hwvu,
in which the traversing assembly was placed downstream from the cylinder. Tho distance from the
trailing edge of the cylinder to the uearoat point of the,
micrometer carriage A vw 14 inches. In ordor to
.
‘
AIR FLOW IN BOUNDARY
LAYER
prevent accident al momment between the cylinder and
the -wire, the cylinder and the traversing equipment
were rigidly attached to two end boards, the entire
assembly forming the unit shown in @me 2. When
the unit was placecl in the tunnel, the end boards were
fitted into two rectsngdar openings in the tunnel walls.
Interference from the prongs themselves was made
negligibly ama~ by tapering and by using fine steel
needles about 1 inch long to form the ends. There
.4.iIIremained a troublesome flow disturbance caused by
the wire itself, when an attempt was made to use the
customary 0.002-inch-diameter wire. It- turned out to
be necessary to use a mire 0.00063 inch in diameter and
to limit its length as much as possible. Even with the
smaller size of v+e some interference persisted, as
etidenced by a slight shift in the position of separation
back of the -wirewhen the wire was in some upstream
part of the boundary layer.
Traversing of the wire through the boundmy layer was
accomplished by movement of carriage A with respect
to the fixed ways B shown in figure 1. In this arrangement the micrometer screw C was fixed to the carriage
and the two vmre propelled together by a nut inside
housing D. The nut was rotated by bevel gears from
which a shaft estended to the outside of the tunnel
through the tubular member E. Carriage A could be
rotated about E as an axis to permit traversing along
any normal to the surface of the cylinder.
DETERMINATION
OF MEAN SPEED
In the measurement of mean speed with the hot-wire
anemometer, the method known as the “constant temperature method” was used; that is, the current through
the wire was wwied with the speed so as to maintain the
wire at some fixed temperature above that of the surrounding air. The eIectric circuit was arranged so tlmt
the wire formed one arm of a Whetstone bridge. With
a very small bridge current, the cold resistance of the
wire was measured. Then the resistance of the opposite arm of the bridge was increased by a definite amount
ancl a bakmce of the bridge was again obtained by increasing the bridge current untiI the tie resistance
increased through heating by the amount of the added
resistance. In this way a defiite temperature rise
was maintained by the bridge. If E is the voltage drop
across the wire ancl R is its resistance, then by the weUknown hot-wire equation due to King (reference 2), the
heat loss -?P/Rmaybe expressed a.sa function of the air
speed, the dimensions of the wire, the temperature rise,
nnd the properties of the air. King’s equation is useful
to show the quantities upon which the heat 10SSdepends
but cannot be relied upon to determine the absolute
value of the speed. Hence cahbration of the instrument at known speeds is necessary. Using the present
procedure, readings of Eon a potentiometer and of R
on the Whetstone bridge served, with a calibration
curve, to determine the speed.
OF AN ELLIPTIC
CYLINDER
209
Frequent calibrations were made necessary by a
steady change with use in the cooling properties of the
wire. The cause of this change was found to be the
graclual accumulation of very fine dust from the air on
the upstream side of the wire. When the cause was
discovered, precautions were taken to suppress dust as
much as possible. This precaution improved the conditions somewhat but frequent calibration was continued. Changw in the density and the therrnd conductivity of the air, upon which the heat 10SSaIso
depends, were never large enough to cause any detectable change from one calibration to another.
HEAT LOSS TO THE SURFACE
A disadvantage of the hobvire anemometer, when applied to the measurement of speed very near to a surface, is the error caused by heat loss from the wire to
the surface. The error, causing the speed to appear
too high, becomes greater the nearer the surface the
measurement is made. Several investigators ha~-eendeavored to determine the heat loss to the surface by
conducting an experiment in still air at several wire
temperatures to fmd the difference between the rate of
heat.loss near the surface and that far from the surface.
In this manner the heat loss is found as a function of the
-wire temperature and the distance from the surface.
Dryden (reference 3) found the heat loss to an alumi-”
num plate to be given empirically by
HP=1.27x10⁻⁸:P
(1)
where Hn, is the heat loss to the plmte,watts.
1, the length of the wire, inches.
y, the distance from the plate, inches.
8, the temperature difference between the
wire and the plate, degrees C.
A similar relation with the constant roughly 1.0X10-s
was found for a varnished wooden surface in the earlier
work on the eIliptic cylinder.
From the obvious error cdten introduced by applying
the correction, corrections based on such determinations
made instill air are known to be much too large for moving air. Needless to say, it would be very difBcult to
determine a heatiloss correction for moving air that
would apply under all conditions.
Ii tiew of these dMcuMes, a procedure that obviated
the need for heat-loss corrections -was adopted in the
present work. By equation (1), the heat 10SSto the surface is proportional to F and, by King’s hot-wire equation, the heat loss to the air is proportioned to 6. Obviously, the smaller 8 is made, the less is the amount.
of the heat lost to the surface relative to that lost to the
&ir. The procedure adopted was to make e small
enough so that the heat lost to the surface was insignficant compared with that lost to the air. Using several
values of e, measurements of the speed were made in
that part of the boundary layer where the speed near
the surface was low, and it was found that values of $
210
REPORT
NO. 652-NATIONAL
ADVISORY
as high as 150° C. caused no ‘rneasurable error;” How
much higher the allowable value of 6 might have been
was not determined, since 150°.C. was su.t%cientto give
the desired sensitivity at the highest speed.
DETERMINATION
OF SPEED FLUCTUATIONS
The measurement of speed fluctuations with the hotwire anemometer required a technique considerably
different from that described. The problem here is
one of measuring variations in speed from the mean,
when such variations .cmcurwith frequencies ranging
from a few cycles per second to over 1,000. Only
variations in magnitude of the velocity are considered
here because the cooling of a simple hot wire doea not
respond to changes in direction. Hence the term
“fluctuation” refers to an increase or .a decrease in the
instantaneous speed only. The fluctuations vary the
wire temperature and hence the voltage drop across
the wire; and, when the relation between speed change
and voltage change is known, the voltage fluctuations
serve as a measure of the speed fluctuations. The important features of the wire are ilnenesa, to reduce lag
arising from thermal capacity, and shortiess, to reduce
the error caused by variations in the instantaneous
value of the fluctuations from point to point. The
shortness requirement limits the magnitude of the
.—
Elliptic
cylinder
3
J
Pbfinum
wire-+
>
Leads
.
-.
FIGURE&-D&am
of sliding band carrying hot whm
voltage fluctuations and makea it neceeeary to amplify
the voltages before they can be measured.
The amplifier used was the one described in reference
4, A compensating circuit is incorporated in the
amplifier hy which it is possible to compensate for the
lag of the hot wire, if the diameter of the wire is not
too Iarge. The range of compensation was such that
a wire 0.~0063 inch in diameter could be used and the
ovm-all gain of the amplifier was su.flicient to allow
the length of the wire to be reduced to about 0.15 inch.
The wire was then of the same diameter as that used for
measuring mean speeds but was only about one-seventh
as long,
In this cam, the mean value of the heating current
rather than the mean temperature, was kept constant
at all speeds and the voltage fluctuations were read on
COMMITTEE
FOR AERONAUTICS
a thermal-type milliammeter connected to the output
of the amplifier, The calibration consisted in measuring
the mean voltage at different speeds with the snmc
constant value of the current. The method of using
the calibration to calculate the root-menn-equaro of
the speed fluctuations is described in reference 5. Tho
lag ckracteristics of the wire and the adjustment of
the compensation were calculated by the method clescribed in reference 6. With the correcb compmls~tion,
the over-all response of whe and amphfier was uniform
from 3 to 1,000 cycles per second. Most of the
fluctuations fall within this range.
When details of the fluctuations such as wave form
and frequency were to be studied, a cathode-ray
oscfiograph was connected to the output of the amplifier and the.screen photographed with a moving-film
camera.
HOT WIRE MOUNTED ON SLIDING BAND
In the course of the experiment the advantngc of
being able to move the. hot wire around the contour of
the ellipse at a small fised distance from the surface became apparent. The need for doing so first arose when
it became necessary to follow the changes in mean sped
from point tcrpoint about the surface in order to detect
transition. After several attempts to use a modification of the traversing equipment and the hot-wire anemometer shown in figure 1 had proved unsuccessful
om@to the MlicuIty of keeping the distance botwccn
the wire and the surface constaut, the scheme of placing a hot wire on a eliding band attached to the cylimlcr
was tried, A strip of sheet steel 0.002 inch thick and G
inches wide was fitted about the elliptic cylinder in
such manner as to mnke a snugly fitting band ctipn)do
of being slipped around the cylinder and remaining in
any desired position. The arrangement is shown in
figure 3. At the center of the band a short length
of platinum wire of the usutd 0.000G3-inch diameter
was mounted parallel to the surface and normal to the
directi.cmof flow. One end of the wire was soldered to
a fine copper lead cemented to the surface rind suitably insulakd and the other was soldered to a short
lead of the same dinmeter grounded to the bond. Tho
spacing between the platinum wire and the surfmce
was usually 0.008 inch. In order to slip the band about
the surface from the outside of the tunnel, two steel
wires were attached to the band on the side oppositi
the platinum wire and were run to pulleys and shaft,
M shown in figure 3.
The disturbance caused by the band was invest.igatcd
by coating the surface with w mixture of kerosene md
Iampblack and noting the pattern produced in a wind
]f about 60 feet per second. While using the kerosenemd Iampblack-method to investigate separation, it was
found that the lampblack not only showed the position
]f separation but also afforded a very sensitive indication of the prwenoe of smalI particlea of dirt on the
AIR FLOW IN BOUNDARY
LAYER
surface by the distortion produced in the line of accumuhted lampblack at separation. With the band in
place, the Iine showed smaII kinks at the edgee of the
band and a third kink at the center caused by the wire.
Since the general course of the line was the same as for
the bare cylinder, it was concluded that the disturbance
was of no consequence.
The present arrangement turned out to be useful in
the study of speed fluctuations as well as of mean
speeds. The only modification required in the general
scheme was the replacement of the grounded lead with
an insulated lead to avoid troub~es from a double
ground.
METHOD
OF PRESENTING
OBSERVATIONS
Before the elliptic cyIinder was installed in the tnunel, a standard pitotistatic tube was placed at the position to be occupied by the leading edge of the cylinder
and the speed was determined for this position in terms
of the pressure at n tunnel-wdl orifice about 8 feet upstream. The preesure at this orifice me then used to
caIculate the speed when the cylinder was in the tunnel. This speed, denoted by UO,is therefore the speed
which would prevail in the tunnel with the cylinder
absent and, consequently, may be regarded as the
speed of the undisturbed stream.
The actual speed near the cylinder (in the potential
region just outeide the boundary layer) may be computed from the pressure distribution over the cylinder
as follows:
The dynamic pressure q for the undisturbed stream
.
is defied
by q=;
P
U02,where
P h
tha ah density.
If
p, is the static pressure of the undisturbed stream and
p, is the total pressure (a constant everywhere in the
potential region), q may be expressed also as q=p,—p,.
The pressure on the surface, which was determined by
pressure orifices in the cylinder, is denoted by p. Since
the pressure is assumed to remain constant across the
boundary layer, p may be regarded m the static pressure in the potential region just outside the boundary
layer and is therefore reIated to U, the speed just outside the boundary Iayer by
P,–P=;PU2
The pressure distribution about the cylinder is given
“mterms of p— p, and is expressed nondimensionally by
@–PJl~.
~ewise
the speed at me OUtSideOf the
boundary layer is expressed nondimensionally by U/U,
and is obtained from the pressure distribution by
u ‘_p,–p_PrP8() no–q
(p–PJ=l_Pa
!l
~
Lengths, specifying position on the sqrface or in the
OF AN ELLIPTIC
211
CYLINDER
boundary layer, will generalIy be expressed nondimenfionally in terms of D, the minor axis of the ellipse.
rhe Reymolds Number of the cylinder is defined by
where v is the kinematic ~iscosity.
The speed fluctuations both in the boundary layer and
in the free stream will be termed %-fluctuations” in
mder to denote the component of the fluctuation in the
direction of mean flow. The root-mean-square value
of u-fluctuations will be denoted by u! and wilI always
be expressed nondimensionally as u’/Uo. In the free
stream and in the turbulent part of the boundary layer,
u’/ _UO
will be termed the “intensity” of the turbulence.
The term “percentage turbulence,” to &xpress100 u’I UO,
is in common usage in the literature and wilI be used in
the same sense here.
The scrde of the turbulence wilI be denoted by L and
is defined by
L=
J
o&Z)dZ
where 1?(z) is the coefficient of c.crrelation between instantaneous values of two u-fluctuations sepamted by
the cross-stream distance z. For a more complete discussion of L and of the relation between l?(z) and z,
the reader is referred to reference 7.
SYhlBOLS
‘
minor axis of elIipse (3.98 inches), used as the
reference length.
Uo,speed of the undisturbed stream, feet per second.
R, Reynolde Number UoD/v.
q, dynamic pressure of the undisturbed stream
~,
()
;Pu?)
“
plq, dimensiodws pressure on surface of cylinder.
p,lq, dimetiod~s
static pressure in undisturbed
stream.
z/D, dimensionless distance from the leading edge to
any point on the surface.
y/D, dimensionless distance from the surface measured
along the normal.
6, boundary-hiyer thickness.
61D,dimensionless boundary-layer thickness.
U/UO,dimensionless speed in the potential region just
outaide the boundary layer.
u/UO,dimensiord= speed in the boundary layer.
u!, root-mean-square value of the u-fluctuations.
d/ Uhfluctuation intensity or intensity of turbulence.
L, scale of turbulence.
t, turbulent bounda~ layer.
& S,, separation points.
r, sheaxing strcsi.
1,mixing length.
212
REPORT
BOUNDARY-LAYER
N(J. 652-NATIONAL
PHENOMENA
TURBULENCE
PRESSURE
ADVISORY
AT LOW STREAM
DISTRIBUTIONS
As pointed out in the introduction, presswr8 distributions were determined about the elliptic cylinder in
order to iind an air speed for which the boundary layer
over the rear part of the cylinder would be turbulent.
Since the turbulence normalIy prevailing in the windtunnel stream was 0.85 percent and the critical Reynolds Number of a 5-inch sphere was 268,000, it seemed
that such a condition would be found well below the
maximum speed. attainable in the tunnel. By a determination of the pressure distribution at dfierent speeds,
a critical region like that of spheres was found for the
elliptic cylinder extending from about 15 to 55 feet per
second. The change in the pressure distribution occurring through this region is shorn. by the several curves
of figure 4. The curves for 11.2 and 70.0 fed per
X/ii
~IGuUB 4.—Presure
distribution around one side of ellIptIo cyllnder.
turbulsnsa, 0.85pereent..
Strssm
second represent the two @variable forms occurring
below and above the critical region. The term ‘invariable” is used here in a restricted sense to mean fixed or
showing ve~ IittIe change .ov.era certti. speed interval.
The lower-speed type would certainly change for extremely low speeda and the same is true of the higherspeed type, if the speed were made sufficiently high.
The speed was not carried high enough to determine
where a change would occur.@ the distribution abo~e
the critical region. h’o observable change could be
found in the distribution shown for 70.0 feet per second
from 60 to 80 feet per second.
SEPARATION
STUDIES
As indicated in figure 4, the change in the pressure
distribution was accompanied by a change in the point
at which the boundary layer separated from the surface.
COMMITTEE
FOR AERONAUTICS
The method of detecting sepmat,ionwas the well-knom
one of applying a mixture of kerosene and Iampblack
to the surfaca and then running the tunnel Ht the
desired speed for a sufficient length of time for the
surface &ag to. establish a flow ptittern, The vertical
position of the cylinder was weLl adsptcd to this
method because only the frictional drug of tho air
tended to carry the mixture horizontally. Downward
drainage along tie surface occurred, of course, but was
a distinct advantage in that-it reduced ~he film thickness, thus preventing flow under pressure gradient and,
in addition, indicated the direction of the surfucc
friction by the inclination of the drainage lines.
Mter the fknvpattwu was est.ablishedtmdthekerosene
had partly evaporated, a record of the ptitteru was
easily made by pressing a piece of white paper against
the. surface. Figure 5 shows t.bree such records made
at 25, 43, and 70 feet per second, It will bo noted
that the patterns on the upstream part of the surface
show_g s~aca drag in the direction of the stream, indica@d by the inclination of the strc.aks, which is
followed by a region of st~ant air where the strmks
are vertical. Although not clearly shown in the figure,
it was usually. possible to find a third region of short
length’ just -.b~ck of the stagnation region in which the
streaks were inclined forward, giving eyidencc of. reverse ‘flow., SepamJion was assumed to occur in tho
stagnation region.
Because of the rearward movement of sepamtion
with increasing speed, it was at first nssumccl that tbo
boundary layer became turbulent ahead of scpnmtion
and that separation of a turbulent layer was being
obse~ed.
This interpretation sufficed for patterns A
and B, but no”tfor C, where a second line of separation
was fcmnd at the point marked S/. This doublo separation, illustrated by C, was a characteristic of tho flow
above the critical region and always occurred nt tho
same’.points on the surface. It was not until speed
distributions had been determined throughout the layer
with both high and low stream turbulence and studies
of transition had been made with diffment amounts of
turbulence that a satisfactory explanation of this phenomenon was afforded. The boundary layer was found
to maintain the general gspects of a lamimw boundury
layer up to separation, but in no case was it purely
laminar at the separation point above 15 cm20 feet pcr
wcon-d because of a faint beginning of transition ncnr
the 6-inch position. Patterns A tmd B of figure 5
therefore show the separation of u “nearly htmimw”
layer. In pattern C the fit septirntion at S is also
the separation of a nearly laminar layer and the second
mtS: is that-of a turbulent layer, a completo transition
having occurred in the free ~ayerbetween S and IS,and
the r&ultiug turbulent layer having reattached itself
to the surface. As indicated in the fiiuro, the firs~
reparation began at 10 inches, and the final turhulm t
$eparationoccurred at 12.05 inches.
AIR FLOW IN BOUNDARY
Dist ante
~1.
13
LAYER
fr;om lea+&
12
OF AX ELLIPTIC
*e,
in.
7
e
CYLINDER
“6”--”
A
I
I
I
I
II
t
I
d
B
U* “ 43
u~ ‘ 70
fp.s.
,p=i--
1.
%
s
. . .. .
. .. ..
FIGUEB
5.—K~ww+ WId.bunpldack patterns shoidngmorement of se~tfon
.
~lth
speed
anddewbpment
of mat tnched t urbulent layer. S&am tnrbnIenrw, O.Sdpercent. Dfstances were measured aIong sorWe.
Of‘wi%St=wparatton Poin@ f=Tmb@ent ~
~YW. A~WS ~~te
d-n
2091424%15
213
214
REPORT
NO. 652-NATIONAL
ADVISORY
The direction of flow in the separation region of pattern C and the extent of the region -wereobtained by a
second method of detecting separation that proved to
possess certain advantages .gver the .kerosene-andlampblack method. The procedure was to apply ta
the surface a concentrated water solution of litmus,
which was then reddened by fumes of hydrochloric acid
and allowed to dry. Then, with a wind of the desired
speed, a small amount of ammonia gas was released at
the surface through a hypodermic needle in the neighborhood of the point to be investigated. The direction
of the flow was clearly indicated by the blue color of the
litmus. This method gave a definite indication of the
direction of flow in the low-speed regions about sepmation points and showed details of the air motion impossible to obtain with the kerosene- and lampblrickmethod. In this way the first separation region was
found to extend from 10 inches to 11.2 inches, as indicated in figure 5.
Q
.04
.08
./2 “ ‘%
.20
.24
COMMITTEE
I?OR AERONAUTICS
proiile at 2.99 is certainly not that ordinarily nscribed
to a Iaminar boundary layer, neither does it lmve the
characteristics found in a turbulent boundary lnyer of
a flat plate where the customalT %-power law represents
the speed distribution. As pointed out by Fediaevsky
in reference 8, however, t-madverse pressure gradicmt
has a marked effect on the turbulenkspced profile.
If the nature of this effect is considered and the strong
mdvem gradient existing at 2.99 is noted, it can be said
that the profile is chmwcteristic of u turbulent boundury
layer.
.28
---4
r
1“
u
.02.
.04_
.
.08
.
-“-
-08
y/D
PIGURE6.–Sreed dktrfbution !n boundary IaYer of oIUMO CYHIIder. Afr speed
(UO),70 fwt per Secro@ i?, lW,COI;stream turbulenw, 0.85pt.
MEAN-SPEED
DISTR~UTION
IN THE BOUNDARY LAYER
Traverses norrmd to the surface of the elliptic cylinder
were made with the hot-wire anemometer to determine
the speed distribution in the boundary layer at 15 positions about the surface, beginning 1 inch from the leading edge and ending .nt 12.6 inches. In” tame of @,
in which positions on the surface will generally be expressed, the travemes were. begun at 0.251 and ended
at 2.99. In all cases the speed of the stream U. was
70 feet per second, corresponding to a Reynolds Number
of the cyIinder of 139,000.
Several of the speed distributions are shown in figure 6.
It will be observed that the profiles from x/D= 0,251
to 2.OI show little change ofier than that caused by
a thickening of the boundary layer and all have the
shape generally found in n laminar boundary layer. At
2.52 the profiles show the beginning of separation.
From 2.67 to 2.74 the very sma~ initial slope of the
curves shows that separation hris occurred. Between
2.74 and 2.84 a marked change has occurred, since all
evidence of separation has disappeared at 2.&4. The
X/l?
FIGCBE 7.-C!0ntoum of equal 8*
b Ixmndary laysr of eJIIptlc cylfmler. .41r
sp+xd (W, 70 feet por semnd R, 139,0CO;
s-m turbulence, 0.SSpcrrent.
A picture of the ixmndary layer as a whole may best
be obtained from the contour diagram of figure 7,
whera each curve represents a prwticuIm value of
u/ Uo. The dotted curve shows the boundary-layer
thickness 8, which is here defined as tlm value of v
where u/ UO=O.995 i7/Uo. The occummco of a separation followed by a reattachment of the layer to the
surface is evidenced by the hump in t.ho contours
from x/D=-2.5 to 2.9. The approach to scparntion
of the turbulent Iayer is shown by the very ropid
increase in slope of tbe curves beyond the hump.
Owing to the fact that the hot wire is insensitive to
direction of flow, the measurements me not exnct in
the immediate vicinity of separation and hence ucitlwr
figure 6 nor figure 7 serves to locate accurately the
separation. The separation points rmd the e-stcnt
of the turbulent layer were therefore obtained from
figure 5. The values of x/Dat S’ and S, me, respectively,
2.51 and 3.03. The attmhed turbulent layer eMends
from 2.81 to 3;03.
The chief function of figures 6 and 7 is to show the
AIR FLOW IN BOUNDARY
LAYER
condition oi the boundary layer upon separation—
whether laminar or turbulent. By inspection it would
be concluded from figure 6 that the boundary layer was
huninar at the first separation point and turbulent
at the second. Mere inspection is, however, rather
inadequate because the conclusion depends on the
judgment of the observer. A far better criterion of the
stat-e of the boundary layer would be provided by a
compmison of observed speed distributions and positions of separation with these same quantities computed
by boundary-layer theory. M present, e.sisting solutions involve approximations whose validity is usually
tested by comparison with experiment. Hence such
solutions may not be rehealupon for accurately defining
the type of boundary layer found by experiment. With
full recognition of the wedmess of the procedure, certtiiu simple comparisons with theory will be made in an
effort to throw a little additional light on the problem.
In the von lGlrm6n-Pohlhausen theory of the
lan~inarboundary layer (reference 9) the criterion for
(W(3’
~, usually denoted
separation is that the parameter ~
by k, shall have the value — 12 at the separation point.
Using the pressure gradient and the boundary-layer
thickness observed at the first separation point, x was
computed to be — 11.8. This value is in excellent
agreement with theory and strongly supports the view
tbat the separation at 2.51 is of the laminar type.
The von K4rmdn-XIW.kan theory (reference 10) has
shown considerable promise in the solution of the
laminm boundary-layer problem tmd has been used by
-ron Doenhoff (reference 11) to calculate the separation
point on the elliptic cylinder used in the present work
for the perfect-fluid pressure distribution. In order to
obtain u result applicable to actual conditions, the
observed pressure distribution must be used. It so
happens that the curve for the. perfect-fluid pressure
distribution fits the observed pressures (curve A, fig. 4)
so closely up to x/D= 2.8 that no better smoothed
curve could be drawn. Since the method of solution
requires, in effect, th!]t the pressure distribution be
fitted by a smoothed curve, -ron Doenhoff’s solution
may be regarded as the best possible. The computed
separation point is 2.38. In view of the approximations involved in the theory and its application, the
tioweementwith the observed separation at 2.51 must
be considered good. Theory therefore supports the
general impression gi-ren by figures 6 and 7 that the
first seprmtion is of the lmninm type.
Lu order to test the second sepmtition, turbulent
boundmy-layer theory might be applied to the reattached layer. This method vms not believed to be
worth while, however, in view of the limited length of
the boundary layer and the unusual conditions under
which it was formed. As has been pointed out, theory
offers no completely satisfactory criterion even under
the best circumstances.
OF AN ELLIPTIC
CWLINDER
215
It is welI, therefore, to ewunine further experimental
evidence that may contribute information as to the
nature of the layer.
SPEED FLUCTUATIONS
IN THE BOUNDARY LAYER
the investigation of the bouuda~ layer near a
flat plate (reference 3), Dryden found speed fl~Lctuations (u-fluctuations) in the laminar boundary layer
having amplitudes as great as those in the turbulent
part of the layer. On the mere existence of fluctuations
alone it was therefore impossible to distinguish between the turbulent and the laminar parts of the
boundary layer.
It is generalIy recognized that the fundrunental difference between the fluctuations in turbulent md
laminar parts of the boundu~ layer is one of correl:~tion between the u-fluctuations and the o-fluctuations,
the o-fluctuations being those occurring normal to the
surface. If the instantaneous values of u- and w
fluctuations are denoted by ui and U, respectively, the
essential difference may be espressed in terms of the
value of Uiuo where the bar denotw average due.
The turbulent shearing stress is given by P utr~. A
turbulent shearing stress must be absent in a laminar
boundary layer and ~i must be zero. By definition,
a turbuIent or partly turbulent layer is one in which a
turbulent shearing stress esists, that is, where ~f has
a value other than zero. The value of UZ1*therefore
furnishes the best criterion as to the turbulent or the
laminar condition of the layer.
With the simple hot-wire anemometer used by Dryden, it was impossible to determine u’of. The experimental dMculties attending such a measurement a.ppem
to be very great, especially in a thin boundary layer,
and no means of doing so was found in the present
investigation. DrycIen has shown, however, in reference 3, thut the simple hot wire does reveal an important
difference between the fluctuations in the two parts of
the boundary layer, namely, tlmt the average frequency
of the fluctuations is mucl) greater in the turbulent
than in the laminar boundary layer. On ~heflat plate,
transition occurred quite abruptly and the position of
transition was clearly defined by the mmk~ difference
in frequency on its two sides.
An effort Fas made in the present [email protected] to see
whether a similar c~ndition fifed
on the elliptic
cylinder and, in particular, to determine whether the
frequency of the fluctuations wouId serve to distinguish
between the turbulent and the laminar parts of the
layer. Accordingly, with a hot wire attached to the
sliding band as previously described, records of the
fluctuations were made by photographing the screen of
a cathode-ray oscillograph connected ta the output of
the compensated amplitier. The wire was 0.00063 inch
in diameter and 0.18 inch long and was attached to
the band at a fixed distance of 0.0158 inch fr~m” the
,.
surface.
Figure 8 shows several of the records obtained at
In
--
216
REPORT
.-.
NO. 652-NATIONAL
. . . . .,. —_._.
ADVISORY
CbMbIITTEE
FOR “AERONAUTIC
.——. x, il.
.,. __ L-._ .-.,
-. —._
3.15
4.94
5.53
6.13
6.72
7.91
9.10
9.70
9,96
Io.xl
10.66
1o,90
11.14
lL38
11.6E
11.86
1Z.1O
Time “scale
1
“: .“-~ ~=.
,
.
.- ,.L.....Lk_. ........ ...
. ...”. .s.
0.5 Second
. .. . ... . . . .. .
“
=:
T
.-- ...
-.+..+ ...–.-...,-..
.*
1
---=—
.... .....-9.... -i-,.-> . -.: .. :,.:= , “~
FIQUBE8.–Oacfl1ograph IWOrda of u-fluetnations in boundary lf+yerat 0,0M9 inch from surface. Obtabmd wtth hot Mm on slld~
band. AIr s~d (th), 70 feet par wad; atmun turbulence, 0.85pereent.
AIR FLOW IN BOUNDAR1”
LAYER OF AN ELLIPTIC
different positions about the surface. It is @.mediat=ely
evident that the frequency is much higher throughout
the reattached layer, beginning near 11.14 incheq than in
any other parts of the layer. No noticeable change has
occurred in either the general character of the wave or
the frequency up ta z=9.10 inches. Beyond this point,
a. regularity in the wave has begun to develop, which
persists through the first separation region. In the
record at 10.30 inches, situated new the center of the
separation region, the regdmity is quite marked, having
a frequency of about 32 cycles per second. It is interesting to note that the fluctuations are everywhere
quite random except through the separation region.
The regular fluctuations are believed to be due to a
slight fore-and-aft oscilhtion of the se aration point,
caused perhaps by pressure pulsations ?rom the vortax
street in the rear of the cylinder.
Owing to the absence of any perceptible increase in
frequency with distance from the leading edge until the
217
CYLINDER
the surface affords a more sensitive means of detecting
transition than any yet employed. Using this device
to examine the boundary layer, it was found that a
weak and very incomplete transition began at x/D= 1.53,
or very near the 6.l-inch position. The boundary
layer has therefore separated at 2.51, not as a purely
Iaminar layer but as a transition type with transition
so incomplete that the layer continues to ~d.ibit most
of the properties of a laminar layer.
BOUNDAEY-LAYEEPHENOMENA AT HIGH
STREAM
TURBULENCE
When it was thus found impoasible to obtain a complete transition without an intervening separation with
the low- turbulence normally prevailing in the tunnel,
the stream turbulence was increased by placing a
l-inch-square-mesh wire screen 18 inches ahead of the
leach.rg edge of the cylinder. (See table I.) The
intensity and the scale of the turbulence produced by
this screen had been measured previously and reported
X,m
@1234567,
7
13[.
89i01/12
2
:
1-
t /’
>~
o
us
Cz
kJ.4
$
\
/00;
\
~3
0
\
-.2
-.4
2
.3
-J
●
“z
/
.2:.
-.8
Trailing
ed’ -+
~4
18
22
Disfmcc
26
from
.50
smen,
34
J
-/.0
o
in.
FIIWEE. ‘a.-Intensity snd sm!s of stream tnrbuknce
prdnced by Mneh mesh wxeem(from referenes 7).
.4
.8
/2
/.6
x/D
20
24
2.8
FIGUBE10.-F’m.?sure dktrlbutton srotmd one sfde of elllptfc cyltudsr.
shesm turbulenm, 0.SS percent; slr speed (U), io feet y second.
skeam turbulence as shown by dgure 9.
reattached layer is reached, it would be concluded by
analogy with Dryden’s results on the flat plate that
transition to a definitdy turbulent layer occurred in the
separation region. With no evidence of transition ahead
of the fist separation point, it appears from all the tests
appIied thus far that laminar separation occurred at
x/D= 2.51. This was the general ooncksion drawn by
the author before a more detailed study of transition
had been made with diflerent amounts of stream turbulence. In anticipation of some of the results to be
given later, it may be stated that a gradual and incomplete transition may occur without any noticeable
change in the frequency of the fluctuations and that
conclusions drawn from the nature of the fluctuations
may be in error in such cases. In the following sections
it will be shown that the diding band and the hot whe
arranged to detect changes in the a-rerage speed near
3!2
3. i
.. ----
Oome A—
Cume B—
in reference 7. Figure 9 gives results taken from this
reference and shows the turbulent conditions prevailing
at the position of the cylinder.
Kerosene-and-lampblack patterns made at various
wind speeds showed a rearward movement of the separation point with increasing speeds up to 40 feet per
second and no detectable movement for further speed
increases. The final position of separation fell at
z/D=2.91.
Since the separation found at the lower
turbulence was absent at all speeds with the higher
turbtience, it was assumed that the transition occurred
at a small value of z/D and that conditions vm.refavorable for a study of a turbulent boundmy layer of considerable length. A working speed of 60 feet per
second, corresponding to a Reynolds hTumber of the
cylinder of 118,000, was chosen for carrying out
boundary-layer measurements.
.-
218
REPORT
h’O. 652-NATIONAL
ADVISORY
Curve B of figure 10 shows the. pressure distribution
about the elliptic cylinder at 60 feet per second with
the higher stream turbulence compared with curve A
taken from figure 4, It will be observed that, even
though each curve represents an invariable condition
of the flow above the critical region, the two curves
are different and the two turbulent ~eparation points
f.dl at slightly diflerent positions,
MEAN-SPEED
DISTRIBUTION
IN THE BOUNDARY LAYER
At U,=60 feet per second traversesacross the boundary layer were made with the”hot-wire anemometer at
12 positions about the surface, beginning 1 inch from
the leading edge and ending at 11.46 inches, 0.12 inch
ahead of the separation point. The traverses at these
extreme positions together with six traverses at intermediate positions are shown in figure 11. It is obvious
that the distributions near the leading edge resemble
those of a laminar boundary layer while those near the
separation point resemble those of a turbulent luyer
but, because of the gradual change, it is impossible to
tell just where transition has begun,
The corresponding contour diagram, giving c~es of
equal u/Uo,is shown in figurti 12. This figure was prepared by making use of all the traverses nnd reading
v ahws of y from faired curves, like those shown in
figure 11, for chosen values of u/Uo. Figure 12 shows
o
.m.
,/2
./6
.20
“24
.28
.32
FOR AERONAUTICS
though figure 12 shows thtit transition does take place,
it fails to show where transition begins and ends. To
bound the transition zone definitely requires a different
treatment of the data or measuremmts of a different
nature.
Ag_@n,testing by comparison with laminm or turbulent boundary-layer theory might be called into play;
but the detection of small departures from the purely
kuninar or purely turbulent condition is made impossible by the approximate nature of the theories, For
this reason it was believed useks to attempt to locate
the beginning of transition by this procedure. It
x, in.
‘,4, 2
.03
6
4
“.
—
.
I
t
I
t
/
I
.052
1
~.12
I
I
.02’
6, ‘
.024
-
ft
-.10
I
02&?t.08
I~
I
I
k
I
0/6 ,06
.0!2
y, in.
.04
CXIMMITTEE
I
t
I
‘
I
1
L4YIK.L
H+––
:&di’i’-
EEEk
,:
.’
of
,’
/2
.8
.;,,
,.
;;
4
0
x/D
Fmmrs .12.–Contoure of equal speed lrr boundary Inyer of eIIfpt[u cyMmlm. Alr
s~d ?~c), 60 fed mr wmrd; % lIS,001;stream Wrbulenm M shwvn by flgura 9.
:_.,
.0/
a2
.03
.04
tJp
.05
.06
:07
.08
FJGWIE il.—Speed dletrlbutfone in boundary layer of allfptic eyltnder. Afr speed
(We),24feet Mr second; % 118,000;stream turbulerme ae shown by figure 9.
the result of the change in type of distribution in such
n manner that transition may be more easily recognized than in figure u.
The phenomenon usually
associated with transition is found after x/D= 1.25;
that is, the bending of the contmm toward the surface
followed by an abrupt bending of the outer contours
awny from the surface. The bending away is due
partly to the development of the turbulent boundary
layer and partly to the approach to separation. It
will be recalled by reference tQfigure 7 that a aindar
bendrng toward the surface, although considerably
more abrupt, is caused by transition after separation
and a rea.ttnchment of the Iayer to the surface. Al-
appeared worth whilq however, to compmc tho pro&
back of @=2
with the usual fi-powm law w-d
with the type of curve computed by the thwwy of
Fediaevsky (reference 8) to aid in deciding whether
the turbulent layer bectime fully developed before
sepm~tion or whether the layer was still of the transition type wheu it separated.
F@re 13 shows speed distributions for x/D=2.02,
2.27, 2.64, 2.77, and 2.88 compared with thut given by
the %power law. In the preparation of this figure, d
rmd U/U. were token from figure 11 at the point
where the slope of the curves is zero. Dcptirturcs
from the jf-power Iaw are h be expected, whether tho
layer is fully turbulent or not, where the adverm
prcxwire gradient is great as at 2.64, 2.77, and 2.88.
At 2.02 and 2.27, where the adverse pr~urc graclient
is small, the departure can reasonably be tttt.ributedto
incomplete transition, especially since the cleparture is
in the direction to be ~xpected if the layer here were
partly lamirmr. It remains then to extimine the effect
A[R FLOW IN BOUNDARY
LAYER
OF AN ELLIPTIC
219
CYLINDER
for a wide variety of pressure gradients. It is seen
from the foregoing expressions for A,, ~, and A, that
t-heeffect. of pressure gradient in the present theory is
to influence the distribution of shearing stress. For a
critical examination of the underlying concepts the
original reference should be consulted.
By the use of values of ~obtained from figure 1l,where
the slope of the curves is zero, values of Toobtained from
the initial slope of the curves of figure 11, and vahs of
of pressure gradient on the distributions near the
separation point.
The theory advanced by Fediaevsh~ in reference 8 is
based on the fundnrnental relation
(2)
in which
r is the shearing stress and 1 is the mixing
length. The de-ielopment by Fediaevaliy differs from
those by Prandtl and von K&rm&n,who have developed
theories bused on equation (2), in that the -wmiationof /
across the boundary layer is expressed by
by from the slope of curve B in @ure 10, Al, A.S,and At
ax
were evaluated for x/D=2:77 and 2.88. The inteagcation
of equation (3) was then cmried out graphically to give
the curves shown in figure 14. The differences between
theory and experiment are greater than those found by
and the variation of r acroes the boundary layer is Fediaevsky in his compmisons with the experimental
curves obt.aineclby Gruschwitz in the turbulent boundexpressed by a power series of the form
ary layer of an airfoil. In one case, where the comparison was made near the beginning of the turbulent layer,
a diiTerenceMe that shown in figure 14 was found and
where n is the shea.rirwstress at the surface. Sufficient the discrepancy was attributed to incomplete transition.
bounda& conditions &ist for the determination of Ao, Since neither Tonor 6 could be accurately-determined in
the present work, the effect of possible errors in these
Alj -&, AS, and 4, and their -raluesare giren as
quantities vras investigated. In no case could such
errors account for more than a small part of the differA,=O
-40=1, fill=:(~)!
ence between the computed and the obserred curves.
It is probahh+,therefore, that separation occurred before
A=-4-3:($f),
&=3+2:(~)
the turbulent layer n-asfully developed.
Some investigators have associated the beginning of
When the substitutions for r and Zare made in equation transition with the point of minimum skin friction (ref(2), the differential equation for the speed distribution erence 12). This tiew seems reasonable when it is conacross the layer becomes
sidered that the skin friction normally decreases as the
boundary-layer thickness increases and onIy the introduction of turbulent shearing stresses can arrest the decrease or cause an increase in the skin friction. In an
effort to locate the point of minimum skin friction, the
local skin friction To -was calculated from the initial
It is shown in reference S that the expression for 1/6, slope of the speecldistribut.ion curves of figure 11 and
although not uni-iermlly true, is a fair appro.simation plotted as a friction coefficient against x/D in fkyre 15.
;=,.,,-O.08(,-f)-0.06(1-~)
/.0
10
.8 -
.8
../
/
,“
/
-----—
E~eri~M
Thea-e ficd
//
-.288
/“
.4
;
f
2.64
//
/
f
1’
/
2 ./’
I
1
I
n
-2
.4
.6
.8
y~b
FIGLXIE
12.-C•
MFFASLWJ
of observed profiles with
$+pOwer law.
Lo
/‘
/
$
—-—
/
/
.6
—-
8
.“
--
o
2
.4
.6
.8
.2
.4
.6
:/6
FIGC8E lL—Comparkcm of obserwl pmflks with FedIaemky theory.
.8
LO
220
REPORT
w:
662-NATIWAL
ADVISORY
A definite minimum exists, although the scatter of the
points and the Iimited number of observations leave
the position of the minimum rather indefinite. The.ilnal
drop in the curve beginning at r/D= 2.2 shows the
effect of nearing the separation point.
To have obtained more values of TOwould have required more speed traverses at the expense of considerable time and e%’ort. It proved to be quite easy,
however, to follow the course of TOby following the
changes in speed from point to point at a small fixed
distance from the suface with the sliding-band apparatus previously described, The.essential conditions were
that the distance from the surface remain tied and
small enough for the velocity gradient.over that distance
to be regarded as linear, A platinum wire 0.00063
inch in diameter and 0.5 inch long was fixed at the center of the band 0.008 inch from the surface, the arrange0
24
x, in.
8:810
.0Q9
. .
E
/.75
.007
..
.005 Cg
r*-
CObIMITTEE.
FOR AER0NAu7W2S
sgain beyond this point. Considering the corwscncss
]f the diagram, this result is in satisfactory ngrcement
with figure 15, which places the minimum at x/D= 1.13.
The presence of transition is not greatly in evidence in
figure 12 before 1.4, hence the minimum in the voltage
mrve of figure 15 possibly coincides with the very
oeginning of transition.
A somewhat differentlnethod of locating trmsition,
involving the use of small pitot tubes, was employed by
Jones (reference 13) in his study of transition on u wing
in f%ght-. The method depended on the chauge occurring in the mean speed distribution in the layer through
khe transition region. In order ta detect the change,
several small pitot tubes, arranged in a compfict group,
were placed within the layer at different dktanccs
from the surface Rnd moved from one position to
another. Jones points out that one pitot tubo placed
in contact with the surface is sufficient and may be used
in wind-tunnel e.xperiment.sbut tlmt in flight tho bank
of several tube: had certain advantages. A single
pitot fibs at the”surface is nearly equivalent to the hot
wire a$~usedin the present experiment.
‘SPEED
FLUCTUATIONS
IN THE BOUNDARY LAYER
The point at x/D= 1.13 (x=4.5 inches) having been
identified
as the point at which transition probably
.003
/.65
began.”oscillograph records of the u-fluctuations in the
layer vjere taken in the neighborhood of the 4.5-inch
.00/
/.55
positiopl to detect a change in frequency. The records
are shown in figure 16, the appmatus being the same as
/.45
that @+d to obtain figure 8. It is “not evident from
mere inspection that tiny clumge in tho average fre/..35
quency has occurred in crossing the 4.5-inc.h position.
In @w of the importance of finding additional cvi/.250
.4
.8
dence of transition, it-~emed worth while to measuro
/.2.
).6 “.20
24
28
““ ““””
the distribution of the root-mean-square wdue of tho
x/D
u-fluctuations across the layer at a number of posiFmun~l&-Varfat!o~ofsbearfng stress along aurfaeoof dlhtfo mlhda. n, akrfu
stress at surface, computed from data of flgrrrea 11 and 12. Eourre obtafned
tions about the surface. Eleven distributions were deterfrom not wfreonalidlng band O.OC@
Inob from surfece. E-voltage drop acrrm wire
mined at the same positions in which the mean-speed
ment being shown diagrammatically in figure 3. i%nc~ measurements with the higher turbulences were made,
the wire could not be calibrated, the actual value of the The hot-wire anemometer and the amplifier ha~-ebeen
speed could not be obtained; but, with the wire carried desc~ibed in an earlier section. The hmgth of the
at a constant temperature of about 110° C. above hot wire in the present case was 0.152 inch. Seven of
room bmperature, the change in the voltage drop, as the distributions are shown in figure 17. By comparithe wire was moved from one position to another, son with the measurements given by Dryden in refereserved to indicate changes in speed and hence in .ro. nce 3, the curves up to and including the one at 1.2fJ
The lower curve of figure 15 wgs obtained in this way. show a marked similarity to the laminar type, while
Although the minimum in the voltage curve is not sharp, those at 1,52, 1.76, and particularly the one nt 2.88
it is possible to locate its position to within +0.05 in Bhow similarity to the turbulent type. It will bc
x/D. The position was estimated to be 1.13, or 4.5 obsemed that the peaks of successive curves increase
inches from the leading edge.
to a maximum and then decrease as the distribution
The speed changes may be deduced rougldy from the changes over into the turbulent type. The decrease
crossing of the contours by referring again to figure 12 in the peak appears to begin between 1.00 and 1.26.
The. contour diagram of figure 18 was prepared by
and remembering that moving the wire by the sliding
bund mta height of 0,008 inch from the surface would taking values of IJ/Dfor particular values of u’/ Uo
correspond to passing along the absc@as of figure from faired curves, of which those shown in figure 17
12 at a height of y/D= O.002. It tiill be noted that the are examples. C?neach curve of equal u’/UOthe ~alue
speed decreases to about x/D= 1.25 and increims is given, expressed as a percentage (100 u’/Uo), This
AIR FLOW IN BOUNDARY
LAYER OF AN ELLIPTIC
diagram presents a picture of the fluctuations in the
layer as a whole and again shows the region of large
fluctuations near the surface in the neighborhood of
2@=l. oo.
It will be recalled that the minimum in the skin friction, as indicated by the voltage curve of &ure 15, fell
at x/D= 1.13, just midway between the curves at 1.00
and 1.26 in figure 17 where the peak in u’/UO began to
decrease. It is aIso quite evident from figure 18 that
the fluctuations possess certain singularities in this
221
CYLINDER
to a sliding band was a reliable device for indicating
the bti
of trfition.
SinCethe simplicity Of the
procedure made it possible to detect transition very
quickly, a somewhat ~xtended investigation was undertaken to determine how the beginning point of transit.ion shifted when the stream turbulence wag changed.
Several screens for producing turbulence were available,
as part of the standard wind-tunnel equipment, for
which the intensity and the scale of the turbulence were
known as a function of distance downstream from the
x, in.
3.62
3.92
4.21
4.44
4.6a
5.10
5.4C
5.7C
6.OC
Tzme.-
t
0.5
scale
second
{
FkiusE 10.-CscClogmph remrde of u-flnctuatlone in bundmy layer at O.01~ Inch from surhce obtsfned wfth hot wfre on eIIdfng
band. Afr epeed (W), W fe@ w seconq stresm tnrbolenm ss ehofm JJ.Ifhwe 9.
region. The etidence from the magnitude and the
distribution of the fluctuations supports the assumption that the minimum in the skin friction denotes the
beginning of transition. The fact that no frequency
change was apparent in this region may be construed
to mean that frequency change is an insensitive test
of the beginning of a very gradual transition.
EFFECT OF INTENSJTY AND SCALE OF STREAM
TURBULENCE ON TRANSITION
By the time the work already described had been
done, it seemed fairly certain that a hot wire attached
209142-40-16
screen. The procedure was to vmy the intensity of the
turbulence, and to a Iimited extent the scaIe, by placing
one of the screens at different distances upstream from
the cylinder. The chief changes in scaIe were accomplished by ueing screens of dilYerentmesh size. The
screens are described in table I. Measured values of
intensity, u’/ Uo,and scaIe, Z, of the turbulence produced
by these screens are given in reference 7. The values
of u’/ U. and Z used in the present work were taken
from the least-square lines of figures 10 and 7, respectively, of reference 7.
222
REPORT
NO. ““652—NATIONAL ADVISORY
—
.—
FOR AERONAUTICS
appeared at distances of about 12 mesh lengths for all
the screens. The uniformity of speed buck of the
screens is treated in detail in reference 7.
The sliding bancl and the meclmnisxn for moving it
have already been described in connection with figure 3.
A wire 0,00063 inch in dimneter and 0.5 inch long was
attached to the band at a distance of 0.00S inch from
the surface, the set-up being the silme as thtit used to
obtain the voltage curve of figure 15. The wire WM
connected as one arm of a Whefltstone bridge, which
was used in the prelirnhry part of the work to hold
The variation of u’/UOand L with distance from the
l-inch screen is shown in figure 9. The @me illustrates one source of .uncerhinty in this procedure,
namely, that uf/ UOdecreases from the le~ding to the
trailing edge of the cylinder and L increases slightly,
leaving the choice of vahw for u’/Uo and L som-eivhat
arbitrary. The change was the greater the smaller the
mesh of the screens, hence screens of smaller mesh
than the l-inch were not used. There were available,
besides the l-inch mesh, a 3%nch and a 5-inch mesh,
all screens being approximately geometrically similar.
.32 ~
COMMITTEE
-.
.—
-—.—
!
.24
\
5
.16
..759
“ ’503
\
I@O
L26
r
\
/
.08
P
b
k
—,, .
\
~
0
.00t?-
.0080
-
*.
.o@
+
.016
o
J
0
“““.008
““.0[6“”
.024
-.040
.0.52
%/6
/
‘.-
\
L76
.08
.
0
.C08
.016“
:“a24’
.m2
lk29
.Or6“
4“
““.(22
.02
.a4o
:0.43
.mo
.088
.
./6
~
.08 Jv H
o
o
.-.7.
.008
.cv6
—
.22M
.
—
i
.>24
.032
.040
17.—DfstrIbution of u-fluctuations In lxmndsry Iaysr.
F IGUEE
.t?48
y/D
.056
%
—.
.064
.072
:
Air spsed ( L@, W fest ~r semnd; strum turbulence as shown In flgum 9,
In order to specify a definite value of intensity and
scale, the values of u’/ U. and L selected were tlose
found in the undisturbed stream at the section of the
tunnel midway between the leading edge of the cylinder
and the beginning of transition.
In order to avoid irregularities in the average speed
over the cross section of the stream and to insure isotropic turbulence, the screens were not placed nearer
to the leading edge than 16 mesh lengths. In the investigation reported in reference 7, it w= found that
the regular pattern of maxima and minima in mean
speed caused by the wake of the individual wires dia-
the wire at a fixed temperature of about 100° C. above
room temperature while the voltage acros9 the wire
was read on a potentiometer. Lmt-erthe procedure was
changed simp~y to reading the unbldtmee of tho bridge
on a galvanometers for each position of the btincl,
Since the two methods gave curves with minima in
identical positions, the latter method was adopted because of the rapidity with which readings could ho
taken.
Figurr 19 gives three esamp]es of tho type of curve
obtained when the galvanometers reading was plotted
against positiorr of the wire. The wind speed was set
AIR FLOW IN BOUNDARY
LAYER
at 60 feet per second in each case, giving a fied Iteynolds Number of 118,000, and the turbulence was
varied by shifting the position of the l-inch screen.
Curve A was obtained with the screen 18 inch- ahead
of the leading edge of the cylinder, curve B with the
screen 24 inches ahead, and curve C with the screen 33
inches ahead. Since the same screen was used, the
shift in the position of the minimum along the abscissa
is due mainly to the change in the intensity of the
turbulence.
The minimum was usually found from a more complete curve like those shown in figure 15; then, with the
gal-mnometer sensitivity greatly increased, the region of
the minimum was explored in detail, as in figure 19.
An unaccounted-for irregularity in the curves was always found near the 4-inch position. The irreguhwity
was small compared with the mininmrn denoting transition and was never confused with it but, when the two
felI close together, the irregularity in the curve tended
to obscure the position of the minimum.
A somewhat puzzling situation was encountered when
curves were obtained with no screen in the tunnel and
the lowest condition of turbulence prevailed. It will be
recalled that all available evidence pointed to a hnnirmr
separation under this condition with the turbulent layer
de-reIoping only after separation. It was surprising,
therefore, to find the curves shown in figure 20 with an
OF AN ELLIPTIC
CYLINDER
223
the result of separation, the emming rise following the
minima being caused either by a reuttacbment of the
layer or reverse flow. It should be pointed out that,
even though a minimum is found in the separation
region, the hot wire ancl the sliding band is not an appro-
.02
.064
.055
FIGUM.
19.-Effwtof stream turbuknee on poaftfon of skhs frictkm minims. Turbulence pmdumd by I-fneh mrwem Alrspsed (U), 60feet par second; hot wfre on
aUdfnKband 0.@3 inch from surface.
.045
.04
g
.=
.024
.0/6
.W
G
.4
.8
1.2
1.6
XfD
,?0
2!4
28
32
FIGUEE
18.-Contours of eqnnl u’/Wofn boimdar~ laser.
vahwa of 10I U’ltri. Afr speed, 60 feet B
figure 9.
Nsmbers on aurvea @e
sacon~ stream turbulsncs as show bI
akable minimum near the ti.1-inch position, much
tit
ahead of separation at the 10-inch position. Curves
taken at successively decreasing speeds showed minima
gradually fading into an inflection and then disappearing.
The minima in @m-e 20 back of the 8-inch position are
priate device for accurately locating separation because
of the insensitivity of the wire to direction of flow. In
general, the minima do not coincide exactly with the
position of separation as indicated by kerosene and hunpblack.
Another feature of the minima shown in figure 20 is
that they do not shift appreciably from the 6.1-inch
position as the speed of the stream is changed. It was
noted also, when the speed was kept constant at 60 feet
per second and the turbulence was varied by screens,
that the intensity could be raised to about 2 percent
with the l-inch screen and still higher -with the larger
screens before the minimum moved perceptibly from
the 6.1-inch position. These facts made the connection
between the minima- at this point tmd trrmsition look
somewhat doubtful. If the minima were reauy due tO
the beginning of transition, the boundary layer just
back of the 6.1-inch position was evidently unstable
enough to permit transition at alI but very low speeds
and was so stable just ahead of this position that only
high speed and high intensity of turbulence could cause
transition to progress forward. To account for such a
—..—
224
REPORT
NO. 652—NATIONAL--ADVISORY
COMMITTEE
FOR A-ERONAUTICS
‘-
gradient.
condition one is led to look for some natural cause of pressure
It is well known that transition
instability at this point.
rarely occurs in a region of accelerating pressure grtiIt is known that pressure gradient has a marked in- dient, hence the necessity for higlL turbulence to force
fluence on transition, an accelerating pressure gradient transition ahead of 6.1 inches. The beginning of
tending to prevent. transition ~nd rtnopposing pqeesure transition coinciding with n miniium in the 6.l-inch
gmdient tending to promote transition. Figures 4 and position is therefore not contradictory to reason. When
such behavior of the minimum as movement forward
x, m?.
with sufficiently increased turbulence and disappearance
f2
/0
8
2
6
4
with suf%ciently increased speed was considorcd in
addition, it was impossible to escape the conclusion
that this minimum was not like the fixed irregularity at
\ .- ix
I ..-.
the 4-inch position butm-as associated with th~ beginning of tra~ition just as definitdy as the minima in
figure~i5.
C@es similar to those of figure 19were next obtained
with tie 3X- and 5-inch screens, the speed in all cases
bein@O feet per second. The positions of the minima-,
found from the severaI curvw, were then plotted
against the intensity of the turbulence from the difTerent screens to give the three curves shown in figure 21.
The effect-of the scale is quite evident from the sepmation Of tlm curves. Figure 21 shows thtit a greater
intendty of large-scale turbulence is required to move
trmsition forward than is required of a turbulence of
rm
x. m.
.0743
r-
“:%
~-.
-,
.m5-.+
‘FQ
E
-i
—
::.
B4
I
o
I
t
1
.4
.8
/.2
1
/.6
x/D
I
2.0
1
.cz4
1
I
:2.8. ” 32
—
—
FIGURE
!M.-skln friction mkdma In boundary layer of elliptic cylbdar for free
tunnel mnrlkloq strwm tnrbnlence.j 0.SSpt.
10 show that the 6.l-inch position roughly divides the
accelerating from the opposing premure gradient at the
10WW.speeds and, at the higher speeds, marks the end
of the accelerating pressure gradient. The 6.l-inch
position appears therefore to be the fist favorable one
for transition.
The possibility that transition might remain relatively
fixed in this position until the speed and the turbulence became sufficiently high may be seen in the following way. At the lower speeds, the presence of a? opposing pressure gradient mak~ transition easy. .& the
speed is raised, the..increasing boundary-layer Reynolds
Number tends to move transition forward, but this
effect is counfaracted at first by a decrease in the opposing pressure gradient accompanying the increased
speed and later by a slight increase in the accelerating
—
.02
.01
.0
—
—
[
1./
,
-
x/D
FIGUEE
2L—Effeet
of stream Wrbulenee on pcelt[ort of t=nr.kton, showing affect uf
lnbrrsity and aede. Afr spwd, 60 feet per swond; R, l18,flM.
small scale. The turbulence is therefore the more
effective the smaller the scale.
In i6ference 7 a simi~areffect is shown for spberos,
where, for a given jntensity, a small-scale turbulence
lowered the critical Reynolds Number of spheres more
than did a large-scale turbulence. In reference 14,
G. I. Taylor has suggested a functional relation betwecu
—
AIR FLOW IN BOUNDARY
LAYER
the criticaI Reynolds hTumberof spherw and the scale
and intensity of the turbulence. Eis reIation is
‘.=fw’rl
where R. is the critical Reynolds lNumber, D is the
diameter of the sphere, and f is a function to be determined by experiment. In figure 18 of reference 7, this
~~ D 115
relation was t&ed by plotting UO ~
tigainst R..
--()
The results for a 5-inch and an 8.55-inch sphere and for
turbulence ranging in scale from 1.25 inches to 0.055
inch approximate a single curve to within the observational error.
The details of the development of Taylor’s relation
are discussed in reference 14. It may be stated in
general terms that the foregoing combination of intensity and scale OCCUN
in the expression for the root-meansquare pressure gradient in the turbulent flow-and that
the effect of turbulence is assumed to be that of the
pressure gradient on transition. The critical Reynolds
Number was brought into the reIation by assuming
that the critical Reynokls Number corresponded to a
definite position of transition on the sphere for all
conditions of turbulence. With the position of tiansition fixed, the critical Reynolds Number became the
variable.
In the case of the elliptic cylinder the procedure was
arranged so that the Reynolds Number remained fked
and the position of transition was allowed to vary.
There should therefore exist a functional relation be
tween position of transition and the same combination
of scale and intensity of the turbulence.
In figure 22, ~0 ~ ‘/5 has been plotted against the
()
observed position of the minima. For each point the
value of u’/UO and Z was taken as that corresponding
to the undisturbed stream at the section of the tunnel
midway between the leading edge of the cylinder and
the position of the point on the surface. This procedure
for selecting u’/UOand L was adopted on the assumption that no one part of the laminar layer was more
sensitive to outside disturbances than another. It wiII
be obsem-ed that the points fall nearer to a single curve
in this figure than they do in figure 21, where the scale
was not taken into account. Although there are systematic departures from the curve of figure 22, these
departures do not foIIow in the order of the changes in
scale, i. e., the points for the 3)&inch screen tend to
lie be~ow the curve, whereas those for the 5-inch screen
tend to lie above the curve. In this connection, it
shouId be pointed out that the sliding-band method
was not entirely free from systematic errors, for it
was found that the position of the minimum became
displaced SIightly if at any time the band did not fit
the cylinder snugly. The magnitude of the shift was
large enough to cause the systematic differences in
figure 22,
OF AN ELLIPTIC
225
Cl”LINDER
This part of the investigation has dealt with only
the beginning of transition. It seems entirely possible
that turbulence may affect the extent of transition as
well as the beginning, in which case the full effect of
turbulence is not taken into account. In consideration
of this fact, together with the uncertainties inherent in
the procedure and the arbitrariness in the choice of
u’/ U. and L, the approximation to a single curve in
figure 22 is as good as may be expected. Taylor’s
theory therefore appears to account for the relative
effects of the scale and the intensity of stream turbu-
%,(7”Mr*60ktp.m
FIGURE
ZZ.-Positionof tmnsftIon as functfon of — —
secon@ R., IISJJM.
lence on transition to as close a degree of approximation
M the present experiment can detect.
CONCLUSION
A case has been presented in which boundary-layer
separation was followed by a rest tachment of the layer
to the surface. Transition occurred in the separation
zone and the reattached layer was turbulent. The
~eparation was of a nearly laminar type but not purely
[aminar because of a -wry incomplete transition beginning ahead of the separation point near the pressure
minimum. This case might be called “transition by
separation,” although such a designation would not
mark the phenomenon as unique, since transition
probably always occurs somewhere in the detached
a.yer after a laminm or nearly laminar separation. It
was probably the occurrence of this transition near the
~epa.rationpoint, brought about by a particular set of
:onditions, that made a reattachmentt of the layer
226
REPORT
NO; 662-NATIONAL
ADVISORY
possible, The conditions were a low stream turbulence.
and a Reynolds Number in the neighborhood of 139,000.
When the stream turbulence was raised to about 4
percent, it was impossible to obtain sepamtion before
transition at any Reynolde Number. In this case,
transition took place gradually, beginning at 4% inches
from the leading edge of the g~liptic cylinder.
It was shown that the minimum in the distribution of
skin friction along the surface of the cylindor marked
the beginning of transition and that a hot wire mounted
on a sliding band served as a satisfactory device for
finding the minimum.
At a fixed Reynolds Number, the position of the
beginning of transition on the cylinder was found to
depend on the scale of the turbulence M well as on the
intensity. A functional relation was found to exist
between the position x/l? of the beginning of transition
COMMITTEE
2. King. L. V.: On the Convection of Heat from SmaU Cylinders
in a Stream of Fluid: Det.erminatiou of the Convection
Constants of Small Platinum W’irsa with Applications to
Phil. Trans. I@. Sot., sec. A,
Hot-Wire Anemometry.
~“ol.214, 1914, pp. 373-432
3. Dryden, Hugh L.: Air Flow in the Boundary Layer Near a
Plate. T. R. No. 562, 1?. A. C. A., 1936.
4. Mock, W. C., Jr.: Alternating-Current
Equipment for the
Measurement of Fluctuations of Air Spe6d in Turbulent
Flow. T. R. No. 598, N. A. C. A., 1937.
5. Dryden, H. L., and Kuethe, A. M.: Effect of Turi.mlcncc in
Whd Tunnel Measurements.
T. R. No. 342, N. A. C. A.,
1930.
& Dryden, H. L., and Kuethe,
7.
S.
9.
NATIONAL-”
BUREAU
OF STANDARDS,
Washington, D. C., Awu.d 6, 19$tT.. ” -.
TABLE
I.—DIMENSIONS
OF SQUAREMESH
FOR PRODUCING. TURBULENCE
““”--
10.
SCREENS
1L
Norol-1
in. ‘
:H
6
Arerz&
measured
mwh,
h.
: F5
5.016
Avernge
messnred
wtre or rti
dIan&er,
0.106
.Osa
.’376
MatarId
Iron wire.
Cyltndrkml wodm
CylLndrkal wden
FOR AERONAUTICS
A. M.: The Measurement of
Fluctuations of Air Speed by the Hot-Wre Anemorncter.
T. R. NO. 320, N. A. (1 A., 1929.
Dr~dcn, Hugh L., Schubauer, G. B., Mock, W. C., Jr., and
Skramstad, H. Ii.: Measurements of Inteusity and Scale
of Wind-Tunnel Turbulence and Their Relation to the
Critical Reynolds Number of Spheres. T. R. No. 581,
N. A. C. A., 1937.
Fediaevsky, Ii.: Turbulent Boundary Layer of an Airfoil.
l’. M. No. 822, N. A. C. A., 1937.
Polilhausen, IL: Zur nltherungmvciacn Integrrd ion dcr Differentialgleiohung der Iaminaren Grenzschicht.
Z. f. a.
M. M., Bd. 1, 1921, S. 262-268.
vofi K&rm6n, Th., and .Millikan, C. B.: On the Theory of
Laminar Boundary Layers Involving Separation.
T. R.
No. 504, N. A. C. A., 1934.
vcn_Doenhoff, Albert. E.: An Application of the von Kdr.
m6n-Millikan Laminar Boundary-Layer Theory and Con~T. N. No. 544, N. A. C. A.,
parison with Experiment.
i935.
12. F6.ge, A.: Experiments
rods.
rods.
REFERENCES
1. Sohubauer,G. B.: Air F1OW
in a SeparatingLarninarBoundary Layer. T. R:-No. 527,N. .4. C. A., 1935.
on a Sphe~e at Critical Reynolds
Ntibers.
R. & M. No. 1766, British A. R. C., 1937.
13. Jorma, B. Melvill: Flight Experiments on the Boulldary
Layer. Jour. Aero. Sci., vol. 5, no. 3, Jan. 1938, pp. 81-W.
14. Taylor, G. I.: Statistical Theory of Turbulence.
V. Effect
of Turbulence on Boundary Layer. Theorctlcal Discussion of Relationship between Scale of Turbulence and
Critical Resistance of Spheres. Proc. ROY. SOC. (Loudon), ser. A, vol. 156, no. 8SS, Aug. 1936, pp. 307-317


© Copyright 2026