
Igneous Rock Classification At Gale (Sols 13-800 - USRA
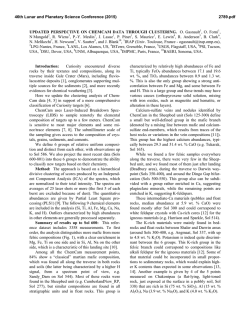
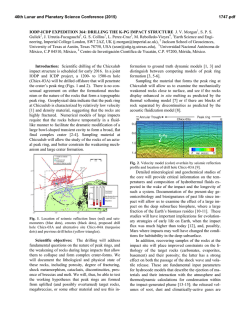
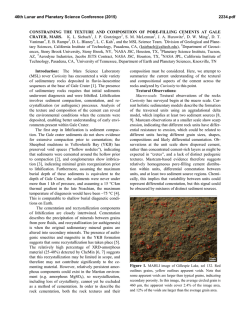
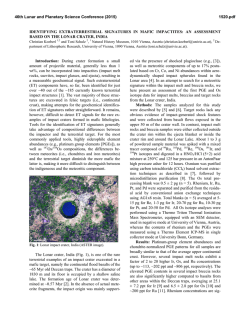
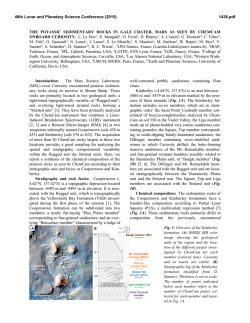
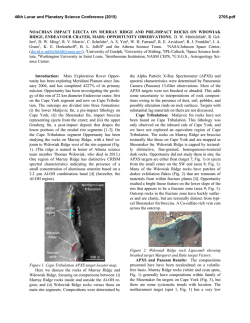
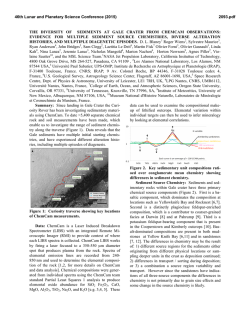
46th Lunar and Planetary Science Conference (2015)
2452.pdf
Igneous Rock Classification At Gale (Sols 13-800). A. Cousin1, V. Sautter2, N. Mangold3, C. Fabre4, O. Forni5, W.
Rapin5, M. Fisk6, O.Gasnault5, N. Lanza1, J. Lasue5, P -Y. Meslin5, H. Newson7, A. Ollila8, V. Payre4, R.C. Wiens1, S. Maurice5,
and ChemCam Team. 1LANL, Los Alamos, USA; 2MNHN, Paris, France; 3LPGN, Nantes, France; 4G2E, Nancy, France;
5
IRAP, Toulouse, France; 6College of Earth, Ocean, and Atmospheric Sciences, OR, USA; 7UNM, Albuquerque, USA;
8
Chevron, Houston, TX, USA [[email protected]]
Introduction: Textural and compositional analyses
using MastCam [1] and ChemCam [2,3] instruments
have identified a total of 53 massive (non layered)
igneous targets. These range from mafic targets where
feldspars form less than 50% of the rock to felsic samples where feldspars are the dominant mineral. These
rocks have been described as floats on Bradbury Rise
[4] and all along the traverse up to sol 800. This work
presents a classification of these 53 igneous targets. A
companion abstract [5] focuses in more detail on ten of
the most feldspar-rich and alkaline targets.
Methodology: Textures have been assessed using
images. MastCam and RMI cameras allow the distinction of grain shape distribution. The smallest visible
grain seen by RMI correponds to 95 µm at 2.4m or
140 µm at 3.6 m. MastCam is particularly useful also
to provide color images and context.
ChemCam’s LIBS analysis uses a 300-500 µm
analysis footprint to sample the targets over multiple
locations (11520 spectra taken on > 384 points for
these 53 targets). Independent component analyses
(ICA) is used to assess lateral heterogeneity between
different points within a raster on a given rock target,
as well as chemical variation with depth within a shot
sequence [6]. Quantification of key element ratios
from the spectral characteristics of the target is performed by univariate analysis [7] which derives quantitative estimates from peak areas of well-chosen LIBS
lines using on board calibration targets (CCCTs) [8].
ChemCam offers thus the first opportunity to assess
mineralogical diversity at grain-size scales and, from
this, lithological diversity.
Rock morphology and texture: The rocks are mainly
floats or form clasts in conglomerates (Fig.1). They are
heterogneous, grade in color from dark gray to lighttoned with many faceted rocks due to wind erosion.
From their morphology and texture, five groups
have been clearly identified [9] and are listed in Table
1: (1) dark aphanitic/phaneritic rocks with few lighttoned microliths. Some of them are shiny with no visible grains and with conchoidal fractures (21 rocks Fig. 1a), (2) porphyritic rocks with light-toned euhedral phenocrysts (up to 20 mm in length) set in a dark
mesostasis (9 rocks - Fig. 1b), (3) leucocrate rocks
with no visible grains, sometimes vesiculated or forming slabs covered by dust (6 rocks - Fig. 1c), (4) dark
rocks either fine (< 1mm) or coarse grained (> 1mm)
with same amount of dark and light equigranular crystals (8 rocks – Fig. 1d), (5) leucocrate coarse grained
(> 4mm) rocks either pristine or chunky; the later
won’t be used for their chemistry (9 rocks - Fig. 1e).
Figure 1: Rock morphology from MastCam and RMI images,
for each emblematic target/group. A) Group 1, Pisolet (sol
332), B) Group 2, Harrison (sol 512), C) Group 3, Becraft
(sol 421), D) Group 4, La Reine (sol 346) and E) Group 5,
Sparkle (sol 514).
Table 1: List of igneous targets used for this study, ranked by
sol number and grouped by morphology and texture analysis.
From textural analyses it is possible to distinguish
36 rocks with effusive texture ranging from glassy to
porphyritic (groups 1, 2, 3), and 17 intrusive rocks
ranging from aphanitic/phaneritic to porphyritic
(groups 4 & 5). From the images, the ratio of lighttoned minerals to dark-toned minerals allows further
identification of mafic and felsic sub-groups within
effusive and intrusive classes. Note that vesiculated
rocks of group 3 could be either pumice or melted
rocks resulting from impact.
For this study, we have voluntarily omitted 18 targets which are interpretated to be igneous but classified as “uncertain texture”, as Jake-M target [10].
Chemical composition and mineral inference The 53
anhydrous targets have been plotted by molar Al/Si vs.
(Fe+Mg)/Si (Fig. 2a) where felsic minerals (quartz,
plagioclase solid-solution, nepheline) plot on the Yaxis whilst mafic ones (HCP, LCP, olivine, oxides)
plot on the X-axis. Rocks in group 3 plot on or close to
the Y-axis in figure 2a. Light-toned intrusive rocks
(group 5, in red) such as Sparkle plot on a mixing line
between oligoclase-albite (Al/Si: 0.48-0.33 ; An30-0)
46th Lunar and Planetary Science Conference (2015)
and a silica-rich component. Vesiculated light-toned
rocks such as Becraft (group 3, in brown) have compositions close to the macusanite CCCT, a rhyolitc glass
(Al/Si < 0.33), indicative of silica saturated rocks
mixed with an alkali-feldspar component. Porphyritic
effusive targets (group 2) and coarse-grained intrusives
(group 4, in green) plot on the same mixing line between oligoclase (Al/Si 0.38-0.44; An 10-28) and
mafic compositions. Just one rock, Mara (group 4),
plots on a noritic trend joining andesine and pigeonite.
Rocks from group 1 with barely visible grains plot (in
blue) in the middle of the basaltic mixing line within
the blue ellipse.
Figure 2: a) Al/Si vs. (Fe+Mg)/Si (molar ratios) diagram.
Only trends are shown for each group for clarity. b) FM-CNK ternary diagram. These quantitative values have been
retrieved using the univariate technique. The pink triangle
and circle correspond to macusanite and shergottite CCCTs.
Group 5 felsic rocks show an enrichment in Ca and Si
whereas group 3 felsic rocks plot closer to the alkali
endmember (Fig. 2b). Figure 2 (a and b) shows that
group 5 felsic rocks are plagioclase rich whereas group
3 felsic rocks are enriched in alkali feldspars.
Figure 3 : ICA Na vs. K ICA scores (coefficient correlations)
showing a clear distinction between the two felsic groups (3
and 5, in brown and red, resp.).
This distinction can also be observed in Fig. 3
where the group 3 felsic rocks (in brown) plot close to
Link, which was one of the first K-rich conglomerate
targets observed with ChemCam [11], whereas felsic
group 5 shows a higher Na/K ratio (in red). Some of
the porphyritic points (in dark green) plot close to the
group 3 alkali-rich targets. Those points correspond to
some k-rich zoning of plagioclase phenocrysts ob-
2452.pdf
served on these porphyritic targets, such as Harrison
[12]. Moreover, group 3 felsic targets show a higher
Ba content and Rb signal than in any other groups,
suggesting the existence of K-rich feldspars [13].
Whole rocks estimation for each group Tentative
whole rocks calculation where computed when possible. For the intrusive rocks (group 4 & 5), only targets
with at least 9 points analysis are taken into account:
an average of all points should be able to give access to
the whole rock composition. For targets with aphanitic
textures (group 1 & 3), minerals are smaller to the laser
beam; therefore an average of all locations for each
rock gives a good estimation. In group 2, only Harrison’s composition has been constrained through a
combination of modal proportions and average composition of felsic and mafic phases [12].
The whole-rock composition allows us to distinguish two trends: a quartz-normative trend including
rocks from group 5 which are close to diorite/granodiorite ; groups 2 and 3 are nephelinenormative and plot in the trachyandesite field (group 2)
and trachyte field (group 3). Group 1 plots between
basanite and basalt [See [5] for more details].
Conclusion This study focuses on igneous targets
starting from their textures based on images but clearly
corroborated by the compositional data. These igneous
rocks revealed a large variability, from intrusive to
effusive, with basaltic up to felsic compositions (plagioclase or alkali-felspars – rich rocks). Group 3 rocks
contain exclusively Si, Al, Na and K as major element
and high Ba content; they are the first felsic alkali-rich
volcanic rocks analyzed in situ so far on Mars. Some
of their texture suggest that they could be impact melt.
Chemical variations exist inside each group suggesting that groups based on texture do not imply a
unique composition, but overall there is a good consistency between texture and chemistry that allow a firstorder interpreation for these groups. So we propose
that Group 1 would correspond to basalt/basanite rocks
and Group 2 to trachyandesite targets; Trachytes would
belong to Group 3; Group 4 would correpond to gabbro/norites, and Group 5 to granodiorites/diorites
rocks. Gale is often described as a sedimentary terrain;
the presence and variability of igneous rocks, as detected by CCAM from sol 13, should not be underestimated. Moreover, such a variety of igneous rocks has
important implications for the globally averaged Mars
compositions and for the formation of the southern
highlands.
References: [1] Bell III et al. 2012, LPSC #2541, [2] Wiens
et al. 2012, Space Science Reviews 170, [3] Maurice et al.
2012, Space Science Reviews 170, [4] Sautter et al. 2014,
JGR-Planets, [5] Sautter et al., this meeting, [6] Forni et al.
2013, SAB, [7] Fabre et al. 2014, SAB, [8] Fabre et al.
2011, SAB, [9] Sautter et al. 2014, #1369 LPSC 2014, [10]
Stolper et al. 2013, Science 341, [11] Mangold et al. 2013
LPSC #1267, [12] Sautter et al. 2014, Mars 8th conference,
[13] Ollila et al. 2013 JGR-Planets.

© Copyright 2026