
Key Findings from the 2014/15 Post Deyr Seasonal Food
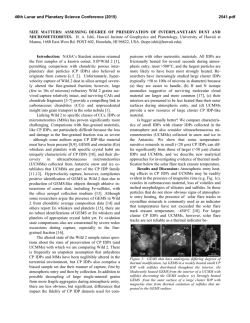
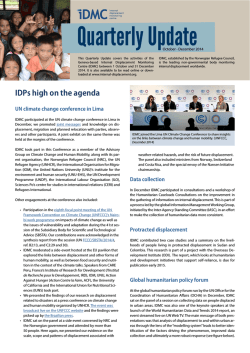
Information for Better Livelihoods! KEY FINDINGS FROM THE 2014/15 POST Deyr SEASONAL FOOD SECURITY AND NUTRITION ASSESSMENT IN SOMALIA 29 January 2015, Nairobi FSNAU Post Deyr 2014/15 Seasonal Assessment Scope and Fmeline: Food security and nutri8on assessment of rural, urban and displaced popula8ons across Somalia between October-‐December (for field work) Process: (1) FSNAU-‐led assessment with the par8cipa8on of Technical staff of other UN agencies, partners and government ins8tu8ons (2) Regional and All-‐Team analysis workshops in Garowe & Hargeisa with government and partners (3) Technical veRng in Mogadishu (Nutri8on) and Nairobi with government and partners (5) Presenta8on to Government authori8es (Mogadishu, Garowe and Hargeisa) (6) Presenta8on to other stakeholders in Nairobi and technical release (7) Public dissemina8on (technical release, food security and nutri8on outlook; comprehensive technical reports) Key Message Highlights § A largely favorable Deyr season has contributed to a reduc8on in the number of people in Crisis and Emergency (IPC Phases 3 and 4) – a nearly 29% decrease since July 2014 and the lowest since the peak of the famine period in 2011. § However, 731 000 people remain acutely food insecure (IPC Phases 3 and 4) and require urgent humanitarian assistance and livelihood support through mid 2015 § Nearly 2.3 million addi8onal people are classified as Stressed (IPC Phase 2); This group of households may struggle to meet their minimal food requirements through the end of the year, they remain highly vulnerable to shocks that could push them back to food security crisis if no appropriate support is provided. § 202 000 children under 5 years of age are acutely malnourished of which 36 700 are severely malnourished and face a higher risk of morbidity and death; § In flood affected and rainfall deficit areas, the situa8on is likely to con8nue deteriora8ng further un8l the start of off-‐season harvest in March and Gu rains in April. PresentaFon Outline • Sectoral Analysis – Abdullahi Khalif, Na8onal Technical Manager, FEWS NET Somalia • NutriFon Analysis – Nina Dodd, Nutri8on Technical Manager, FSNAU • Integrated Food Security Analysis – Tamara Nanitashvili, Food Security Technical Manager, FSNAU • Summary Results and Key Messages -‐ Daniel Molla, Chief Technical Advisor, FSNAU SECTORAL ANALYSIS • Civil Insecurity • Climate • Markets • Livestock • Agriculture Civil Insecurity- Most Likely Scenario (Jan-Jun 2015) o Most of the South and Central Somalia are either High or Medium security Risk. However in the North and parts of Central are low security risk o Some improvements in trade flow in Hiran, Shabelles, Bay/Bakool, Gedo. Current Security Hotspots: Banadir, Bay, Bakool, Hiran, Lower Shabelle , Middle Shabelle, Gedo, Lower Juba and Middle Juba. Political Developments :Establishments Southwestern State regional government and new cabinet under forma8on Impact to Livelihoods: o Informal taxa8ons (frequent check points), periodic request of contribu8ons, collec8ons of Zakat, evic8ons from governments and corporate proper8es. Justice and rule of law: o Areas where the governments has re-‐established territorial control, local civilian governance including func8oning jus8ce are weak or absent. 2014 Deyr Rainfall Performance Deyr 2014 rainfall (comparison with 2001-2013 mean) Oct. RFE Totals (mm) Nov. RFE Totals (mm) Dec. RFE Totals (mm) NDVI (3rd Dekad of Dec) Deyr 2014 Statement: 2014 Deyr rains (October-December) were largely normal rains in most parts of the country. • Areas with below normal rainfall: Localized parts of Hawd, Nugal Valley, Sool plateau and East Golis (Northwest regions). Few pockets in North Mudug and Bari regions Northeast regions parts of Hawd and Addun of Central Regions. Agro-pastoral and riverine livelihoods of Hiran Region. Parts of Garbaharey and Bardera districts (Gedo region). Coastal areas in both Middle and Lower Shabelle Regions. Most of the Juba region, with minimal Deyr rains in Coastal Deeh and Juba agropastoral livelihoods • River Flooding: areas of Balad in Middle Shabelle Region and riverine areas of Middle and Lower Juba regions. Outlook for Xays/Gu 2015 o The remainder of the October to February Xays rains over coastal areas of northwestern Somalia are likely to be near average. o The March to May 2015 rains in Somalia are likely to be near average in terms of cumulative rainfall (especially over southern Somalia) and near-normal onset of seasonal rains. JFM, 2015: rainfall anomalies MAM, 2015: rainfall anomalies wetter-‐than-‐average MAM for parts of S. Somalia, Long-term forecasts have very low reliability skills and will require close monitoring and updates. AGRICULTURE Trends in Cereal ProducFon (South and Northwest) o 2014 Deyr cereal production (sorghum & maize) in Southern Somalia is estimated at 110 000 MT (including 4300 MT off-season). o 2014 Deyr plus off-season production is 130% of 2013 production, 106% of Post-War Average (1995-2003) and 96% of five year average (2009-2013). o 2014 Deyr cereal production is above average in Bay and near average in Lower Shabelle, the two main surplus producing regions o Poor to below average harvest in Juba & Hiran regions but off-season harvest is expected in Juba riverine areas in March-April o 2014 Gu/Karan season cereal production in Northwest is estimated at 46 500 MT, which is 106% of 2013 production but only 70% of the Average production for 2010-2013 (PET). Deyr 2014/15 Cereal (Maize and Sorghum) ProducFon in Southern Somalia Deyr Cereal ProducFon EsFmates in Southern Somalia FINAL (rounded to 100) Regions Deyr 2014 ProducFon in MT Deyr 2014 Deyr 2014 as % of as % of Deyr PWA Deyr 2013 (1995-‐2013) Deyr 2014 as % of 5 year average (2009-‐2013) Maize Sorghum Total Cereal 400 4,100 4,500 164% 166% 91% Bay 2,800 41,900 44,700 139% 130% 99% Gedo 1,700 4,000 5,700 98% 104% 117% Hiran 1,400 2,900 4,300 120% 74% 114% Juba Dhexe (Middle) 1,600 1,800 3,400 326% 79% 69% Juba Hoose (Lower) Shabelle Dhexe (Middle) Shabelle Hoose (Lower) 500 0 530 46% 38% 41% 9,100 4,800 13,900 137% 117% 106% 20,000 8,700 28,700 117% 86% 90% 37,500 68,200 105,700 130% 107% 96% Bakool Deyr 2014 Total FINAL (rounded to 100) Deyr plus Off-‐season Cereal ProducFon EsFmates in Southern Somalia Deyr 2014 ProducFon in MT Regions Bakool Bay Gedo Hiran Juba Dhexe (Middle) Juba Hoose (Lower) Shabelle Dhexe (Middle) Shabelle Hoose (Lower) Deyr 2014 Total Maize Sorghum Total Cereal 400 2,800 2,800 1,400 3,400 1,800 9,100 20,000 41,700 4,100 41,900 4,000 2,900 1,800 100 4,800 8,700 68,300 4,500 44,700 6,800 4,300 5,200 1,900 13,900 28,700 110,000 Deyr 2014 as % of Deyr 2013 Deyr 2014 as % of Deyr PWA (1995-‐2013) 164% 139% 104% 120% 239% 118% 117% 107% 126% 166% 130% 123% 74% 109% 96% 111% 86% 109% Deyr 2014 as % of 5 year average (2009-‐2013) 91% 99% 131% 114% 87% 63% 103% 88% 96% Livestock o Pasture and water remain favorable in most regions, except localized areas in Sanag, Bari, Mudug, Hiran, and border areas in Lower Gedo and Juba regions o Livestock body conditions are also mostly average to above average in most pastoral areas of the country o Milk availability is average in most of the livelihoods o Camel disease has caused some livestock deaths in Juba and has affected camel milk prices o Average milk production reported also in most of the livelihoods in South and north Outlook through June 2015: • Livestock body condi8ons are likely to remain near average. Pasture, browse, and water availability will be lower than usual in the areas that received less rainfall during the Deyr. • Milk availability will typically, seasonally decline during the Jilaal dry season as pasture availability and the number of milking females decrease. • Medium kidding/lambing, and cajle calving are expected in late March to June, so milk availability will increase, also increased pasture and water availability due to near normal forecast Gu 2015 Total Livestock Exports through Berbera & Bossaso Ports July-‐Dec Livestock Exports 6,000,000 Jan-‐June Livestock Exports 5-‐year Average (2009-‐2013) Number of H eads 5,000,000 4,000,000 3,000,000 2,000,000 1,000,000 0 2009 2010 2011 2012 2013 2014 • Livestock exports in the year 2014 is 4,999, 688 heads compare to recent years. For instance, 8% and 4% higher than 2013 and 2012 respec8vely • Livestock export is expected to increase over the coming months due Ramadan demand. o There has been a decline in livestock prices due to excess market supply o Wage labor to cereal Terms of Trade remain mostly favorable o Mainly due to depressed livestock prices, livestock to cereals Terms of Trade showed a declining trend and are below the five-year average in some regions 10,000 0 Dec-14 Jun-14 Jun-13 Dec-13 Month Dec-12 Jun-12 Dec-11 Jun-11 Dec-10 Jun-10 Dec-09 Jun-09 2,000 Cereal Prices in Markets Affected by Trade Disruption 16000 14000 12000 10000 8000 6000 4000 2000 0 Hudur Dec -‐ 13 JUl -‐ 14 Burdunle Markets Dec -‐ 14 Halgen 5 yr average (Dec) Price per Kg (SLSH) 12,000 4,000 18000 Price per Kg o Prices for most imported commodities have declined or remained stable 14,000 6,000 Dec-08 o Wage labor also stable trend in most regions 16,000 8,000 Jun-08 o In markets in South-Central parts of the country affected by trade disruption, cereal prices have also declined from levels reported in July but remain above five-year average Regional Trends in Cereal Prices (SOSH/SLSH) Juba Valley(White Maize 1 kg) Shabelle Valley(White Maize 1 kg) SorghumBelt(Red Sorghum 1 kg) Central(Red Sorghum 1 kg) NW (White Sorghum 1 kg) 39,000 36,000 33,000 30,000 27,000 24,000 21,000 18,000 15,000 12,000 9,000 6,000 3,000 0 Dec-07 o Local cereal prices increased or were stable from July to November in most markets, but they started declining with the start of the December Deyr Harvest with exception of Lower Juba Price per Kg (SoSH) Market Prices Price ProjecFon Summary through June • Staple Sorghum and maize prices expected to decline seasonably in January through March in most of the southern producer regions (Bay and Shabelle) as a result of average to above average harvest in January • Some markets remain poorly integrated with producer markets and not well served by the local supplies from seasonal produc8on, hence price decline is always shorter period • As a result of record Global rice produc8on in 2014, rice prices are likely to remain stable; however during the high-‐seas (monsoon) season between May to September prices are expected to increase, consistent with seasonal trends • Cajle prices in the South markets have been affected by increased border patrols which restricts movements related to insecurity incidents in northern Kenya. Their price is expected to decline further as markets will be over supplies and market disrupted by border patrols. NUTRITION ANALYSIS Deyr 2014 NutriFon Survey: Main Results Livelihood assessed GAM SAM Stunted Underweight CDR U5DR Morbidity SOUTH CENTRAL REGION • Critical levels of Global Acute Malnutrition (GAM) are seen only in South Central Somalia or among IDPs in South Central and Northeast; no Critical GAM in the Northwest. • Deterioration in GAM was observed among Hargeisa IDPs, Bossaso IDP, and Baidoa IDPs, East Golis, Nugal Valley, and N Gedo Pastoral livelihood zones. • Significant improvement is observed among Bakool pastoralists (24.8% in 2014 Gu to 12.3% in 2014 Deyr) as well as among Mogadishu and Kismayo IDPs • There has been a doubling of Crude Death Rate (CDR) among Dhobley IDPs, indicating a deterioration. • There has also been a doubling of Under-Five Death Rate (U5DR) among Kismayo IDPs even though GAM has improved Bay Agropastoral Bakool Pastoral N Gedo pastoral N Gedo Riverine N Gedo Agro-pastoral Beletweyne District Mataban District Shabelle Riverine Shabelle Agropastoral Baidoa IDP Mogadishu IDP Dolow IDP Dhobley IDP Kismayo IDP Mogadishu urban Dhusamareb IDP Hawd Central Addun Central Kismayo Urban Median 19.0 5.5 25.2 28.8 0.26 0.27 19.3 12.3** 1.5** 2.7 7.7 0.21 0.52 31.7 25.2 3.7** 15.3 23.3 0.51 1.01 27.1 19.9 3.2 16.8 22.6 0.41 0.82 20.9 24.7** 4.2** 11.2 19.4 0.48 0.53 21.6 17.3 4.2 24.2 26.4 0.29 0.41 38.9 17.8 3.2 11.6 16.8 0.47 0.00 50.3 9.6 1.8 10.4 10.1 0.52 1.00 34.6 12.3* 3.5 9.7 11.1 0.35 0.52 29.6 15.3 3.3 31.1 26.2 0.74 1.21 45.2 13.4* 2.5** 12.1 14.3 0.60 0.87 39.2 21.6 4.3 29.0 32.0 0.46 0.89 36.9 11.0** 1.4** 9.4 8.1 1.25 1.55 34.1 8.5** 1.6* 38.9 23.2 0.84 2.08 62.3 9.7 0.9 7.9 9.8 0.48 0.75 15.3 14.4 4.2 7.7 12.0 0.07 0.00 28.6 16.1 2.7 11.1 14.7 0.33 0.89 42.9 9.7 1.2 8.4 9.5 0.13 0.15 38.3 8.9* 1.7* 26.1 14.7 0.55 0.62 47.6 15.3 3.3 11.6 14.7 0.5 0.8 NORTHEAST REGION E Golis (NE) Hawd Central Addun Central Sool plateau Coastal Deeh Bari Urban Bossaso IDP* Qardho IDP Garowe IDP Galkayo IDP Median 10.4** 1.5 6.4 8.3 0.11 0.00 34.8 16.1 2.7 11.1 14.7 0.33 0.89 42.9 9.7 1.2 8.4 9.5 0.13 0.15 38.3 9.4 1.4 6.0 6.0 0.10 0.00 20.3 11.7 1.4 6.5 8.9 0.21 0.75 27.4 14.0 2.7 15.9 16.9 0.41 0.65 17.2 3.1 32.7 29.8 0.36 0.61 30.9 11.1 1.8 16.7 15.9 0.36 1.09 37.8 19.6 3.9 18.4 23.1 0.20 0.59 45.2 15.1 2.6 15.4 19.0 0.05 0.00 23.2 12.9 2.2 13.3 15.3 0.2 0.6 NW Agro pastoral* W Golis/Guban Nugal Valley EGolis (NW) Hawd NW Sool Region Urban Hargeisa IDP Burao IDP Berbera IDP Median 4.8 0.2** 2.4 2.6 0.17 0.00 11.5 8.0 0.8** 12.2 8.6 0.19 0.00 14.5 11.0 1.1 3.7 4.6 0.00 0.00 21.7 11.2 1.6 2.6 7.0 0.04 0.00 17.3 8.9 1.2 0.8 2.2 0.08 0.00 19.1 11.3 1.0 0.4 5.5 0.10 0.00 ~ 11.1 1.6 3.3 6.7 0.11 0.18 9.7 9.7 0.6 9.7 3.0 0.04 0.34 17.8 9.9 1.9 1.5 4.1 0.14 0.00 5 9.9 1.1 2.6 4.6 0.1 0.0 <12.5 <11.5 12.6 4.1 ~ ~ 0.57 1.3 7.2 1.8 ~ ~ 0.17 0.0 12.9 1.5 14.4 1.0 14.6 1.3 ~ NORTHWEST REGION MUAC Coastal deeh Central Cowpea Belt South Gedo Pastoral South Gedo Agropastoral South Gedo Riverine 15.8 13.9 36.4 32.9 ~ ~ ~ ~ 30.4 Post Deyr 2014/15 Prevalence of GAM Among Displaced Populations Across Somalia Very Cri8cal (>30%) 30 Cri8cal (15-‐30%) 21.6 19.6 15.1 Serious (10-‐<14.9%) 9.9 9.7 11.1 20 17.2 14.4 11.1 15.3 13.4 11.0 8.5 10 Alert (5-‐<9.9%) Acceptable (0-‐<5%) • In 5 out of 13 IDP settlements (Galkayo, Garowe, Bossaso, Dolow and Baidoa), prevalence of GAM is Critical (they ranged between 15 to 22%) • Compared to Post Gu 2014 (July), nutrition situation has deteriorated among Bossaso, Baidoa and Dolow IDPs but improved among IDPs in Mogadishu, Kismayo and Dobley. 0 Recent Trends in NutriFon situaFon in Somalia Region: GAM (%) SAM (%) Deyr 2014 Gu 2014 South 16.3 16.9 15.1 Central 14.4 17.3 15.3 South & Central (Combined) North East North West IDPs Rural livelihood OVERALL Deyr 2013 Deyr 2014 Gu 2014 Deyr 2013 3.3 3.6 2.8 13.2 2.7 4.6 2.4 17.2 15.1 3.3 3.7 2.8 12.9 12.7 14 2.2 2.2 2.6 9.9 10.0 10.6 1.1 1.7 2.5 13.4 16.5 15.8 2.5 4.1 3.4 9.9 14.9 13.2 1.3 3.0 2.3 12.0 14.9 14.2 1.9 2.6 2.5 • Nutrition situation in Somalia is improving but the current median rate in South Central region is still above the “Critical” threshold (≥15%) • However, changes in median GAM/SAM over time is not statistically significant Underweight in Somalia Underweight South central Northeast and Central Northwest < 10%: Low prevalence Bakool Pastoral, Dhobley IDP Addun Central, Mogadishu urban N Gedo Agro-‐pastoral, Mataban District , Shabelle Riverine, Mogadishu IDP, Hawd Central, Shabelle Agropastoral, Kismayo Town EGolis (NE), Sool plateau and Coastal Deeh Burao IDPs, Berbera IDPs, Hargeisa IDP, NW Agropastoral, WGolis/Guban, Nugal Valley, EGolis (NW), Hawd NW and Sool Region Urban Bay Agropastoral (19%) N Gedo pastoral (25.2) N Gedo Riverine (19.9) Beletweyne District (17.3) Baidoa IDP(15.3) Kismayo IDP (8.5) Dhusamareb IDP (14.4) Dolow IDP (21.6) Bossaso IDP (17.2) Garowe IDP(19.6)) 10-‐19.9%: Medium prevalence 20-‐29%: High prevalence = 30%: Very high prevalence Bari Urban, Qardho IDP and Galkayo IDP • High prevalence of underweight (WHO cut-offs for level of public health significance>20%) - is seen in some livelihoods in South and among IDPs not in Northeast/Northwest Chronic Malnutrition in Somalia Stun8ng South Central Northeast Northwest < 20%: Low prevalence Bakool Pastoral, N Gedo pastoral, N Gedo Riverine, N Gedo Agro-‐pastoral, Mataban District, Shabelle Riverine, Mogadishu IDP, Dhobley IDP, Hawd Central, Addun Central, Shabelle Agropastoral and Mogadishu rban EGolis (NE), Sool plateau Coastal Deeh, Bari Urban Qardho IDP. Garowe IDP, Galkayo IDP NW Agropastoral, WGolis/ Guban, Nugal Valley, EGolis (NW), Hawd NW, Sool Region Urban, Hargeisa IDP, Burao IDP Berbera IDP 20-‐29%: Medium Bay Agropastoral (19.0), Beletweyne District (17.3), Dolow IDP (21.6), Kismayo Town (8.9) 30-‐39%: High Baidoa IDP (15.3), Kismayo IDP (8.5) Dhusamareb IDP (14.4) Bossaso IDP (17.2) = 40%: Very high prevalence • High chronic malnutrition/Stunting (exceed the 30% threshold) is seen only among IDPs • Low Stunting prevalence in NW NutriFon Trends in Somalia • Consistent with recent historical trends, Median GAM in South Central ( 15.3 %) is higher than in the Northeast (12.9%) and Northwest regions (9.9%). Trends in Underweight prevalence among different regions of Somalia 25 20 22.5 18 17.2 14.5 17.4 15 10 20.6 19.2 15.7 8.4 5.9 6.2 Gu 2013 Deyr 2013/14 16.4 14.7 5 4.6 Gu 2014 Deyr 2014/15 5 0 Deyr 2012/13 South Central NorthEast Change in Nutrition Situation in Somalia Improving in NW/NE is seen by decrease in Critical (red), some Acceptable (green) but SC remains critical(red) Deyr 2014/15 Despite the overall improvement, deterioration in GAM was observed among Hargeisa IDPs, Bossaso IDP, and Baidoa IDPs, East Golis, Nugal Valley, and North Gedo Pastoral livelihood zones. Maternal Malnutrition in Somalia • Very Critical levels of maternal malnutrition was observed among IDPs in Qardho and Dhusamareb and in Hawd Central livelihood zone Key NutriFon Highlights • The overall level of acute malnutrition in Somalia has declined since Post Gu (6 months ago) but the current median rate in South Central region is still “critical” (≥ 15% GAM). • The number of acutely malnourished children across Somalia (prevalence) is estimated at 202 600 (UNDP-2005) which represents a 7 % decline from Post Gu 2014 (6 months ago). Of these 38 200 are severely malnourished which is a 13% decline since Gu 2014 and 31% decline since Deyr 2013/14 (one year ago). More than 80 % of these children are located in South Central region. • Nutrition situation remains Serious to Critical amongst IDPs which indicates a need to scale up and sustain ongoing interventions. This is also suggested by improvement in nutrition situation demonstrated by coordinated scaling up of interventions among the Mogadishu and , Kismayo IDPs where situation of humanitarian emergency existed in Gu 2014 • High levels of sustained acute malnutrition seen in most of the livelihoods in SC Somalia/IDPs suggest an urgent need for Nutrition Causal Analysis for humanitarian actors to identify and rank causes of undernutrition and plan more effective interventions to tackle persistent malnutrition in certain livelihoods. • Although mortality is low, the high levels of wasting , stunting, underweight and , maternal malnutrition recorded in areas where prevalence of acute malnutrition is high requires further strengthening and expanding implementation of comprehensive multi-sectoral interventions to address the nutritional situation of under 5 children • Current nutrition hotspots where malnutrition rates are Critical are the following: Bay Agro pastoral, N Gedo Pastoral, N Gedo Riverine, N Gedo Agropastoral, S Gedo Riverine, S Gedo Pastoral, and S Gedo Agropastoral, Beletweyne District, Mataban District, Dolow IDPs, Baidoa IDPs, Bossasso IDPs, Garowe IDPs and Galkayo IDPs. INTEGRATED FOOD SECURITY ANALYSIS • Rural Livelihoods • Urban Livelihoods • Internally Displaced Persons (IDPs) Rural Livelihoods (Livestock Dependent) Regional Trend in Terms of Trade: Cereal to Goat An estimated 2.7 million pastoralists and agropastoralists across Somalia mainly depend on livestock/ livestock product sales 90 Central (Red Rice) 80 NW (Red Rice) NE(Red Rice) 70 60 Kg per Head Milk availability (source of income/ food): o Average to near average in most livelihoods, which is also reflected in declined prices in most markets o Livestock prices have declined in most regions of Somalia, o/w most significantly (21%) in Central regions 100 50 40 30 20 10 Purchasing Power: Terms of Trade (ToT) goat/ cereals: o In the past 6-month ToT has shown increase in most southern regions due to declined cereal prices; it dropped in other regions, most significantly in Central (18%) due to declined livestock prices o ToT is higher/ close to 5yr average (2009-2013) in most regions, apart from Bakool, Gedo, Northern and Central Regions, which are lower Month Regional Trend in Terms of Trade: Cereal to Goat Dec-14 Jun-14 Dec-13 Jun-13 Dec-12 Jun-12 Dec-11 Jun-11 Dec-10 Jun-10 Dec-09 Jun-09 Dec-08 Jun-08 0 Dec-07 Livestock holding (main asset): o Livestock (camel/ sheep/goat) herd size of poor households in the North is mostly at/ above baseline levels; near baseline/ below baseline in most livelihoods of South-Central; Further increase in livestock (sheep/ goat) herd size is expected through June 2015. Rural Livelihoods (Mainly Crop-‐dependent) An esFmated 1.8 million riverine and agropastoral populaFons depend on crop producFon/ sales as a source of living Terms of Trade Agriculture Labour Wage to Cereal Cereal stock availability among poor households: o Average cereal stock availability (3-‐5 months) at household level in major cereal-‐producing areas (Shabelle, Bay and Gedo regions); o 1-‐2 months of stocks in other farming regions apart from Lower Juba with no stocks available up to March ’15 off-‐ season harvest and in Hiran Agropsatoral Farm Labour (income source): o Farm labour wages have increased significantly (17-‐37%) since July 2014 in most southern regions with the excep8on of Juba regions where they dropped (by 35%) due to poor seasonal performance. Labour wages are also higher compared to last year and 5yr averages in most regions, apart from Hiran and Juba o High access to farm labour opportuni8es is an8cipated with the expected average Gu rains (Apr-‐Jun) Terms of Trade (daily labour/ cereals): o ToT has improved in most crop-‐growing areas compared to 6m and 5yr average due to declined cereal prices/ increased labour wages; the highest ToT (17kg of cereals/ daily farm labour rate) recorded in Bay region. Terms of Trade Agriculture Labour Wage to Cereal Urban Livelihoods Cost of Minimum Expenditure Basket Trend Market purchase -‐ main source of food for urban households 50% 40% 30% 20% 10% 0% -‐10% -‐20% -‐30% change from Dec-‐13 change from July-‐14 change from Dec 5yr avg % of Food Expenditures 100% 80% 60% 40% 20% 0% o The MEB cost declined in most regions in the last 6 months; a significant increase in MEB cost is recorded in Bakool region compared to a year ago and 5 year average o High to very high vulnerability to food insecurity in most urban areas of Somalia – HHs spend more than 70 percent of their income on food alone in most urban areas (based on defini8on from IFPRI, 2008) Urban Livelihoods § Increased ToT casual labour wage to cereals in most regions; ToT is higher/ near than 5yr average in most regions apart from Bakool, Hiran and M. Juba regions where it is lower Terms of Trade (casual labour wage/ cereals) 25 20 15 10 Banadir Gedo Bay Lower Juba Dec-‐14 Bakool M.Shbelle L.Shabelle Hiran Galgadud Mudug Nugal July-‐14 Middle Juba Dec-‐13 Bari Sanag Sool Togdheer W.Galbeed 0 Awdal 5 Dec 5 Yrs Av. Conflict-‐Affected Districts 20,000 18,000 16,000 14,000 12,000 10,000 8,000 6,000 4,000 2,000 0 Wajid Buloburte Garbaharey Jan-‐14 July-‐14 Hudur Tiyeglow Dec-‐14 § The lowest ToTs (3kg of cereals per daily labour wage is recorded in Hudur (Bakool) due to trade disrup8ons § Cereal price have declined in most conflict-‐affected urban areas (Hudur, Wajid, Bulo-‐Burte) since July 2014, mostly due to improved harvest prospects in the surrounding regions, access to humanitarian assistance and local traders smuggling in cereals; however, prices remain significantly higher compared to the beginning of the year (50-‐70%) and the five-‐year average. • Insecurity in the South is likely to persist in the coming months affec8ng trade flow and humanitarian access in the affected regions; the risk is even higher for areas that may be affected by military opera8ons in coming months • Cereal prices are likely to remain high in conflict-‐ affected urban areas in the coming months. IDPs: Food ConsumpFon Food ConsumpFon Score Acceptable Borderline Qardho Kismayo Hargeisa Garowe Galkayo Dolow Dobley Dhusamareb Burco Bossaso Berbera Banadir Poor Baidoa 100% 90% 80% 70% 60% 50% 40% 30% 20% 10% 0% CSI Index Trend 80 70 60 50 40 30 20 10 0 BL Gu 2014 Deyr 2014/15 § Over 80% of IDPs have ‘Acceptable’ food consump8on in most sejlements apart from: o 20% of IDPs in Dolow have poor food consump8on o 23% of Poor + Borderline in Qardho § Coping Strategies Index (CSI) shows improvement (i.e. decline) in the last 6m in most IDP sejlements apart from Berbera, Dhusamareb and Galkayo § CSI is higher than baseline in: Kismayo, Dolow, Banadir, Galkayo, Berbera, Hargeisa § Analysis of food security at household level among IDPs considered a combina8on of contribu8ng factors, but mainly household food Consump8on and share of food expenditure out of total household expenditure Internally Displaced Persons (IDPS) Vulnerability § The vast majority of IDPs (><80%) are asset poor (0-4 assets) § High expenditures on food (over 75% on average) of IDP households signifies their high vulnerability to market price shocks. § Market purchase represents the major food source for all IDP HHs regardless of the sex of the income provider § Insecurity is likely to sustain in most southern regions that may cause further displacements § High likelihood of continued forced evictions of IDPs from public and private premises in Mogadishu Acute Food Insecurity SituaFon Current (Jan 2015) PopulaFon in Crisis and Emergency Number of people affected % DistribuFon 84,000 Assessed Urban popula8on in Crisis and Emergency 11% 111,000 Assessed Rural popula8on in Crisis 15% Assessed IDP popula8on in sejlements in Crisis & 556,000 74% Emergency 100% 751,000 EsFmated Total PopulaFon in Crisis and Emergency 10% of total pop EsFmated Total PopulaFon in Stress 2,286,000 30% of total pop § 751,000 people are currently experiencing a food security crisis across Somalia; IDPs account for nearly three quarters of the total population in food security crisis Projected (Feb-‐Jun 2015) PopulaFon in Crisis and Emergency Assessed Urban popula8on in Crisis and Emergency Assessed Rural popula8on in Crisis Assessed IDP popula8on in sejlements in Crisis & Emergency Number of people affected 86,000 89,000 % DistribuFon 556,000 76% EsFmated Total PopulaFon in Crisis and Emergency EsFmated Total PopulaFon in Stress 731,000 2, 292,000 9% of total pop 31% of total pop 12% 12% § 731,000 people are projected to experience food security crisis through June 2015 with IDPs representing the majority. SUMMARY RESULTS AND KEY MESSAGES Summary Results SOMALIA ESTIMATED NUTRITION SITUATION ACUTE FOOD SECURITY SITUATION OVERVIEW Global Acute Malnutrition: February-April 2015 Projections Rural, Urban and IDP Populations: February-June 2015, Projection Key Message Highlights § A largely favorable Deyr season has contributed to a reduc8on in the number of people in Crisis and Emergency (IPC Phases 3 and 4) – a nearly 29% decrease since July 2014 and the lowest since the peak of the famine period in 2011. § However, 731 000 people remain acutely food insecure (IPC Phases 3 and 4) and require urgent humanitarian assistance and livelihood support through mid 2015 § Nearly 2.3 million addi8onal people are classified as Stressed (IPC Phase 2); This group of households may struggle to meet their minimal food requirements through the end of the year, they remain highly vulnerable to shocks that could push them back to food security crisis if no appropriate support is provided. § 202 600 children under 5 years of age are acutely malnourished of which 38 200 are severely malnourished and face a higher risk of morbidity and death; § In flood affected and rainfall deficit areas, the situa8on is likely to con8nue deteriora8ng further un8l the start of off-‐season harvest in March and Gu rains in April. Regional DistribuFon of PopulaFon in Acute Food Security Stress, Crisis and Emergency Thank you! QuesFons/Comments? Extra Slides for Q & A Approach for IPC ClassificaFon for IDP & Urban PopulaFons For urban representaFve surveys % Expenditure on Food Low (less than 50) Food Consumption Moderate Severe Coping Coping Score strategies strategies Acceptable Borderline Poor Medium (50-65) Moderate Coping strategies Severe Coping strategies High (66-75) Moderate Coping strategies Severe Coping strategies Very high (>75) Moderate Coping strategies Severe Coping strategies For IDP representaFve surveys Food Consumption Score Acceptable Borderline Poor % Expenditure on Food Low (less than 50) Medium (50-65) High (66-75) Very high (>75) Internally Displaced Persons (IDPS) • Internal movements of 114,730 people between September and November; in the last six months main reasons for movements included insecurity, floods and evictions (79%) source: UNHCR, Based on FSNAU survey results: • Highest proportion of recent (past one year/ past 3 months) of IDP arrivals: Kismayo (45%/ 20%); Dobley (38% / 14%) and Banadir (32% / 10%) DuraFon of residency in IDP seolements 100.0 90.0 80.0 70.0 60.0 50.0 40.0 30.0 20.0 10.0 0.0 1-‐ 3 Months 4-‐ 12 Months 1-‐3 Years > 3 Years
© Copyright 2026