
Fact Sheet - Death Penalty Information Center
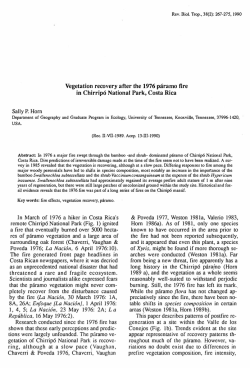
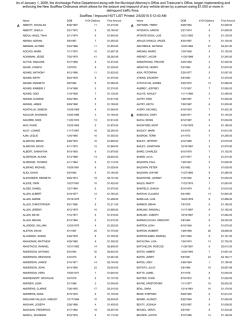
1015 18th St. NW, Suite 704
Washington, DC 20036
www.deathpenaltyinfo.org
[email protected]
@DPInfoCtr
facebook.com/DeathPenaltyInfo
DEATH PENALTY INFORMATION CENTER
Facts about the Death Penalty
Updated: February 5, 2015
98
NUMBER OF EXECUTIONS
SINCE 1976: 1,401
85
74
71
68
66
59 60
56
53
45
21
25
46
37
43 43
39
31
35
23
18 18
16
11
2
2
0 1 0
0 1
52
42
38
31
65
14
7
5
‘76 ‘77 ‘78 ‘79 ‘80 ‘81 ‘82 ‘83 ‘84 ‘85 ‘86 ‘87 ‘88 ‘89 ‘90 ‘91 ‘92 ‘93 ‘94 ‘95 ‘96 ‘97 ‘98 ‘99 ‘00 ‘01 ‘02 ‘03 ‘04 ‘05 ‘06 ‘07 ‘08 ‘09 ‘10 ‘11 ‘12 ‘13 ‘14 '15
RACE OF DEFENDANTS EXECUTED
RACE OF VICTIMS IN DEATH PENALTY CASES
Hispanic
8%
Hispanic
7%
Black
35%
Black
15%
Other
2%
White
76%
White
56%
Other
2%
• White: 779
• Black: 486
• Hispanic: 112
• Other: 24
Over 75% of the murder victims in cases
resulting in an execution were white, even
though nationally only 50% of murder victims
generally are white.
DEATH PENALTY
STATES (32)
Alabama
Arizona
Arkansas
California
Colorado
Delaware
Florida
Georgia
Idaho
Indiana
Kansas
Kentucky
Louisiana
Mississippi
Missouri
Montana
Nebraska
Nevada
New Hampshire
North Carolina
Ohio
Oklahoma
Oregon
Pennsylvania
South Carolina
South Dakota
Tennessee
Texas
Utah
Virginia
Washington
Wyoming
U.S. Gov’t
U.S. Military
NON-DEATH PENALTY
STATES (18)
Alaska
Connecticut*
Hawaii
Illinois
Iowa
Maine
Maryland*
Massachusetts
Michigan
Minnesota
New Jersey
New Mexico*
New York
North Dakota
Rhode Island
Vermont
West Virginia
Wisconsin
District of Columbia
*Inmates remain on
death row.
RECENT STUDIES ON RACE
• Jurors in Washington state are three times more likely to recommend a death sentence for a black
defendant than for a white defendant in a similar case. (Prof. K. Beckett, Univ. of Washington, 2014). Persons Executed for Interracial Murders
293
• In Louisiana, the odds of a death sentence were 97% higher for those whose victim was white than for
those whose victim was black. (Pierce & Radelet, Louisiana Law Review, 2011).
• A study in California found that those who killed whites where over 3 times more likely to be sentenced
to death than those who killed blacks and over 4 times more likely than those who killed Latinos.
(Pierce & Radelet, Santa Clara Law Review, 2005).
• A comprehensive study of the death penalty in North Carolina found that the odds of receiving a death
sentence rose by 3.5 times among those defendants whose victims where white. (Prof. Jack Boger and
Dr. Isaac Unah, University of North Carolina, 2001).
• In 96% of states where there have been reviews of race and the death penalty, there was a pattern of
either race-of-victim or race-of-defendant discrimination, or both. (Prof. Baldus report to the ABA, 1998).
31
White Def./
Black Victim
Black Def./
White Victim
INNOCENCE
25
20
Death Row Exonerations
By State Total: 150
12
FL
IL
10 10 9 9
8
• Since 1973, over 140 people have been released from death row with
evidence of their innocence. (Staff Report, House Judiciary Subcommittee
on Civil & Constitutional Rights, 1993, with updates from DPIC).
• From 1973-1999, there was an average of 3 exonerations per year. From
2000-2011, there was an average of 5 exonerations per year.
6 5 5
4 4 3 3 3 3
2 2 1 1 1 1 1 1 1
TX OK LA NC OH AZ PA AL GA MO NM CA MA MS TN IN SC ID KY MD NE NV VA WA
DEATH ROW INMATES BY RACE
DEATH ROW INMATES BY STATE: OCTOBER 1, 2014
Black
42%
White
43%
Hispanic
13%
Other
2%
California
745 Oklahoma
49 Kansas
10
Florida
404 Mississippi
49 Utah
9
Texas
276 S. Carolina
47 Washington
9
Alabama
198 Missouri
39 Virginia
8
Pennsylvania
188 Oregon
36 U.S. Military
6
N. Carolina
160 Kentucky
35 Maryland
4
Ohio
144 Arkansas
33 S. Dakota
3
Arizona
123 Delaware
18 Colorado
3
Georgia
90
Indiana
14 Montana
2
Louisiana
85
Connecticut
12 New Mexico
2
Nevada
78
Idaho
11 Wyoming
1
Tennessee
75
Nebraska
11 N. Hampshire
1
U.S. Gov’t
63
TOTAL: 3,035
Race of Death Row Inmates and Death Row Inmates by State Source: NAACP Legal Defense Fund, “Death Row USA” (October
1, 2014). When added, the total number of death row inmates by state is slightly higher than the given total because some
prisoners are sentenced to death in more than one state.
EXECUTIONS BY STATE SINCE 1976
State
Tot
TX
OK
VA
FL
MO
GA
AL
OH
NC
SC
AZ
LA
521
112
110
90
80
57
56
53
43
43
37
28
2014 2015
10
3
0
8
10
2
0
1
0
0
1
0
3
1
0
1
0
2
0
0
0
0
0
0
State
Tot
AK
MS
IN
DE
CA
IL
NV
UT
TN
MD
WA
NE
27
21
20
16
13
12
12
7
6
5
5
3
EXECUTIONS BY REGION*
2014 2015
0
0
0
0
0
0
0
0
0
0
0
0
0
0
0
0
0
0
0
0
0
0
0
0
State
Tot
PA
KY
MT
US GOVT
ID
SD
OR
NM
CO
WY
CT
3
3
3
3
3
3
2
1
1
1
1
2014 2015
0
0
0
0
0
0
0
0
0
0
0
0
0
0
0
0
0
0
0
0
0
0
South
1141
Midwest
171
West
Northeast
85
4
TX & OK
633
*Federal executions are listed in the region in
which the crime was committed.
DEATH SENTENCING
The number of death sentences per year has dropped dramatically since 1999.
Year
1997
1998
1999
2000
2001
2002
2003
2004
2005
2006
2007
2008
2009
2010
2011
2012
2013
2014
Sentences
266
295
279
223
153
166
151
138
140
123
126
120
118
114
85
82
83
72
Source: Bureau of Justice Statistics: “Capital Punishment, 2013.”
MENTAL DISABILITIES
• Intellectual Disabilities: In 2002, the Supreme Court held in Atkins v. Virginia that it is unconstitutional to execute defendants with 'mental retardation.'
• Mental Illness: The American Psychiatric Association, the American Psychological Association, the National Alliance for the Mentally Ill, and the American Bar
Association have endorsed resolutions calling for an exemption of the severely mentally ill.
DETERRENCE
Do executions lower homicide rates?
Yes
5%
No
88%
No Opinion
7%
• A report by the National Research Council, titled Deterrence and the Death Penalty, stated that
studies claiming that the death penalty has a deterrent effect on murder rates are
“fundamentally flawed” and should not be used when making policy decisions (2012).
• Consistent with previous years, the 2013 FBI Uniform Crime Report showed that the South
had the highest murder rate. The South accounts for over 80% of executions. The
Northeast, which has less than 1% of all
Murder Rates per 100,000 (2013)
executions, had lowest murder rate.
Nat’l
EXECUTIONS SINCE 1976 BY METHOD USED
1226 Lethal Injection
158 Electrocution
11 Gas Chamber
3 Hanging
3 Firing Squad
35 states plus the US government use
lethal injection as their primary method.
Some states utilizing lethal injection have
other methods available as backups.
Though New Mexico, Connecticut, and
Maryland have abolished the death
penalty, their laws were not retroactive,
leaving prisoners on the states’ death rows
and their lethal injection protocols intact.
5.3
South
• According to a survey of the former and present
Midwest
presidents of the country’s top academic
West
criminological societies, 88% of these experts
rejected the notion that the death penalty acts as a Northeast
deterrent to murder. (Radelet & Lacock, 2009)
4.5
4
3.5
4.5
JUVENILES
• In 2005, the Supreme Court in Roper v. Simmons struck down the death
penalty for juveniles. 22 defendants had been executed for crimes
committed as juveniles since 1976.
WOMEN
• There were 57 women on death row as of Oct. 1, 2014. This constitutes less
than 2% of the total death row population. (NAACP Legal Defense Fund,
Oct. 1, 2014). 15 women have been executed since 1976.
FINANCIAL FACTS ABOUT THE DEATH PENALTY
• Defense costs for death penalty trials in Kansas averaged about $400,000 per case, compared to $100,000 per case when the death penalty
was not sought. (Kansas Judicial Council, 2014).
• A new study in California revealed that the cost of the death penalty in the state has been over $4 billion since 1978. Study considered pretrial and trial costs, costs of automatic appeals and state habeas corpus petitions, costs of federal habeas corpus appeals, and costs of
incarceration on death row. (Alarcon & Mitchell, 2011).
• In Maryland, an average death penalty case resulting in a death sentence costs approximately $3 million. The eventual costs to Maryland
taxpayers for cases pursued 1978-1999 will be $186 million. Five executions have resulted. (Urban Institute, 2008).
• Enforcing the death penalty costs Florida $51 million a year above what it would cost to punish all first-degree murderers with life in prison
without parole. Based on the 44 executions Florida had carried out since 1976, that amounts to a cost of $24 million for each execution.
(Palm Beach Post, January 4, 2000).
• The most comprehensive study in the country found that the death penalty costs North Carolina $2.16 million per execution over the costs
of sentencing murderers to life imprisonment. The majority of those costs occur at the trial level. (Duke University, May 1993).
• In Texas, a death penalty case costs an average of $2.3 million, about three times the cost of imprisoning someone in a single cell at the
highest security level for 40 years. (Dallas Morning News, March 8, 1992).
PUBLIC OPINON AND THE DEATH PENALTY
Support for Alternatives to the Death Penalty
• A 2010 poll by Lake Research Partners found that a clear
majority of voters (61%) would choose a punishment other
than the death penalty for murder.
What Interferes with Effective Law Enforcement?
Percent Ranking Item as One of Top Two or Three
Lack of law enforcement resource
20
Drug/Alcohol abuse
20
Family problems/child abuse
Death penalty
33%
Life without parole
13%
No opinion
6%
Life with parole
9%
Life without parole plus restitution
39%
14
Lack of programs for mentally ill
12
Crowded courts
7
Ineffective prosecution
6
Too many guns
5
Gangs
Insufficient use of the death penalty
3
2
• A 2009 poll commissioned by DPIC found police chiefs ranked the death
penalty last among ways to reduce violent crime. The police chiefs also
considered the death penalty the least efficient use of taxpayers’ money.
The Death Penalty Information Center has available more extensive reports on a variety of issues, including:
• "The Death Penalty in 2014: Year-End Report" (December 2014)
• “The 2% Death Penalty: How a Minority of Counties Produce Most Death Cases at Enormous Costs to All” (October 2013)
• "The Death Penalty in 2013: Year-End Report" (December 2013)
• "Struck By Lightning: The Continuing Arbitrariness of the Death Penalty 35 Years After Its Reinstatement in 1976" (June 2011)
• “Smart on Crime: Reconsidering the Death Penalty in a Time of Economic Crisis” (October 2009)
• “A Crisis of Confidence: Americans' Doubts About the Death Penalty” (2007)
• “Blind Justice: Juries Deciding Life and Death with Only Half the Truth” (2005)
• “Innocence and the Crisis in the American Death Penalty” (2004)
• “International Perspectives on the Death Penalty: A Costly Isolation for the U.S.” (1999)
• “The Death Penalty in Black & White: Who Lives, Who Dies, Who Decides” (1998)
• “Innocence and the Death Penalty: The Increasing Danger of Executing the Innocent” (1997)


© Copyright 2026