
Índice general - Instituto Nacional de Estadística
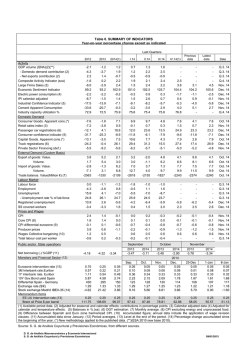
15 January 2015 Consumer Price Index (CPI). Base 2011 December 2014 Overall index Monthly change December –0.6 Change over last November –1.0 Annual change –1.0 Main results The annual change of the CPI for the month of December stands at –1.0%, six tenths below that registered in the previous month. The annual change of core inflation rises one tenth up to 0.0%. The monthly change of the overall index is –0.6%. The Harmonised Index of Consumer Prices (HICP) annual change stands at –1.1%, showing a decrease of six tenths as compared to November. Annual evolution of consumer prices The annual rate for the overall Consumer Price Index (CPI) in December was –1.0%, six tenths below that registered the previous month. The groups that most contributed to this decrease were: Transport, with a variation of –5.5%, nearly four points below that recorded in the previous month. This reduction was due to the decrease in the prices of fuels and lubricants, which was greater than that recorded in December 2013. Food and non-alcoholic beverages, whose rate decreased five tenths, reaching –0.3%. Worth noting in this behaviour was the stability in the prices of fresh vegetables, as compared to the increase registered last year. Housing, with a variation of –0.2%, two tenths below that registered in November. This behaviour was a consequence of the decrease in the prices of heating fuels this month. CPI – DECEMBER 2014 (1/13) Despite the decrease in the annual change of the overall CPI, worth noting was the increase of: Recreation and culture, with a variation of –1.2%, three tenths over that recorded in the previous month. This was due to the fact that the increase in the prices of package holidays was bigger than in 2013. Contribution of the groups to the annual change of the CPI 1. Food and non-alcoholic beverage s -0.094 2. Alcoholic beverages and tobacco -0.001 3. Clothing and footwear -0.002 4. Housing -0.032 5. Furniture and household equipment 0.001 6. Health 0.002 7. Transport -0.590 8. Communications 0.004 9. Recreation and culture 0.021 10. Education -0.001 11. Hotels , cafes and restaurants 0.011 12. Miscellaneous goods and services 0.007 DIFFERENCE IN THE ANNUAL CHANGE OF THE OVERALL CPI –0.6 The annual change for core inflation (overall index excluding unprocessed food and energy products) rose one tenth standing at 0.0%, one point over the rate of the overall CPI. CPI – DECEMBER 2014 (2/13) Annual evolution of the CPI General and core index 3.5 2.7 2.8 2.4 1.9 2.0 2.1 1.8 1.6 0.8 General -0.1 0.0 0.0 0.0 0.0 -0.1 -0.3 -0.5-0.2 -0.1 -0.1 -0.4 -1.0 December 0.0 Novemer 0.0 0.1 October 0.2 0.3 0.2 September 0.2 0.4 0.0 August September August July June May April March February 2013 Enero -1.5 October -0.1 -0.5 November 0.3 0.3 0.2 0.1 July 0.2 0.4 0.5 June 1.5 May 1.7 April 1.4 2.0 1.7 March 1.5 February 2.3 2014 January 2.2 2.3 December 2.5 Core Monthly evolution of consumer prices In December, the monthly change of the overall CPI was –0.6%. Among the groups with a negative contribution to the overall index, worth noting: Transport, whose rate of –3.4%, with a contribution of –0.517, showed the decrease in the prices of fuels and lubricants this month. Clothing and footwear, whose rate of –2.0% showed the behaviour of prices at the beginning of the winter season. Its contribution to the overall CPI was –0.159. Housing, with a variation rate of –0.2%, mainly due to the decrease in the prices of electricity. Its contribution to the general index was –0.023. In turn, the groups with the greatest positive contribution to the overall index were: Recreation and culture, with a variation of 1.7% and a contribution of 0.117, reflected the increase in the prices of package holidays. CPI – DECEMBER 2014 (3/13) Monthly evolution of the CPI General Index 1.5 0.9 1.0 0.4 0.5 0.4 0.2 0.2 0.4 0.3 0.1 0.5 0.2 0.2 0.1 0.2 0.2 0.0 0.0 0.0 0.0 -0.1 -0.2 -0.5 -0.6 -0.5 -1.0 December November October September August July June May April March February 2013 January December November October September August July June May April March February 2013 January -1.5 -0.9 -1.3 -1.3 A more detailed analysis showed the divisions that had the greatest contribution to the monthly change of the CPI during the month of December. Divisions with the greatest positive contribution to the monthly change of the CPI Monthly rate (%) Contribution Food Fresh fish Fresh vegetables 2.4 0.9 0.024 0.008 9.0 0.5 0.3 1.6 0.121 0.017 0.013 0.011 Other divisions Package holidays Electricity Motor cars Press Divisions with the greatest negative contribution to the monthly change of the CPI Monthly rate (%) Contribution Food Fresh fruit –4.0 –0.062 –8.2 –2.4 –8.6 –0.9 –0.536 –0.139 –0.041 –0.014 Other divisions Fuels and lubricants Clothing Other fuels Footwear CPI – DECEMBER 2014 (4/13) Results by Autonomous Community. Annual changes The annual rate of the CPI decreased in all Autonomous Communities. The greatest decreases were registered in Castilla-La Mancha (–1.5%) and Comunidad Foral de Navarra (–1.2%), with a nine-tenth decrease. In turn, the lowest decreases were registered in Canarias and Principado de Asturias, both standing at –1.1%, four and five tenths below the figures registered in November, respectively. Annual rates of the CPI Autonomous Communities and Cities -0.5 Ceuta -0.3 -0.6 Melilla Cataluña -0.7 País Vasco -0.7 -0.3 -0.1 -0.1 -0.8 Balears, IIles -0.1 -0.9 La Rioja Galicia -1.0 NATIONAL -1.0 Asturias, Principado de -1.1 Canarias -1.1 Madrid, Comunidad de -1.1 Andalucía -1.2 Aragón -1.2 Castilla y León -1.2 Comunitat Valenciana -1.2 Extremadura -1.2 Navarra, Comunidad Foral de -1.2 Cantabria -1.3 Murcia, Región de -1.3 Castilla-La Mancha -1.5 -0.3 -0.3 -0.4 -0.6 -0.7 -0.4 -0.5 -0.5 -0.4 -0.5 -0.5 -0.3 -0.6 -0.5 -0.6 December 2014 November 2014 CPI – NOVEMBER 2014 (5/13) Harmonised Index of Consumer Prices (HICP) In December, the annual variation rate of the HICP stood at –1.1%, six tenths below that registered in the previous month. The monthly change of the HICP was –0.7%. Annual evolution of thE HICP, base 2005 Overall Index for Spain and Monetary Union1 3.5 2.8 2.9 2.6 2.5 2.2 1.9 1.8 1.5 1.5 1.6 2.0 1.8 1.7 1.1 1.6 1.6 1.4 1.3 1.2 0.7 0.9 0.8 0.8 0.7 0.7 0.5 0.5 0.3 0.3 0.5 0.5 0.3 0.4 0.4 0.3 0.4 0.3 0.2 0.1 0.3 0.0 0.5 0.0 -0.5 -0.3 -0.2 -0.4 -0.5 -0.5 -0.2 -0.2 -1.1 Spain 1 December November October September August July June May April March February 2014 January December November October September August July June May April March February 2013 January -1.5 Monetary Union The last data regarding the Monetary Union refers to the flash estimate. Index of Consumer Prices at Constant Taxes In December, the annual rate of CPI at Constant Taxes (CPI-CT) stood at –1.0%, the same as that of the overall CPI. The monthly change of the CPI-CT was –0.6%. In turn, the annual rate of HICP-CT registered an annual change of –1.1%, the same as that of the HICP. The monthly change of the HICP-CT was –0.7%. CPI – NOVEMBER 2014 (6/13) 15 January 2015 Consumer Price Index. Base 2011 December 2014 1. National indices: overall and groups Group Index % change Contribution Over previouOver last month December GENERAL INDEX Food and non-alcoholic beverages 2. Alcoholic beverages and tobacco 3. Clothing and footwear 4. Housing 5. Furniture and household equipment 6. Health 7. Transport 8. Communications 9. Recreation and culture 10. Education 11. Hotels, cafes and restaurants 12. Miscellaneous goods and services 103.5 105.1 114.1 109.4 106.7 101.4 110.6 99.1 85.0 99.7 116.3 101.6 105.7 -0.6 -0.1 -0.2 -2.0 -0.2 0.0 -0.1 -3.4 0.0 1.7 0.0 0.1 0.1 -1.0 -0.3 0.4 0.2 -0.2 -0.6 -0.2 -5.5 -5.7 -1.2 1.2 0.6 1.3 Over one Over previouOver last year month December -1.0 -0.3 0.4 0.2 -0.2 -0.6 -0.2 -5.5 -5.7 -1.2 1.2 0.6 1.3 -0.010 -0.005 -0.159 -0.023 0.003 -0.004 -0.517 0.000 0.117 0.000 0.010 0.005 -0.063 0.011 0.017 -0.027 -0.040 -0.007 -0.849 -0.212 -0.086 0.019 0.073 0.122 2. National special aggregates indices Special aggregates Index % change Over previouOver last Over one month December year Processed food including beverages and tobacco Unprocessed food Food, beverages and tobacco Unprocessed food and energy Industrial goods Durable industrial goods Energy Fuels and gas Industrial goods excluding electricity Industrial goods excluding energy Services Services excluding rentals for housing Overall index excluding food, beverages and tobacco Overall index excluding rentals for housing Overall index excluding energy CORE INFLATION (Overall index excluding unprocessed food and energy) Overall index excluding tobacco Overall index excluding tobacco Overall index excluding fuels 106.8 105.0 106.2 101.8 102.4 96.7 100.0 96.4 101.8 103.5 103.0 103.2 102.7 103.6 103.9 0.0 -0.3 -0.1 -3.1 -1.8 0.1 -4.8 -6.8 -2.1 -0.5 0.3 0.4 -0.7 -0.6 0.0 -0.2 -0.4 -0.2 -5.6 -2.8 -0.8 -8.5 -11.8 -3.2 -0.2 0.3 0.3 -1.3 -1.1 0.0 -0.2 -0.4 -0.2 -5.6 -2.8 -0.8 -8.5 -11.8 -3.2 -0.2 0.3 0.3 -1.3 -1.1 0.0 103.9 103.2 103.8 104.3 0.0 -0.6 -1.2 0.0 0.0 -1.1 -1.9 0.0 0.0 -1.1 -1.9 0.0 CPI -DECEMBER 2014 (7/13) 3. National headings indices Index 01. Cereals and by-products 02. Bread 03. Bovine meat 04. Sheep meat 05. Swine meat 06. Poultry meat 07. Other meats 08. Fresh and frozen fish 09. Seafood and processed fish 10. Eggs 11. Milk 12. Milk-based products 13. Oils and fats 14. Fresh fruit 15. Canned and dried fruit 16. Fresh vegetables 17. Processed vegetables 18. Fresh potatoes and potatoes preparations 19. Coffee, cocoa and infusions 20. Sugar 21. Other food products 22. Mineral waters, soft drinks and juices 23. Alcoholic beverages 24. Tobacco 25. Garments for men 26. Garments for women 27. Garments for children and babyclothes 28. Clothing accesories and repair 29. Footwear for men 30. Footwear for women 31. Footwear for children and infants 32. Repair of footwear 33. Rentals for housing 34. Heating, electricity and water supply 35. Maintenance and repair of the dwelling 36. Furniture and floor coverings 37. Household textiles and decorations 38. Household appliances including repair 39. Household utensils and tools 40. Non-durable household goods 41. Household services 42. Medical, dental and paramedical services 43. Medical products, appliances and equipment 44. Personal transport 45. Local transport 46. Long-distance transport 47. Communications 48. Recreational items 49. Printed matter 50. Recreational services 51. Pre-primary and primary education 52. Secondary education 53. Tertiary education 54. Other educational goods and services 55. Personal effects 56. Tourism, catering and accommodation services 57. Other goods and services 104.1 101.4 103.9 104.5 101.3 99.6 106.2 108.2 108.8 112.2 107.4 101.7 115.1 108.8 113.6 102.6 108.4 94.8 103.5 85.0 103.1 103.9 104.0 118.1 112.9 109.8 104.4 111.7 106.4 109.3 103.4 106.9 99.4 111.1 104.8 102.2 98.9 94.9 103.0 102.9 106.0 106.0 119.6 98.1 116.0 111.5 85.0 85.3 103.8 105.7 107.2 107.5 132.2 104.0 102.4 103.0 109.7 Over previous month Over last December Over one y % change % change % change 0.3 0.0 0.3 2.1 -0.4 0.5 0.0 2.0 0.2 0.1 -0.1 -0.1 1.2 -4.0 0.0 0.9 -0.2 0.2 0.0 -1.2 -0.2 0.1 -0.6 0.0 -2.5 -2.8 -1.0 -2.3 -0.9 -0.8 -1.0 0.1 0.0 -0.4 0.0 0.4 0.4 -0.3 -0.1 -0.2 0.1 0.0 -0.2 -3.4 0.0 1.0 0.0 -0.4 1.1 -0.3 0.0 0.0 0.0 0.1 0.0 1.0 0.2 Contribution 0.004 0.000 0.002 0.005 -0.002 0.004 0.001 0.025 0.002 0.000 -0.001 -0.002 0.007 -0.062 0.000 0.008 -0.001 0.001 0.000 -0.001 -0.002 0.001 -0.005 0.000 -0.052 -0.078 -0.009 -0.005 -0.005 -0.006 -0.003 0.000 -0.001 -0.024 0.001 0.005 0.002 -0.002 0.000 -0.003 0.001 0.000 -0.004 -0.524 0.000 0.008 0.000 -0.010 0.012 -0.006 0.000 0.000 0.000 0.000 0.000 0.131 0.004 -0.8 0.1 -0.5 3.9 -2.7 -2.1 0.5 5.6 1.3 -3.1 -0.3 -0.2 -4.4 3.0 3.6 -6.5 0.2 -12.9 -1.4 -17.5 -0.7 0.1 -1.2 1.0 0.5 0.0 0.1 1.1 0.0 0.6 0.1 1.0 -0.7 -0.5 0.8 -0.3 -1.9 -3.2 -0.2 -0.2 1.7 2.2 -0.7 -5.4 1.2 1.4 -5.7 -5.1 0.5 -1.8 1.4 1.4 1.4 0.3 -0.1 1.0 0.8 Contribution -0.012 0.001 -0.004 0.010 -0.016 -0.018 0.010 0.066 0.017 -0.007 -0.003 -0.003 -0.026 0.043 0.010 -0.060 0.001 -0.043 -0.005 -0.020 -0.006 0.001 -0.010 0.021 0.010 -0.001 0.001 0.002 0.000 0.005 0.000 0.000 -0.019 -0.034 0.026 -0.005 -0.012 -0.030 -0.001 -0.003 0.034 0.060 -0.011 -0.842 0.009 0.011 -0.212 -0.123 0.005 -0.032 0.007 0.005 0.009 0.002 -0.005 0.132 0.020 CPI - DECEMBER 2014 (8/13) -0.8 0.1 -0.5 3.9 -2.7 -2.1 0.5 5.6 1.3 -3.1 -0.3 -0.2 -4.4 3.0 3.6 -6.5 0.2 -12.9 -1.4 -17.5 -0.7 0.1 -1.2 1.0 0.5 0.0 0.1 1.1 0.0 0.6 0.1 1.0 -0.7 -0.5 0.8 -0.3 -1.9 -3.2 -0.2 -0.2 1.7 2.2 -0.7 -5.4 1.2 1.4 -5.7 -5.1 0.5 -1.8 1.4 1.4 1.4 0.3 -0.1 1.0 0.8 (Continues) 4. Indices of Autonomous City and Community: overall and groups Groups Index % change Over Index Over last previous month December % change Over Over one previous year month Andalucía Index Over last December % change Over Over one previous year month Aragón Over last Over one December year Asturias, Principado de OVERALL INDEX 102.9 -0.7 -1.2 -1.2 103.0 -0.7 -1.2 -1.2 103.3 -0.7 -1.1 -1.1 1. Food and non-alcoholic beverages 104.4 -0.1 -0.8 -0.8 105.5 -0.3 -0.8 -0.8 104.9 0.0 -0.3 -0.3 2. Alcoholic beverages and tobacco 114.1 -0.1 0.5 0.5 113.9 -0.1 0.3 0.3 114.0 -0.1 0.3 0.3 3. Clothing and footwear 109.1 -2.2 0.2 0.2 108.4 -3.5 0.3 0.3 110.8 -3.6 0.4 0.4 4. Housing 107.9 0.1 0.5 0.5 105.1 -0.5 -0.9 -0.9 107.2 -0.4 -0.7 -0.7 5. Furniture and household equipment 100.3 0.0 -1.0 -1.0 101.6 -0.1 -0.5 -0.5 100.9 0.2 -0.7 -0.7 6. Health 112.1 -0.2 -0.2 -0.2 108.4 0.0 0.0 0.0 108.1 -0.1 -0.9 -0.9 7. Transport 98.4 -3.4 -5.7 -5.7 98.5 -3.5 -5.3 -5.3 99.5 -3.3 -5.3 -5.3 8. Communications 84.9 0.0 -5.7 -5.7 84.9 0.0 -5.6 -5.6 84.9 0.0 -5.7 -5.7 -1.6 9. Recreation and culture 96.7 1.2 -1.8 -1.8 98.2 1.6 -1.0 -1.0 99.7 1.6 -1.6 10. Education 114.9 -0.1 0.9 0.9 110.1 0.0 1.5 1.5 108.8 0.0 1.6 1.6 11. Hotels, cafes and restaurants 100.3 0.1 0.4 0.4 101.8 0.5 0.0 0.0 101.3 0.3 0.3 0.3 12. Miscellaneous goods and services 105.5 0.0 1.3 1.3 106.6 0.2 0.9 0.9 105.0 0.2 1.3 1.3 Balears, Illes Canarias Cantabria OVERALL INDEX 104.0 -0.5 -0.8 -0.8 102.0 -0.3 -1.1 -1.1 104.4 -0.7 -1.3 -1.3 1. Food and non-alcoholic beverages 105.4 -0.2 0.3 0.3 100.1 0.1 -2.0 -2.0 105.4 0.2 -0.7 -0.7 2. Alcoholic beverages and tobacco 113.9 -0.2 0.2 0.2 115.8 -0.4 5.3 5.3 114.6 -0.2 0.7 0.7 3. Clothing and footwear 109.2 -1.4 0.1 0.1 105.1 -1.6 -1.0 -1.0 110.4 -2.6 0.4 0.4 4. Housing 106.0 0.0 -0.1 -0.1 103.5 0.1 0.1 0.1 110.2 -0.1 0.3 0.3 5. Furniture and household equipment 101.2 0.4 0.4 0.4 97.3 -0.1 -2.2 -2.2 101.5 0.0 1.2 1.2 6. Health 107.8 0.0 -1.9 -1.9 110.8 -0.5 0.2 0.2 112.7 0.0 -0.9 -0.9 7. Transport 102.0 -3.1 -5.3 -5.3 104.2 -1.9 -2.5 -2.5 99.3 -3.9 -6.9 -6.9 84.9 0.0 -5.6 -5.6 86.9 0.0 -5.7 -5.7 85.0 0.0 -5.6 -5.6 9. Recreation and culture 102.8 1.6 0.2 0.2 97.6 1.3 -1.0 -1.0 100.5 2.0 -1.1 -1.1 10. Education 111.4 0.0 1.4 1.4 115.3 0.0 -0.1 -0.1 111.5 0.0 0.7 0.7 8. Communications 11. Hotels, cafes and restaurants 102.3 0.0 0.7 0.7 102.0 0.0 1.0 1.0 101.3 0.0 -0.3 -0.3 12. Miscellaneous goods and services 106.4 0.0 1.8 1.8 102.0 0.0 0.2 0.2 106.9 0.1 1.4 1.4 CPI - DECEMBER 2014 (9/13) (Continuation) 4. Indices of Autonomous City and Community: overall and groups Groups Index % change Over Index Over last previous month December % change Over Over one previous year month Castilla y León Index Over last December % change Over Over one previous year month Castilla-La Mancha Over last Over one December year Cataluña OVERALL INDEX 104.0 -0.6 -1.2 -1.2 102.9 -0.8 -1.5 -1.5 104.6 -0.4 -0.7 -0.7 1. Food and non-alcoholic beverages 105.8 0.0 -0.4 -0.4 103.8 0.1 -1.0 -1.0 105.9 0.1 0.2 0.2 2. Alcoholic beverages and tobacco 114.5 -0.2 0.3 0.3 114.2 -0.2 0.3 0.3 113.8 -0.2 0.0 0.0 3. Clothing and footwear 109.8 -2.6 0.2 0.2 109.5 -2.0 0.2 0.2 111.0 -0.9 0.3 0.3 4. Housing 106.4 -0.7 -1.5 -1.5 106.6 -1.1 -1.9 -1.9 107.8 -0.2 0.4 0.4 5. Furniture and household equipment 102.3 0.0 -0.5 -0.5 100.6 0.1 -1.0 -1.0 103.5 0.3 -0.1 -0.1 6. Health 109.7 0.1 -0.3 -0.3 111.9 -0.2 -0.4 -0.4 113.4 0.1 -0.1 -0.1 7. Transport 100.0 -3.4 -5.6 -5.6 98.0 -3.8 -5.8 -5.8 98.5 -3.6 -5.8 -5.8 85.0 0.0 -5.6 -5.6 84.9 0.0 -5.6 -5.6 84.9 0.0 -5.7 -5.7 -0.7 8. Communications 9. Recreation and culture 99.8 1.6 -1.0 -1.0 97.5 1.6 -1.6 -1.6 101.4 1.9 -0.7 10. Education 118.2 0.0 1.4 1.4 117.7 0.0 1.1 1.1 120.0 0.0 1.4 1.4 11. Hotels, cafes and restaurants 102.7 0.4 0.8 0.8 101.4 0.2 0.9 0.9 102.5 0.1 0.9 0.9 12. Miscellaneous goods and services 105.7 0.1 1.1 1.1 104.5 0.0 1.0 1.0 107.4 0.1 1.9 1.9 -1.0 Comunitat Valenciana Extremadura Galicia OVERALL INDEX 103.1 -0.7 -1.2 -1.2 102.9 -0.6 -1.2 -1.2 103.8 -0.7 -1.0 1. Food and non-alcoholic beverages 105.4 -0.1 -0.3 -0.3 104.1 -0.2 -1.1 -1.1 105.4 0.0 0.1 0.1 2. Alcoholic beverages and tobacco 114.5 -0.2 0.3 0.3 114.3 -0.2 0.4 0.4 112.7 -0.1 -0.4 -0.4 3. Clothing and footwear 108.0 -2.3 0.1 0.1 108.4 -1.9 0.0 0.0 110.8 -1.9 0.4 0.4 4. Housing 107.7 0.0 0.1 0.1 109.9 0.0 0.2 0.2 107.5 -0.4 -0.9 -0.9 5. Furniture and household equipment 100.7 0.0 -1.1 -1.1 100.5 0.2 -0.9 -0.9 101.8 -0.2 -1.3 -1.3 6. Health 110.4 0.0 0.1 0.1 109.4 0.0 0.3 0.3 110.6 -0.1 -0.2 -0.2 98.1 -3.5 -6.5 -6.5 98.1 -3.5 -5.7 -5.7 99.5 -3.5 -4.2 -4.2 7. Transport 8. Communications 9. Recreation and culture 84.8 0.0 -5.7 -5.7 84.9 0.0 -5.7 -5.7 84.8 0.0 -5.7 -5.7 100.6 1.3 -0.8 -0.8 94.6 1.4 -2.0 -2.0 99.0 1.0 -1.8 -1.8 10. Education 113.5 0.0 1.1 1.1 111.9 0.0 1.3 1.3 109.1 0.0 1.0 1.0 11. Hotels, cafes and restaurants 101.1 -0.2 0.8 0.8 100.8 0.2 0.9 0.9 102.4 0.0 0.5 0.5 12. Miscellaneous goods and services 104.6 0.1 0.9 0.9 105.2 0.1 1.9 1.9 104.7 0.1 0.7 0.7 CPI - DECEMBER 2014 (10/13) (Completion) 4. Indices of Autonomous City and Community: overall and groups Groups Index % change Over previous month Index Over last December Over one year Madrid, Comunidad de % change Over previous month Index Over last December Over one year Murcia, Región de % change Over previous month Over last December Over one year Navarra, C. Foral de OVERALL INDEX 103.1 -0.5 -1.1 -1.1 103.4 -0.7 -1.3 -1.3 103.2 -0.7 -1.2 -1.2 1. Food and non-alcoholic beverages 105.8 -0.2 0.0 0.0 104.9 -0.1 -0.2 -0.2 104.7 -0.2 0.4 0.4 2. Alcoholic beverages and tobacco 114.3 -0.2 0.2 0.2 114.2 -0.2 0.3 0.3 113.9 -0.2 0.2 0.2 3. Clothing and footwear 108.7 -1.5 0.3 0.3 109.9 -3.2 0.3 0.3 110.1 -2.3 0.3 0.3 4. Housing 103.9 -0.1 -0.8 -0.8 106.0 0.0 -0.3 -0.3 104.0 -0.8 -1.9 -1.9 5. Furniture and household equipment 100.8 0.1 -0.2 -0.2 102.3 -0.1 -1.4 -1.4 102.8 -0.3 -0.8 -0.8 6. Health 106.4 -0.5 -0.4 -0.4 110.6 0.1 -0.5 -0.5 110.4 0.3 0.7 0.7 99.4 -3.5 -5.8 -5.8 97.8 -3.9 -6.5 -6.5 98.3 -3.4 -5.7 -5.7 7. Transport 8. Communications 84.9 0.0 -5.6 -5.6 85.0 0.0 -5.6 -5.6 84.9 0.0 -5.7 -5.7 9. Recreation and culture 100.2 2.0 -1.6 -1.6 99.7 2.8 -1.3 -1.3 100.8 2.1 -1.5 -1.5 10. Education 119.7 -0.1 1.0 1.0 111.9 0.1 0.3 0.3 117.7 0.4 1.8 1.8 11. Hotels, cafes and restaurants 101.5 0.1 0.8 0.8 102.6 0.0 0.8 0.8 101.4 0.0 0.6 0.6 12. Miscellaneous goods and services 105.9 -0.1 1.6 1.6 105.2 0.0 0.4 0.4 105.4 0.0 0.5 0.5 País Vasco Rioja, La Ceuta OVERALL INDEX 104.1 -0.7 -0.7 -0.7 103.9 -0.5 -0.9 -0.9 103.0 0.0 -0.5 -0.5 1. Food and non-alcoholic beverages 105.5 -0.2 -0.1 -0.1 105.4 -0.1 -0.3 -0.3 102.7 -0.2 -0.7 -0.7 2. Alcoholic beverages and tobacco 113.1 -0.2 -0.2 -0.2 113.4 -0.3 -0.4 -0.4 110.1 0.0 0.3 0.3 3. Clothing and footwear 110.2 -3.4 0.4 0.4 113.6 -1.7 0.2 0.2 107.3 -0.8 0.0 0.0 4. Housing 108.4 -0.1 0.6 0.6 107.3 -0.4 -0.3 -0.3 106.7 0.1 1.2 1.2 5. Furniture and household equipment 103.0 -0.1 -0.1 -0.1 104.1 0.2 -0.1 -0.1 99.2 0.8 -1.0 -1.0 6. Health 110.8 0.0 -0.2 -0.2 108.5 0.2 0.5 0.5 114.0 0.0 0.2 0.2 99.3 -3.4 -5.0 -5.0 98.7 -3.5 -5.3 -5.3 101.5 -0.9 -2.3 -2.3 7. Transport 8. Communications 9. Recreation and culture 85.0 0.0 -5.6 -5.6 84.9 0.0 -5.7 -5.7 84.4 0.0 -5.5 -5.5 101.3 1.8 -0.9 -0.9 102.1 2.2 1.1 1.1 100.8 1.7 -0.6 -0.6 10. Education 110.9 0.1 2.9 2.9 113.3 0.0 0.9 0.9 115.7 0.0 1.5 1.5 11. Hotels, cafes and restaurants 102.1 -0.2 0.4 0.4 101.3 -0.2 0.2 0.2 103.7 0.2 0.2 0.2 12. Miscellaneous goods and services 106.1 0.2 1.4 1.4 104.8 0.0 0.8 0.8 102.6 0.3 0.8 0.8 Melilla OVERALL INDEX 102.0 -0.1 -0.6 -0.6 1. Food and non-alcoholic beverages 100.5 -0.2 -1.0 -1.0 2. Alcoholic beverages and tobacco 109.7 -0.1 0.8 0.8 3. Clothing and footwear 109.2 -1.0 0.0 0.0 4. Housing 105.4 0.2 1.1 1.1 5. Furniture and household equipment 100.8 -0.4 -1.3 -1.3 6. Health 108.5 -0.2 -1.3 -1.3 7. Transport 101.1 -0.7 -1.4 -1.4 82.9 0.0 -5.7 -5.7 8. Communications 9. Recreation and culture 10. Education 11. Hotels, cafes and restaurants 12. Miscellaneous goods and services 99.0 1.9 -1.2 -1.2 116.7 -0.3 -0.2 -0.2 99.0 0.2 0.1 0.1 103.1 -0.1 0.8 0.8 CPI - DECEMBER 2014 (11/13) Consumer Price Index at Constant Taxes Base 2011 December 2014 1. National indices at Constant Taxes: overall and groups Group OVERALL INDEX AT CONSTANT TAXES 1. Food and non-alcoholic beverages 2. Alcoholic beverages and tobacco 3. Clothing and footwear 4. Housing 5. Furniture and household equipment 6. Health 7. Transport 8. Communications 9. Recreation and culture 10. Education 11. Restaurants, cafes and hotels 12. Miscellaneous goods and services Index % change Over previous month 101.4 103.8 110.7 106.8 104.8 99.5 109.8 96.8 83.0 96.0 116.3 99.8 103.1 -0.6 -0.1 -0.2 -2.0 -0.2 0.0 -0.1 -3.4 0.0 1.7 0.0 0.1 0.1 Over one year -1.0 -0.3 0.4 0.2 -0.2 -0.6 -0.2 -5.5 -5.7 -1.2 1.2 0.6 1.3 2. National indices at Constant Taxes: overall and special aggregates Special aggregates OVERALL INDEX AT CONSTANT TAXES Processed fod including beverages and tobacco Unprocessed food Food, beverages and tobacco Unprocessed food and energy Industrial goods Durable industrial goods Engergy Fuels and gas Industrial goods excluding electricity Industrial goods excluding energy Services Services excluding rentals for housing Overall index excluding food, beverages and tobacco Overall index excluding rentals for housing Overall index excluding energy CORE INFLATION (Overall index excluding unprocessed food and energy) Overall index excluding tobacco Overall index excluding services Overall index excluding fuels OVERALL INDEX AT CONSTANT TAXES AND SUBSIDES Index % change Over previous month Over one year 101.4 105.1 103.9 104.7 99.7 100.1 94.5 97.4 93.7 99.4 101.3 100.9 101.0 100.5 101.5 102.0 -0.6 0.0 -0.3 -0.1 -3.1 -1.8 0.1 -4.8 -6.8 -2.1 -0.5 0.3 0.4 -0.7 -0.6 0.0 -1.0 -0.2 -0.4 -0.2 -5.6 -2.8 -0.8 -8.5 -11.8 -3.2 -0.2 0.3 0.3 -1.3 -1.1 0.0 101.8 101.1 101.7 102.3 101.0 0.0 -0.6 -1.2 0.0 -0.6 0.0 -1.1 -1.9 0.0 -1.0 CPI − DECEMBER 2014 (12/13) 15 January 2015 Harmonized Index of Consumer Prices, 2005=100 December 2014 1. National indices: Overall and groups Group OVERALL INDEX 1. Food and non-alcoholic beverages 2. Alcoholic beverages and tobacco 3. Clothing and footwear 4. Housing 5. Furniture and household equipment 6. Health 7. Transport 8. Communications 9. Recreation and culture 10. Education 11. Restaurants, cafes and hotels 12. Miscellaneous goods and services Index % change Over previous month 120.27 120.04 172.02 112.64 141.21 112.96 107.24 123.57 82.10 97.42 142.72 122.10 124.72 Over one year -0.7 0.0 -0.2 -2.8 -0.1 0.0 -0.1 -3.7 0.0 1.6 0.0 0.0 0.1 -1.1 -0.3 0.4 0.5 -0.2 -0.6 -0.2 -6.1 -5.7 -1.2 1.2 0.6 0.5 2. National index and at constant taxes General HICP at Constant Taxes HICP Index % change Over previous month 115.51 120.27 Over one year -0.7 -0.7 CPI − DECEMBER 2014 (13/13) -1.1 -1.1


© Copyright 2026