
Broker Bankia
European Small & Mid Caps Stock Guide MAY 2014 Investment research Produced and Distributed by the Members of ESN European Small & Mid Caps Selection European Securities Network (ESN) ESN is a “multi-local” network of European banks and investment firms: over 100 analysts from 9 countries analyse a total of over 650 stocks and 30 sectors. The partners retain their independence and expertise on their respective home markets. The joint research products are based on a single ESN recommendation system, a central proprietary Database and a Pan European approach to sectoral coverage. Banca Akros Italy SNS Securities The Netherlands Pohjola Bank Degroof Belgium BEKA Finance Finland Spain Caixa - Banco de Investimento Investment Bank of Greece Portugal Greece Equinet Bank CM - CIC Securities France Germany ESN research is also available in the ‘ESNR’ Bloomberg page th All prices as of 19 May 2014 1 EUROPEAN SMALL & MID CAPS SELECTION COVERAGE May 2014 AALBERTS NL 16 BONDUELLE FR 48 EUROPAC ES 80 AAREAL BANK DE 17 BOURBON FR 49 EVS BE 81 AB-BIOTICS ES 18 BOURSORAMA FR 50 EXACT HOLDING NV NL 82 ACCELL GROUP NL 19 BPI PT 51 EXPRIVIA IT 83 ACEA IT 20 BREMBO IT 52 EZENTIS ES 84 ACOMO NL 21 BRUNEL NL 53 F-SECURE FI 85 ACOTEL IT 22 CAF ES 54 FAES FARMA ES 86 AEDIFICA BE 23 CAPMAN FI 55 FAIVELEY FR 87 AHLSTROM FI 24 CARBURES EUROPE SA ES 56 FALCK RENEWABLES IT 88 DE 25 CAVERION FI 57 FINNAIR FI 89 FI 26 CFE BE 58 FOURLIS HOLDINGS GR 90 ALMIRALL ES 27 CITYCON FI 59 GAMELOFT FR 91 ALTEN FR 28 COMDIRECT DE 60 GAS PLUS IT 92 ALTRAN FR 29 CORP. FINANCIERA ALBA ES 61 GEOX IT 93 ALTRI PT 30 CRAMO FI 62 GERRESHEIMER AG DE 94 AMPLIFON IT 31 CREDEM IT 63 Gimv BE 95 ANSALDO STS IT 32 CREVAL IT 64 GRENKELEASING AG DE 96 ARCADIS NL 33 CTT PT 65 HELLENIC EXCHANGES GR 97 ASM INTERNATIONAL NL 34 DANIELI IT 66 HERA IT 98 ASTALDI IT 35 DATALOGIC IT 67 HES BEHEER NL 99 ATRIA FI 36 DE LONGHI IT 68 HHLA DE 100 BARCO BE 37 DEUTSCHE EUROSHOP DE 69 HKSCAN FI 101 BASWARE FI 38 DIASORIN IT 70 IGD IT 102 BAYWA DE 39 DRAEGERWERK DE 71 IMA IT 103 BB BIOTECH DE 40 DRILLISCH DE 72 IMPRESA PT 104 BENETEAU AIXTRON AKTIA FR 41 DURO FELGUERA ES 73 IMTECH NL 105 BENI STABILI IT 42 EDITORIALE L'ESPRESSO IT 74 INDESIT IT 106 BESI NL 43 EI TOWERS IT 75 INTERPARFUMS FR 107 BINCKBANK NL 44 ELRINGKLINGER DE 76 INTERPUMP IT 108 BIOTEST DE 45 ENCE ES 77 INTERVEST OFFICES & WAREHOUSES BE 109 BOIS SAUVAGE BE 46 ENGINEERING IT 78 INTRALOT GR 110 BOLSAS Y MERCADOS ESPANOLES SA ES 47 ESPIRITO SANTO SAUDE PT 79 IREN IT 111 2 EUROPEAN SMALL & MID CAPS SELECTION COVERAGE ITALCEMENTI IT 112 OLVI FI 145 SPONDA FI 178 JENOPTIK DE 113 ORDINA NL 146 STALLERGÈNES FR 179 Joyou Ag DE 114 ORIOLA-KD FI 147 STOCKMANN FI 180 KBC ANCORA BE 115 ORPEA FR 148 SURTECO DE 181 KENDRION NL 116 PATRIZIA AG DE 149 TECHNOPOLIS FI 182 KINEPOLIS BE 117 PFEIFFER VACUUM DE 150 TELEGRAAF MEDIA GROEP NL 183 KORIAN-MEDICA FR 118 PIAGGIO IT 151 TEN CATE NL 184 LABORATORIOS ROVI ES 119 PKC GROUP FI 152 TESSENDERLO BE 185 LASSILA & TIKANOJA FI 120 PORTUCEL PT 153 TF1 FR 186 LDC FR 121 PSI DE 154 TI MEDIA IT 187 LEASINVEST REAL ESTATE BE 122 RAISIO FI 155 TIETO FI 188 LEONI DE 123 RALLYE FR 156 TIKKURILA FI 189 LISI FR 124 RAMIRENT FI 157 TKH GROUP NL 190 LOTUS BAKERIES BE 125 RCS MEDIAGROUP IT 158 TOMTOM NL 191 LUXEMPART LU 126 RECORDATI IT 159 TREVI IT 192 M6-METROPOLE TELEVISION FR 127 REPLY IT 160 TUBACEX ES 193 MAIRE TECNIMONT IT 128 RETAIL ESTATES BE 161 UBISOFT FR 194 MANITOU FR 129 RHEINMETALL DE 162 UPONOR FI 195 MARR IT 130 RIB SOFTWARE DE 163 USG PEOPLE NL 196 MAUREL ET PROM FR 131 ROYAL BAM GROUP NL 164 VACON FI 197 MELIA HOTELS INTERNATIONAL ES 132 SAF-HOLLAND DE 165 VAISALA FI 198 METSÄ BOARD FI 133 SAFILO IT 166 VASTNED RETAIL NL 199 MLP DE 134 SAFT FR 167 VICAT FR 200 MOBISTAR BE 135 SALINI IMPREGILO IT 168 VIDRALA ES 201 MOTA ENGIL PT 136 SALZGITTER DE 169 VILMORIN FR 202 MOTOR OIL GR 137 SANOMA FI 170 WESSANEN NL 203 NATUREX FR 138 SEMAPA PT 171 WINCOR NIXDORF DE 204 NEDAP NL 139 SIAS IT 172 YIT FI 205 NEOPOST FR 140 SIEGFRIED HOLDING AG CH 173 ZELTIA ES 206 NEXANS FR 141 SIPEF BE 174 NH HOTEL GROUP ES 142 SLIGRO NL 175 NOVABASE PT 143 SOGEFI IT 176 NUTRECO NL 144 SORIN IT 177 3 BELGIUM COMPANY Price on 19/05/14 (EUR) AEDIFICA 51.0 BARCO 54.8 BOIS SAUVAGE 234.3 CFE 74.6 EVS 39.0 Gimv 37.3 INTERVEST OFFICES & WAREHOUSES 22.3 KBC ANCORA 24.3 KINEPOLIS 138.9 LEASINVEST REAL ESTATE 80.0 LOTUS BAKERIES 830.0 LUXEMPART 32.4 MOBISTAR 15.1 RETAIL ESTATES 60.5 SIPEF 63.5 TESSENDERLO 22.1 VASTNED RETAIL 36.6 WDP 53.8 Capitalisation (EURm ) 504 670 369 1,888 543 922 322 1,905 734 395 647 776 907 352 568 703 698 865 Analysts JMC BJ HD HD BJ HD DP DP DP DP HD HD BJ DP BH BH DP DP / JMC ESN recom . Hold Accumulate Reduce Accumulate Hold Hold Hold Reduce Hold Hold Hold Hold Reduce Hold Hold Hold Hold Hold YTD -1.0% -3.3% 9.4% 15.2% -16.9% -1.8% 14.6% -7.4% 20.7% 8.7% 16.3% 16.5% 9.5% 7.4% 10.1% 16.6% 11.1% 2.1% Abs. Perform ance 3 m onths 1 m onth -0.4% 2.0% -0.3% -3.3% 2.5% 2.3% 15.8% -6.2% -15.4% -14.1% 0.8% 1.2% 8.5% 0.5% -15.7% -9.4% 17.1% 2.0% 3.6% -0.7% 2.0% 5.0% 15.8% 1.9% 8.6% 13.4% 5.1% 5.4% 9.5% 2.7% 9.1% 6.7% 1.2% 4.1% 1.6% -2.4% P/E Adj. 2014 25.6 12.1 16.0 16.1 14.0 20.9 14.2 22.4 30.2 16.1 14.1 35.0 16.6 13.3 Gross yield 2014 3.7% 2.9% 3.2% 1.7% 6.2% 6.6% 6.3% 0.0% 2.3% 5.9% 1.4% 3.0% 0.0% 5.0% 2.0% 0.0% 5.1% 6.3% EV/Sales 2014 EV/EBITDA 2014 0.5 3.5 0.7 3.9 5.6 10.2 3.2 11.2 2.0 12.3 1.1 5.6 2.7 0.7 7.3 12.5 BEL 20 index (50 days & 200 days averages) Head of Research: Jean-Marie Caucheteux 3,200 Contributing Analysts Bart Jooris, CFA Bernard Hanssens Dirk Peeters Hans D'Haese Jean-Marie Caucheteux BJ BH DP HD JMC +32 2 287 92 79 +32 (0) 2 287 9689 +32 2 287 97 16 +32 (0) 2 287 9223 +32 2 287 99 20 [email protected] [email protected] [email protected] [email protected] [email protected] 3,000 2,800 2,600 2,400 2,200 2,000 1,800 Mar 11 4 Jun 11 Sep 11 Dec 11 Mar 12 Jun 12 Sep 12 Dec 12 Mar 13 Jun 13 Sep 13 Dec 13 Mar 14 Jun 14 FINLAND COMPANY AHLSTROM AKTIA ATRIA BASWARE CAPMAN CAVERION CITYCON CRAMO F-SECURE FINNAIR HKSCAN LASSILA & TIKANOJA METSÄ BOARD OLVI ORIOLA-KD PKC GROUP RAISIO RAMIRENT SANOMA SPONDA STOCKMANN TECHNOPOLIS TIETO TIKKURILA UPONOR VACON VAISALA YIT Price on 19/05/14 (EUR) 7.7 8.9 7.0 34.7 1.1 7.7 2.7 15.1 2.3 3.0 3.5 14.2 3.4 23.4 2.3 21.1 4.2 7.3 5.1 3.7 10.1 4.4 19.6 18.9 14.0 29.0 23.6 7.4 Capitalisation (EURm ) 359 593 198 445 90 962 1,178 656 357 377 188 551 1,112 486 352 504 665 791 828 1,050 728 470 1,424 835 1,025 885 426 929 Analysts NC AS NC KS NC MR MR MR KS JR NC HP HP NC KS HR NC MR KS MR JR MR HR AS MR PS HR MR ESN recom . Reduce Accumulate Buy Accumulate Accumulate Accumulate Rating Suspended Buy Reduce Accumulate Hold Buy Accumulate Hold Hold Reduce Buy Buy Accumulate Hold Reduce Accumulate Sell Hold Accumulate Reduce Reduce Hold YTD -7.2% 9.9% -9.4% 38.5% -7.9% -13.9% 4.3% -1.4% 23.0% 6.5% -7.4% -6.8% 7.6% -18.1% -8.6% -12.8% -4.8% -20.4% -20.4% 8.5% -8.4% 1.6% 19.4% -4.9% -1.5% -0.7% 1.7% -27.0% Abs. Perform ance 3 m onths 1 m onth 2.7% -1.3% 0.6% 1.1% -20.5% -0.3% 5.9% 2.2% -3.7% 1.9% 7.3% -8.5% -0.4% 1.1% -1.4% 0.1% 5.5% 5.5% 9.3% 5.4% -7.9% -10.3% -5.6% -0.3% 11.9% 3.4% -17.4% -7.6% -2.1% 0.0% -5.6% -4.6% -14.2% -8.4% -18.7% -7.1% -4.8% 9.4% -3.1% -1.9% -15.9% -2.1% -3.3% 5.2% 7.9% 6.1% -4.7% 8.9% 11.6% 7.9% 0.5% -2.0% -2.3% 0.2% -13.8% -2.8% Head of Research: Henri Parkkinen Gross yield 2014 3.9% 5.6% 3.1% 0.9% 7.4% 4.7% 5.9% 4.3% 3.5% 0.0% 31.6% 4.2% 2.9% 3.2% 2.1% 3.6% 3.4% 5.5% 3.9% 4.9% 1.5% 3.2% 5.2% 4.4% 3.6% 2.4% 3.8% 6.0% EV/Sales 2014 0.4 EV/EBITDA 2014 6.5 0.4 3.3 2.9 0.4 7.0 24.2 7.1 9.2 1.5 1.9 0.4 0.0 0.9 0.9 1.6 0.2 0.6 1.1 1.5 0.8 5.5 9.1 2.6 1.2 5.4 7.5 9.3 7.9 8.1 11.9 5.2 3.5 0.7 12.0 0.8 1.3 1.0 2.0 1.2 1.3 6.4 8.7 9.6 13.9 2.4 9.2 OMXH index (50 days & 200 days averages) Contributing Analysts Antti Saari Hannu Rauhala Henri Parkkinen Jari Raisanen Kimmo Stenvall Matias Rautionmaa Niclas Catani Pekka Spolander P/E Adj. 2014 32.5 11.2 27.9 nm 9.1 15.4 13.4 14.9 22.3 29.9 2.4 13.9 15.2 13.7 19.9 20.3 23.4 15.8 23.5 10.2 nm 9.5 13.5 15.9 24.0 24.8 21.8 8.4 8,000 AS HR HP JR KS MR NC PS +358 10 252 4359 +358 10 252 4392 +358 10 252 4409 +358 10 252 4504 +358 10 252 4561 +358 10 252 4408 +358 10 252 8780 +358 10 252 4351 [email protected] [email protected] [email protected] [email protected] [email protected] [email protected] [email protected] [email protected] 7,500 7,000 6,500 6,000 5,500 5,000 4,500 Mar 11 Jun 11 Sep 11 Dec 11 Mar 12 Jun 12 Sep 12 Dec 12 Mar 13 Jun 13 Sep 13 Dec 13 Mar 14 Jun 14 At End Source: Factset 5 FRANCE COMPANY ALTEN ALTRAN BENETEAU BONDUELLE BOURBON BOURSORAMA FAIVELEY GAMELOFT INTERPARFUMS KORIAN-MEDICA LDC LISI M6-METROPOLE TELEVISION MANITOU MAUREL ET PROM NATUREX NEOPOST NEXANS ORPEA SAFT STALLERGÈNES TF1 UBISOFT VICAT VILMORIN Price on 19/05/14 (EUR) 36.0 7.4 12.0 22.2 23.8 12.0 56.5 7.0 31.0 27.3 132.9 116.4 13.9 12.5 12.4 65.1 59.9 41.8 51.3 24.3 56.2 12.4 14.3 59.3 97.2 Capitalisation (EURm ) 1,178 1,297 995 710 1,777 1,054 804 585 689 928 1,084 1,256 1,746 494 1,503 502 2,004 1,756 2,848 628 755 2,612 1,490 2,602 1,841 Analysts JMK SL FP FP JLR PC CA ER AC CA FP AB ER / EC CA JLR JPB CA AA CA ER AG ER / EC ER JM FP ESN recom . Reduce Reduce Buy Accumulate Buy Hold Sell Hold Reduce Hold Hold Hold Hold Buy Accumulate Hold Hold Reduce Buy Reduce Hold Hold Hold Hold Buy YTD 9.1% 16.4% -11.4% 15.3% 19.2% 47.2% 7.7% -15.0% -1.1% 32.4% 19.0% 8.0% -16.8% -9.6% 2.0% 11.7% 7.0% 13.5% 21.5% -2.9% 3.6% -11.7% 38.7% 9.7% 0.0% Abs. Perform ance 3 m onths 1 m onth 0.9% -3.8% 1.7% -8.3% 3.9% -2.6% 12.7% 8.5% 11.8% -0.1% 35.0% -0.9% -3.9% -1.6% -11.9% -0.6% -3.1% -4.0% 5.2% 1.0% 11.8% 0.1% -5.4% 1.1% -18.7% -10.1% -4.7% 2.2% 4.6% 0.8% 1.0% 2.1% -7.8% 3.8% 10.4% 7.4% 17.1% 7.8% -4.2% -2.5% 0.3% -2.4% -11.8% -2.5% 19.8% 13.7% 4.8% -3.2% -0.6% 0.4% P/E Adj. 2014 14.2 12.9 nm 15.0 17.5 28.7 12.9 25.6 25.4 31.2 13.6 14.2 15.3 13.9 9.2 24.9 13.6 29.2 23.5 15.1 16.8 13.2 15.7 16.0 17.9 Gross yield 2014 3.5% 0.0% 0.8% 1.8% 4.8% 0.0% 1.8% 0.0% 1.3% 2.2% 1.4% 1.4% 6.1% 1.8% 3.6% 0.2% 6.6% 0.4% 1.2% 3.3% 1.4% 4.4% 0.0% 2.9% 1.7% EV/Sales 2014 0.8 0.8 1.3 0.7 2.3 EV/EBITDA 2014 8.0 8.2 14.4 7.2 8.5 1.0 1.9 1.5 1.6 0.3 1.1 1.2 0.4 2.6 2.0 2.7 0.5 2.6 1.1 2.3 0.9 0.9 1.6 1.4 7.8 10.4 10.1 11.3 4.2 6.7 4.9 5.9 3.2 11.5 9.4 9.3 14.3 6.7 7.5 6.7 2.3 7.7 6.8 CAC All Tradable index (50 days & 200 days averages) Head of Research: Marc Gouget 3,600 Contributing Analysts Emmanuel Chevalier Agnès Blazy Ari Agopyan Arnaud Cadart Arsène Guekam Christian Auzanneau Eric Ravary Francis Prêtre Jean-Christophe Lefèvre-Moulenq Jean-Luc Romain Jean-Michel Koster Jean-Pascal Brivady Sébastien Liagre 6 3,400 EC AB AA AC AG CA ER FP JM JLR JMK JPB SL +33 1 45 96 77 42 +33 1 45 96 77 61 +33 1 45 96 85 80 +33 1 45 96 78 76 +33 4 78 92 01 85 +33 1 45 96 79 53 +33 4 78 92 02 30 +33 1 45 96 91 04 +33 1 45 96 77 36 +33 1 45 96 77 17 +33 4 78 92 02 25 +33 1 45 96 90 34 [email protected] [email protected] [email protected] [email protected] [email protected] [email protected] [email protected] [email protected] [email protected] [email protected] [email protected] [email protected] [email protected] 3,200 3,000 2,800 2,600 2,400 2,200 2,000 Mar 11 Jun 11 Source: Factset Sep 11 Dec 11 Mar 12 Jun 12 Sep 12 Dec 12 Mar 13 Jun 13 Sep 13 Dec 13 Mar 14 Jun 14 GERMANY COMPANY AAREAL BANK AIXTRON BAYWA BB BIOTECH BIOTEST COMDIRECT DEUTSCHE EUROSHOP DRAEGERWERK DRILLISCH ELRINGKLINGER GERRESHEIMER AG GRENKELEASING AG HHLA JENOPTIK Joy ou Ag LEONI MLP PATRIZIA AG PFEIFFER VACUUM RHEINMETALL RIB SOFTWARE SAF-HOLLAND SALZGITTER SIEGFRIED HOLDING AG SURTECO WINCOR NIXDORF Price on 19/05/14 (EUR) 33.4 10.2 40.4 119.5 83.1 8.2 36.1 75.0 27.0 28.6 47.9 75.6 17.5 12.4 12.8 53.2 4.9 9.4 79.6 47.0 11.5 11.5 32.2 129.2 28.4 43.3 Capitalisation (EURm ) 1,997 1,047 1,394 1,416 1,029 1,156 1,947 1,238 1,294 1,813 1,505 1,100 1,226 709 307 1,739 529 594 785 1,783 437 522 1,741 461 440 1,290 Analysts PH AP MS MM MM PH JR KL AP TS KL PH JR AP KL TS PH PH AP AP JR TS SF MM KL AP ESN recom . Accumulate Sell Accumulate Buy Hold Accumulate Hold Hold Hold Reduce Hold Hold Reduce Buy Buy Accumulate Accumulate Accumulate Reduce Accumulate Buy Buy Buy Buy Hold Buy YTD 15.9% -3.3% 6.9% 3.7% 9.3% -1.1% 13.4% -21.0% 28.3% -3.2% -5.7% 11.1% -1.6% 0.3% -0.2% -2.0% -6.0% 22.9% -19.6% 4.8% 60.3% 6.4% 3.8% -2.2% 23.2% -14.0% Abs. Perform ance 3 m onths 1 m onth 13.5% 4.6% -19.1% -11.4% -1.1% 0.9% -16.9% 2.6% -4.5% -4.2% -4.9% 0.6% 10.6% 6.2% -23.1% -14.3% 12.6% 3.8% 3.5% -0.1% -1.8% 0.9% -0.7% 2.4% -10.2% 2.8% -1.7% 4.8% -6.8% 2.2% -4.2% -0.5% -6.8% 1.1% 15.4% 14.2% -9.4% -3.0% -11.2% -6.3% 21.7% 5.0% -5.9% 5.2% 0.7% 5.4% -3.7% -2.5% -1.0% 1.4% -24.4% -9.2% P/E Adj. 2014 16.7 nm 12.4 27.5 18.8 19.2 14.4 23.0 17.1 17.9 19.9 24.6 14.3 8.4 11.3 13.4 14.7 17.2 16.3 31.1 12.2 nm 14.8 21.0 13.0 Gross yield 2014 3.7% 0.0% 2.0% 4.8% 0.0% 4.4% 3.6% 1.7% 6.3% 2.1% 1.5% 1.5% 2.6% 1.7% 0.0% 2.8% 5.1% 2.0% 3.7% 2.1% 1.3% 3.7% 0.8% 0.9% 2.3% 3.9% EV/Sales 2014 EV/EBITDA 2014 3.9 0.1 nm 6.2 1.8 10.9 0.6 4.1 1.8 1.8 6.0 13.9 9.1 9.0 1.5 1.1 0.9 0.5 0.9 4.4 1.7 0.5 5.1 0.7 0.3 1.6 1.0 0.6 6.6 8.9 5.3 6.0 7.1 41.1 9.5 6.2 13.8 7.1 6.8 8.3 8.0 7.0 MDAX index (50 days & 200 days averages) Head of Research: Tim Schuldt, CFA 17,000 16,000 Contributing Analysts Philipp Häßler, CFA Adrian Pehl, CFA Holger Schmidt, CEFA Jochen Rothenbacher, CEFA Konrad Lieder Marietta Miemietz CFA Michael Schaefer Stefan Freudenreich, CFA Tim Schuldt, CFA PH AP HS JR KL MM MS SF TS +49 69 58997 414 +49 69 58997 438 +49 69 58 99 74 32 +49 69 58997 415 +49 69 5899 7436 +49-69-58997-439 +49 69 58997 419 +49 69 58997 437 +49 69 5899 7433 [email protected] [email protected] [email protected] [email protected] [email protected] [email protected] [email protected] [email protected] [email protected] 15,000 14,000 13,000 12,000 11,000 10,000 9,000 8,000 Mar 11 Jun 11 Sep 11 Dec 11 Mar 12 Jun 12 Sep 12 Dec 12 Mar 13 Jun 13 Sep 13 Dec 13 Mar 14 Jun 14 Source: Factset 7 GREECE COMPANY FOURLIS HOLDINGS HELLENIC EXCHANGES INTRALOT MOTOR OIL Price on 19/05/14 (EUR) 4.8 7.6 1.9 7.7 Capitalisation (EURm ) 242 497 294 854 Analysts DB / NSS DB DB VR ESN recom . Buy Buy Accumulate Accumulate YTD 16.1% -5.0% 0.5% -6.2% Abs. Perform ance 3 m onths 1 m onth -4.6% -17.7% -1.3% -12.6% -13.1% -14.0% -12.4% -13.1% P/E Adj. 2014 nm 17.0 25.3 9.7 Gross yield 2014 0.0% 2.9% 0.4% 7.8% EV/Sales 2014 0.9 6.3 0.6 0.2 EV/EBITDA 2014 13.0 10.2 4.9 6.1 Athex Composite index (50 days & 200 days averages) Head of Research: Konstantinos Manolopoulos 1,600 Contributing Analysts Dimitris Birbos Natalia Svyrou-Svyriadi Dimitris Birbos Vassilis Roumantiz DB NSS DB +30 210 81 73 392 +30 210 81 73 384 +30 210 81 73 392 VR +30 2108173394 [email protected] [email protected] [email protected] [email protected] 1,400 1,200 1,000 800 600 400 Mar 11 Jun 11 Source: Factset 8 Sep 11 Dec 11 Mar 12 Jun 12 Sep 12 Dec 12 Mar 13 Jun 13 Sep 13 Dec 13 Mar 14 Jun 14 ITALY COMPANY ACEA ACOTEL AMPLIFON ANSALDO STS ASTALDI BENI STABILI BREMBO CREDEM CREVAL DANIELI DATALOGIC DE LONGHI DIASORIN EDITORIALE L'ESPRESSO EI TOWERS ENGINEERING EXPRIVIA FALCK RENEWABLES GAS PLUS GEOX HERA IGD IMA INDESIT INTERPUMP IREN ITALCEMENTI MAIRE TECNIMONT MARR PIAGGIO RCS MEDIAGROUP RECORDATI REPLY SAFILO SALINI IMPREGILO SIAS SOGEFI SORIN TI MEDIA TREVI Price on 19/05/14 (EUR) 9.3 17.4 4.4 7.6 7.3 0.6 27.3 6.3 1.5 23.3 8.7 16.0 29.0 1.5 37.8 46.5 0.8 1.3 4.8 2.8 2.0 1.2 31.5 9.9 9.8 1.1 7.4 2.3 13.6 2.7 1.5 11.4 57.0 15.6 4.1 8.5 3.9 2.2 1.4 7.1 Capitalisation (EURm ) 1,990 72 993 1,372 715 1,149 1,826 2,091 706 1,609 508 2,391 1,620 602 1,067 581 42 365 214 729 2,857 413 1,158 1,130 1,066 1,259 1,817 709 905 973 728 2,376 526 960 1,658 1,928 460 1,039 143 501 Analysts DM ADV PS GG FS FS GG LT LT PS PS CG PS ADV ADV ADV ADV DM DM GC DM FS PS CG PS DM FS FS CG GG ADV PS ADV GC FS FS GG PS ADV PS ESN recom . Accumulate Hold Accumulate Buy Accumulate Accumulate Accumulate Reduce Hold Accumulate Buy Hold Accumulate Hold Accumulate Hold Hold Buy Buy Hold Accumulate Accumulate Hold Hold Accumulate Buy Hold Accumulate Hold Hold Accumulate Accumulate Hold Hold Hold Buy Accumulate Accumulate Reduce Hold YTD 12.9% -11.7% 10.0% -2.9% -5.2% 22.4% 39.6% 8.3% 9.7% -6.7% 5.1% 34.7% -14.9% 8.4% 12.9% 6.9% -2.8% -3.3% 0.2% 6.6% 22.8% 37.6% 12.3% 3.1% 12.3% -4.3% 19.0% 42.5% 12.6% 11.9% 9.8% 8.6% 0.2% -8.5% -15.7% 17.5% -9.8% 4.6% -22.5% 13.4% Abs. Perform ance 3 m onths 1 m onth 1.4% -12.3% -21.1% -15.6% -1.2% -1.0% -5.6% 1.1% 3.0% -6.7% -0.5% -6.0% 23.4% 0.5% -2.9% -13.2% 17.4% -10.3% -13.2% -6.2% 12.2% -7.6% 8.8% -0.1% -15.6% -0.4% -23.0% -9.6% -3.4% -6.7% -3.1% -6.1% -17.0% -9.2% -9.5% -10.4% -2.1% -0.3% -8.9% -7.7% 8.3% -5.4% 8.4% -6.3% -9.8% -12.6% -1.2% -5.5% -1.6% -5.4% -11.3% -15.5% -7.3% -17.4% 36.7% -3.3% 3.4% -1.2% 22.9% -3.9% -7.6% -12.0% -9.5% -7.6% -8.1% -13.5% -8.3% 7.6% -9.5% -7.6% 4.6% 0.5% -4.6% -16.9% -3.6% 3.0% -26.4% -24.6% 2.4% -12.6% P/E Adj. 2014 14.6 nm 32.1 16.9 7.1 22.4 nm 15.4 nm 12.7 16.9 18.6 19.6 44.1 30.0 12.4 7.7 nm 16.9 nm 16.8 16.9 20.5 24.5 22.5 10.5 nm 17.2 17.5 31.6 nm 15.6 14.1 27.3 12.9 13.6 11.9 16.8 nm 33.7 Gross yield 2014 4.5% 0.0% 1.0% 2.1% 3.5% 3.7% 1.8% 1.9% 0.0% 1.4% 1.7% 2.9% 1.8% 2.0% 2.7% 1.4% 0.0% 0.4% 3.6% 0.0% 4.4% 3.6% 4.0% 0.0% 1.9% 5.3% 2.1% 0.0% 4.4% 1.9% 0.0% 2.7% 1.2% 0.0% 1.5% 4.1% 3.2% 0.0% 0.0% 1.8% EV/Sales 2014 1.3 0.4 1.5 0.7 0.6 EV/EBITDA 2014 5.8 11.3 9.7 6.7 4.7 1.2 8.3 0.2 1.3 1.4 3.3 1.0 4.6 0.6 0.8 3.8 1.4 1.0 1.2 2.1 9.4 9.2 9.0 9.0 10.0 5.0 6.5 7.5 4.7 30.9 6.4 1.5 0.6 1.8 1.1 1.1 0.5 0.8 1.1 0.8 2.7 0.9 0.9 0.4 3.2 0.6 1.5 5.9 0.8 9.7 7.7 9.3 5.9 7.0 7.5 11.1 8.8 20.5 10.4 6.7 9.5 3.6 5.5 6.0 8.2 13.9 7.2 9 FTSE Italy All Share index (50 days & 200 days averages) Head of Research: Francesco Previtera Contributing Analysts Andrea Devita, CFA Claudio Giacomiello, CFA Dario Michi Francesco Sala Gabriele Gambarova Giada Cabrino, CIIA Luigi Tramontana Paola Saglietti 23,000 ADV CG DM FS GG GC LT PS +39 02 4344 4031 +39 02 4344 4269 +39 02 4344 4237 +39 02 4344 4240 +39 02 43 444 289 +39 02 4344 4092 +39 02 4344 4239 +39 02 4344 4287 [email protected] [email protected] [email protected] [email protected] [email protected] [email protected] [email protected] [email protected] 22,000 21,000 20,000 19,000 18,000 17,000 16,000 15,000 14,000 13,000 Mar 11 Jun 11 Source: Factset 10 Sep 11 Dec 11 Mar 12 Jun 12 Sep 12 Dec 12 Mar 13 Jun 13 Sep 13 Dec 13 Mar 14 Jun 14 NETHERLANDS COMPANY AALBERTS ACCELL GROUP ACOMO ARCADIS ASM INTERNATIONAL BESI BINCKBANK BRUNEL EXACT HOLDING NV HES BEHEER IMTECH KENDRION NEDAP NUTRECO ORDINA ROYAL BAM GROUP SLIGRO TELEGRAAF MEDIA GROEP TEN CATE TKH GROUP TOMTOM USG PEOPLE WESSANEN Price on 19/05/14 (EUR) 23.7 13.8 17.5 26.5 30.2 11.6 8.5 44.7 26.9 44.1 1.2 25.4 32.0 33.0 1.9 3.6 30.5 7.2 20.7 25.0 5.2 10.4 4.4 Capitalisation (EURm ) 2,616 338 408 1,914 1,917 434 628 1,090 640 399 537 329 214 2,270 174 867 1,338 336 554 948 1,157 832 329 Analysts GS GS GR EDJ EDJ EDJ LS GS MDD MDD EDJ GS / JVDH JVDH GR JVDH EDJ GR JVDH GS GS MDD GS GR ESN recom . Buy Reduce Hold Accumulate Buy Buy Hold Buy Hold Hold Hold Buy Hold Hold Hold Buy Buy Buy Buy Hold Hold Reduce Accumulate YTD 2.1% 2.7% 5.6% 3.5% 26.1% 41.4% 9.9% 0.4% 14.4% -2.0% -44.2% 6.3% 6.7% -8.6% -0.8% -5.1% 8.1% -20.4% -9.8% -1.8% 1.2% 7.3% 53.3% Abs. Perform ance 3 m onths 1 m onth -0.5% -3.2% -3.0% -4.4% 3.4% -1.5% -1.5% 0.3% 16.1% 4.9% 29.7% 6.2% 3.7% 6.7% -0.7% -8.0% 2.6% 0.9% -1.2% -0.6% -40.8% -20.0% 5.7% 2.3% 2.6% -0.1% 1.2% 3.0% -8.2% -7.0% -10.6% -7.4% 4.3% -0.4% 0.3% -1.4% -15.8% -8.8% -1.4% -1.4% 14.2% 13.2% -21.2% -10.7% 30.0% 8.5% P/E Adj. 2014 14.7 12.3 14.0 14.8 31.4 14.2 11.7 18.3 21.5 14.1 nm 13.9 18.7 16.9 14.2 11.4 17.8 11.6 12.7 11.9 16.3 14.5 14.8 Gross yield 2014 2.0% 4.4% 4.7% 2.2% 1.8% 2.6% 4.3% 2.7% 4.7% 0.0% 0.0% 2.9% 4.0% 3.0% 1.7% 3.5% 3.9% 6.9% 2.6% 3.2% 0.0% 2.3% 1.6% EV/Sales 2014 1.4 0.6 0.8 0.8 2.7 1.2 EV/EBITDA 2014 9.3 10.3 10.0 8.7 16.1 7.0 0.7 2.5 2.7 0.3 1.0 1.3 0.7 0.4 0.0 0.5 0.6 0.7 0.9 1.2 0.5 0.7 11.0 12.0 9.0 10.6 8.0 9.9 9.8 9.2 1.5 8.8 4.4 7.6 8.3 7.4 10.9 8.2 Amsterdam Small Cap Index index (50 days & 200 days averages) Head of Research: Martijn den Drijver Contributing Analysts Edwin de Jong Gerard Rijk Gert Steens Johan van den Hooven Martijn den Drijver 600 EDJ GR GS JVDH MDD +312 0 5508569 + 31 (0)20 550 8572 +312 0 5508639 +312 0 5508518 +312 0 5508636 [email protected] [email protected] [email protected] [email protected] [email protected] 550 500 450 400 350 Mar 11 Jun 11 Sep 11 Dec 11 Mar 12 Jun 12 Sep 12 Dec 12 Mar 13 Jun 13 Sep 13 Dec 13 Mar 14 Jun 14 Source: Factset 11 PORTUGAL COMPANY ALTRI BPI CTT ESPIRITO SANTO SAUDE IMPRESA MOTA ENGIL NOVABASE PORTUCEL SEMAPA ZON OPTIMUS Price on 19/05/14 (EUR) 2.3 1.6 7.1 3.6 1.7 4.7 3.9 3.4 10.3 4.8 Capitalisation (EURm ) 467 2,227 1,070 348 281 914 121 2,626 1,219 2,469 Analysts CJ / AA AR CJ / AA AR / JMF HB JMF JMF CJ / AA CJ AA ESN recom . Buy Hold Hold Hold Reduce Rating Suspended Accumulate Accumulate Hold Accumulate Abs. Perform ance 3 m onths 1 m onth -16.7% -5.5% -4.6% -18.3% -0.6% -8.0% 12.3% 7.1% 53.5% 12.3% -11.9% 9.2% -4.3% -11.0% 47.9% 7.2% -0.3% 17.6% 9.5% 7.9% 26.5% 0.5% 2.3% -11.2% -9.6% -7.1% YTD 1.6% 31.7% 27.5% P/E Adj. 2014 10.2 18.9 15.3 20.7 16.3 12.8 30.4 21.7 20.1 30.0 Gross yield 2014 0.9% 0.0% 5.7% 1.2% 0.0% 4.1% 5.2% 7.6% 2.5% 2.5% EV/Sales 2014 1.8 EV/EBITDA 2014 6.9 0.8 1.4 1.9 0.8 0.5 2.1 1.6 2.5 4.6 8.8 11.4 5.4 7.1 10.0 8.1 7.0 PSI20 index (50 days & 200 days averages) Head of Research: João Miguel Lourenço 8,000 Contributing Analysts André Rodrigues Artur Amaro Carlos Jesus Helena Barbosa José Mota Freitas, CFA AR AA CJ HB JMF +351 21 389 68 39 +351 213 89 6822 +351 21 389 6812 +351 21 389 6831 +351 22 607 09 31 [email protected] [email protected] [email protected] [email protected] [email protected] 7,500 7,000 6,500 6,000 5,500 5,000 4,500 4,000 Mar 11 12 Jun 11 Sep 11 Dec 11 Mar 12 Jun 12 Sep 12 Dec 12 Mar 13 Jun 13 Sep 13 Dec 13 Mar 14 Jun 14 SPAIN COMPANY Price on 19/05/14 (EUR) ALMIRALL 11.8 BOLSAS Y MERCADOS ESPANOLES SA 31.2 CAF 340.3 CARBURES EUROPE SA 26.3 CORP. FINANCIERA ALBA 43.0 DURO FELGUERA 4.9 ENCE 2.1 EUROPAC 3.9 EZENTIS 1.0 FAES FARMA 2.1 LABORATORIOS ROVI 9.9 MELIA HOTELS INTERNATIONAL 9.2 NH HOTEL GROUP 4.3 REALIA 1.2 TUBACEX 3.6 VIDRALA 36.6 ZELTIA 2.6 Capitalisation (EURm ) 2,037 2,605 1,167 501 2,509 790 527 334 152 455 494 1,699 1,332 361 479 896 576 Analysts AIGG JBV IR IR JBV IR IR IR RF AIGG AIGG SRG SRG RF IR IR AIGG ESN recom . Buy Buy Buy Buy Buy Reduce Accumulate Hold Buy Hold Hold Accumulate Accumulate Buy Hold Buy Accumulate YTD -0.5% 12.6% -11.4% 100.9% 1.2% 0.8% -22.8% 0.3% -36.8% -15.5% -1.1% -1.5% 0.8% 41.6% 24.7% -2.3% 12.1% Abs. Perform ance 3 m onths 1 m onth -6.0% 10.1% 3.3% 4.3% -10.7% -9.1% 13.8% -21.9% 2.7% -4.4% 2.3% 0.0% -20.0% -2.1% 1.2% -2.7% -27.2% -12.4% -13.4% -3.2% 3.2% 3.1% -1.9% 4.1% -2.0% -4.3% 3.1% -12.0% 19.6% 7.3% 0.8% -3.9% -3.7% 3.6% P/E Adj. 2014 33.3 16.0 12.0 nm 11.8 nm 13.5 nm 20.0 21.6 24.5 nm 34.1 24.7 14.7 42.4 Gross yield 2014 1.1% 6.0% 3.1% 0.0% 2.3% 4.9% 1.4% 3.3% 0.0% 1.9% 1.6% 0.8% 0.0% 0.0% 1.2% 2.0% 0.0% EV/Sales 2014 2.8 6.1 1.0 4.0 EV/EBITDA 2014 17.4 8.7 7.2 23.6 0.7 1.1 0.7 0.7 2.2 1.9 1.7 1.7 7.4 1.2 2.0 4.1 7.6 11.5 5.7 8.0 10.3 13.2 9.0 15.7 14.2 10.9 7.9 24.3 IBEX 35 index (50 days & 200 days averages) Head of Research: Victor Peiro Pérez 11,000 Contributing Analysts Ana Isabel González García CIIA Iñigo Recio Pascual Javier Bernat Rafael Fernández de Heredia Sonia Ruiz De Garibay Victor Peiro Pérez 10,500 AIGG IR JBV RF SRG VPP +34 91 436 78 09 +34 91 436 7814 +34 91 436 7816 +34 91 436 78 08 +34 91 436 7841 +34 91 436 7812 [email protected] [email protected] [email protected] [email protected] [email protected] [email protected] 10,000 9,500 9,000 8,500 8,000 7,500 7,000 6,500 6,000 Mar 11 Jun 11 Sep 11 Dec 11 Mar 12 Jun 12 Sep 12 Dec 12 Mar 13 Jun 13 Sep 13 Dec 13 Mar 14 Jun 14 13 EUROPEAN SMALL & MID CAPS SELECTION RANKING 10 Highest P/E (x) 2014 10 Lowest P/E (x) 2014 10 Highest P/BV (x) 2014 20 Highest ROCE/WACC 2014 20 Highest Gross Yield 2014 1 MAUREL ET PROM 9.2 1 HKSCAN 2.5 1 MAIRE TECNIMONT 9.2 1 CAPMAN 14.8 1 PORTUCEL 7.5 2 REN 9.9 2 ASTALDI 7.2 2 ZELTIA 8.7 2 TIETO 14.5 2 MOTOR OIL 7.4 3 IPSOS 11.1 3 EXPRIVIA 7.8 3 KINEPOLIS 7.9 3 BOLSAS Y MERCADOS ESPANOLES SA 14.4 3 CAPMAN 7.3 4 ADLER MODEMAERKTE 11.6 4 Joyou Ag 8.3 4 EVS 7.5 4 CTT 11.3 4 TELEGRAAF MEDIA GROEP 6.9 8.4 6.9 5 EXACT HOLDING NV 5 GESCO 11.7 5 YIT 5 VACON 9.1 5 Gimv 6.6 6 GL EVENTS 12.2 6 CAPMAN 9.2 6 BOLSAS Y MERCADOS ESPANOLES 6.7 SA6 ANSALDO STS 8.2 6 NEOPOST 6.5 7 DPA 12.3 7 MAUREL ET PROM 9.2 7 DRILLISCH 6.7 7 HELLENIC EXCHANGES 7.6 7 INTERVEST OFFICES & WAREHOUSES 6.3 8 FLEURY MICHON 12.7 8 TECHNOPOLIS 9.4 8 EXACT HOLDING NV 6.4 8 F-SECURE 6.5 8 DRILLISCH 6.2 9 MOTA ENGIL 12.8 9 ALTRI 10.1 9 F-SECURE 5.3 9 DURO FELGUERA 5.9 9 EVS 6.2 12.9 10 MOTOR OIL 10.2 10 IMA 5.0 10 VACON 5.8 10 M6-METROPOLE TELEVISION 6.1 11 DRILLISCH 5.7 11 LEASINVEST REAL ESTATE 6.0 12 DIASORIN 5.0 12 YIT 5.9 10 ALTRAN 10 Lowest P/BV (x) 2014 10 Highest abs. perf. YTD (%) 10 Lowest abs. perf. YTD (%) 13 STALLERGÈNES 4.4 13 CITYCON 5.9 100.9 1 IMTECH -44.2 14 EVS 4.2 14 BOLSAS Y MERCADOS ESPANOLES SA 5.8 RIB SOFTWARE 60.3 2 EZENTIS -36.8 15 BRUNEL 3.7 15 CTT 5.7 0.7 3 IMPRESA 53.5 3 YIT -27.0 16 GAMELOFT 3.4 16 AKTIA 5.4 0.6 4 WESSANEN 53.3 4 ENCE -22.8 17 TIKKURILA 3.3 17 IREN 5.3 5 FINNAIR 0.6 5 NOVABASE 47.9 5 TI MEDIA -22.5 18 AB-BIOTICS 3.2 18 RAMIRENT 5.3 6 EXPRIVIA 0.5 6 BOURSORAMA 47.2 6 DRAEGERWERK -21.0 19 M6-METROPOLE TELEVISION 3.1 19 VASTNED RETAIL 5.2 20 REPLY 2.9 20 MLP 5.2 1 ENCE 0.8 1 CARBURES EUROPE SA 2 Joyou Ag 0.8 2 3 ITALCEMENTI 4 SANOMA 7 SALZGITTER 0.5 7 MAIRE TECNIMONT 42.5 7 RAMIRENT -20.4 8 ATRIA 0.5 8 BESI 41.4 8 TELEGRAAF MEDIA GROEP -20.4 9 HKSCAN 0.4 9 BREMBO 39.6 9 SANOMA -20.4 0.4 10 UBISOFT 38.7 10 PFEIFFER VACUUM -19.6 10 CREVAL 14 EUROPEAN SMALL & MID CAPS SELECTION MARKET CAPS Stocks by market capitalisation (EURm) HERA IT 2,857 MAUREL ET PROM FR 1,503 MOTA ENGIL PT 966 EDITORIALE L'ESPRESSO IT 602 ACCELL GROUP NL 380 ORPEA FR 2,848 UBISOFT FR 1,490 CAVERION FI 962 PATRIZIA AG DE 594 FINNAIR FI 378 AALBERTS NL 2,640 BB BIOTECH DE 1,416 SAFILO IT 960 AKTIA FI 593 BOIS SAUVAGE BE 370 PORTUCEL PT 2,626 TIETO FI 1,407 YIT FI 929 GAMELOFT FR 585 FALCK RENEWABLES IT 365 TF1 FR 2,613 BAYWA DE 1,394 GIMV BE 922 ENGINEERING IT 581 AHLSTROM FI 359 BOLSAS Y MERCADOS ESPANOLESES SA 2,605 ANSALDO STS IT 1,372 MOBISTAR BE 907 NATUREX FR 579 F-SECURE FI 357 VICAT FR 2,602 CORP. FINANCIERA ALBA ES 2,509 SLIGRO NL 1,324 MARR IT 905 ZELTIA ES 576 ORIOLA-KD FI 352 DE LONGHI IT 2,391 ALTRAN FR 1,297 VIDRALA ES 896 TEN CATE NL 574 ESPIRITO SANTO SAUDE PT 348 RECORDATI IT 2,376 DRILLISCH DE 1,294 VACON FI 885 SIPEF BE 568 TELEGRAAF MEDIA GROEP NL 336 NUTRECO NL 2,267 WINCOR NIXDORF DE 1,290 ROYAL BAM GROUP NL 867 LASSILA & TIKANOJA FI 551 EUROPAC ES 334 BPI PT 2,227 IREN IT 1,259 MOTOR OIL GR 854 EVS BE 543 WESSANEN NL 329 KORIAN-MEDICA FR 2,116 LISI FR 1,256 USG PEOPLE NL 842 IMTECH NL 537 KENDRION NL 329 CREDEM IT 2,091 DRAEGERWERK DE 1,238 TIKKURILA FI 835 MLP DE 529 INTERVEST OFFICES & WAREHOUSES BE 328 ALMIRALL ES 2,037 HHLA DE 1,226 SANOMA FI 828 ENCE ES 527 JOYOU AG DE 307 PT 1,219 FAIVELEY FR 804 REPLY IT 526 INTRALOT GR 294 NEOPOST FR 2,004 SEMAPA AAREAL BANK DE 1,997 ALTEN FR 1,178 RAMIRENT FI 791 SAF-HOLLAND DE 522 IMPRESA PT 281 ACEA IT 1,990 CITYCON FI 1,178 DURO FELGUERA ES 790 DATALOGIC IT 508 FOURLIS HOLDINGS GR 242 ARCADIS NL 1,984 CAF ES 1,167 PFEIFFER VACUUM DE 785 AEDIFICA BE 504 NEDAP NL 214 DEUTSCHE EUROSHOP DE 1,947 TOMTOM NL 1,160 LUXEMPART LU 776 PKC GROUP FI 504 GAS PLUS IT 214 SIAS IT 1,928 IMA IT 1,158 STALLERGENES FR 755 TREVI IT 501 ATRIA FI 198 ASM INTERNATIONAL NL 1,917 COMDIRECT DE 1,156 GEOX IT 729 CARBURES EUROPE SA ES 501 PSI DE 193 KBC ANCORA BE 1,905 BENI STABILI IT 1,149 KINEPOLIS BE 728 FAES FARMA ES 498 HKSCAN FI 188 CFE BE 1,888 BRUNEL NL 1,135 STOCKMANN FI 728 HELLENIC EXCHANGES GR 497 ORDINA NL 174 VILMORIN FR 1,841 AIXTRON DE 1,134 RCS MEDIAGROUP IT 728 MANITOU FR 494 TI MEDIA IT 153 BREMBO IT 1,826 ASTALDI IT 722 LABORATORIOS ROVI ES 494 152 1,813 1,130 ES DE IT EZENTIS ELRINGKLINGER INDESIT RALLYE FR 1,781 METSA BOARD FI 1,112 CREVAL IT 720 OLVI FI 486 NOVABASE PT 121 BOURBON FR 1,777 GRENKELEASING AG DE 1,111 MAIRE TECNIMONT IT 714 TUBACEX ES 479 CAPMAN FI 90 RHEINMETALL DE 1,775 BIOTEST DE 1,089 BONDUELLE FR 710 TECHNOPOLIS FI 470 ACOTEL IT 72 NEXANS FR 1,756 LDC FR 1,084 JENOPTIK DE 709 ALTRI PT 467 EXPRIVIA IT 42 M6-METROPOLE TELEVISION FR 1,746 CTT PT 1,070 TESSENDERLO BE 703 RETAIL ESTATES BE 461 AB-BIOTICS ES 25 SALZGITTER DE 1,741 EI TOWERS IT 1,067 VASTNED RETAIL NL 698 SOGEFI IT 460 LEONI DE 1,739 INTERPUMP IT 1,066 INTERPARFUMS FR 689 BASWARE FI 445 MELIA HOTELS INTERNATIONAL ES 1,699 BOURSORAMA FR 1,054 BARCO BE 670 BESI NL 441 1,658 SPONDA FI 1,050 LOTUS BAKERIES BE 667 SURTECO DE 440 IT 1,039 CRAMO FI 656 RIB SOFTWARE DE 431 1,025 RAISIO FI 654 VAISALA FI 426 SALINI IMPREGILO IT ITALCEMENTI IT 1,640 SORIN DIASORIN IT 1,620 UPONOR FI DANIELI IT 1,609 BENETEAU FR 995 EXACT HOLDING NV NL 640 IGD IT 413 NH HOTEL GROUP ES 1,513 AMPLIFON IT 993 BINCKBANK NL 628 ACOMO NL 411 GERRESHEIMER AG DE 1,505 PIAGGIO IT 973 SAFT FR 628 HES BEHEER NL 399 TKH GROUP NL 973 SIEGFRIED HOLDING AG CH 621 LEASINVEST REAL ESTATE BE 394 15 Netherlands SMALL & MID CAPS SELECTION EUR 23.66 Buy AALBERTS AALB.AS/AALB NA Market capitalisation: EUR 2628m General Industrials EUR Sales (m) EBITDA (m) EBITDA margin EBIT (m) EBIT margin Net profit (reported) (m) Net profit (adj.) (m) Cash Flow from Ops.bef. chg in NWC (m) Net debt (Cash) (m) Net Debt/Equity Net Debt/EBITDA Interest cover (EBITDA/Fin. interest) ROCE (adj.) ROCE (adj.)/WACC EV / CE EV / Sales EV / EBITDA EV / EBIT P/E (adj.) P/BV OpFCF yield Dividend yield EPS (adj.) EPS (adj.) growth BVPS DPS Abs. Performances(12m,6m,3m,1m): 12 month High/low: EUR25.79 / 16.50 12/12 2,025 296 14.6% 202 10.0% 135 152 227 542 0.6 1.8 14.4 8.7% 1.0 1.4 1.1 7.7 11.4 11.3 1.8 5.8% 2.2% 1.39 3.1% 8.86 0.35 30.8% 12/13 12/14e 12/15e 2,040 2,150 2,325 305 326 372 14.9% 15.2% 16.0% 207 226 270 10.2% 10.5% 11.6% 134 161 201 152 178 219 223 262 305 480 340 152 0.5 0.3 0.1 1.6 1.0 0.4 19.2 27.4 54.0 8.7% 9.5% 11.3% 1.0 1.1 1.9 1.8 1.7 1.5 1.4 1.2 10.2 9.3 7.7 15.0 13.5 10.6 16.8 14.7 12.0 2.5 2.2 1.9 3.9% 6.2% 7.7% 1.7% 2.0% 2.5% 1.38 1.61 1.97 -0.9% 16.5% 22.4% 9.42 10.74 12.35 0.41 0.48 0.59 6.7% -0.5% -3.2% Avg. Daily nb traded shares:195,689 Profile: Aalberts Industries is an international group of companies active in the fine metalwork and plumbing materials industry organized in two groups. 1 Industrial services offers specialised high end technologies for the production of complex customer specific precision products and advanced material treatment technologies through a European network of service centers. 2 Flow Control offers a wide range of plumbing materials for water, gas and heating systems and dispensing systems for soft drinks and beers The company has grown in 20 years from a company that was active in industrial products with 6 locations and EUR 22m turnover into a international group of more than 150 companies with EUR 2bn turnover offering a wide range of products and services. SWOT Analysis Strengths • • Integrated network Weaknesses • • Short lead times • • Entrepreneurial, delegated set-up • • Distributed working capital may lessen group control • Full branded Flow Control catalogue Opportunities • • Modularisation and branding of building installations Threats • • Geographical stretch as clients move on • • Networked outsourcing of high-end manufacturing • • Geo-political influence on raw material availability • • Upstream oil & gas installations • • Talent scarcity in Germany Main shareholders: Free float 60.0%; Aalberts family 13.0%; FMR 10.0%; Ameriprise 5.0%; Oppenheimer 5.0%; Norges Bank 4.0%; Cantillon 3.0%; All share prices at 19/05/14. FINANCIAL CALENDAR (Source: Precise) PRICE (SHORT & LONG AVERAGE) Recommendation: Aalberts seems positioned for operating profit growth, even when markets remain sluggish. New initiatives in the area of for instance cross selling, new product development and key account management are starting to bear fruit. Recovering top line momentum and restrained capex will trigger significant operational leverage in ROCE. 10x EV/EBITDA is a modest valuation for Aalberts’ quality portfolio and built-in sustainable profitability. Target Price: EUR 26.50 titre 26 14/08/14 Results 24 2014H1 22 AALBERTS SMALL & MID CAPS SELECTION Analyst(s) 20 18 16 14 Gert Steens 12 10 Mar 11 Source : Factset 16 Jun 11 Sep 11 Dec 11 Mar 12 Jun 12 Sep 12 Dec 12 Mar 13 Jun 13 Sep 13 Dec 13 Mar 14 Jun 14 +312 0 5508639 SNS Securities [email protected] Germany SMALL & MID CAPS SELECTION EUR 33.37 Accumulate AAREAL BANK ARLG.DE/ARL GY Market capitalisation: EUR 1997m Banks EUR 12/12 12/13 12/14e 12/15e Total Revenue (m) 639 686 809 852 Pre-Provision Profit (PPP) (m) 281 311 369 399 Loan Impairment Charge (m) -106 -113 -130 -130 Operating profit (OP) (m) 175 198 239 269 Earnings before tax (m) 176 198 389 269 Net profit (reported) (m) 85.0 93.0 269 140 Net profit (adj.) (m) 84.3 93.0 119 140 Shareholders equity (m) 2,109 2,208 2,433 2,498 Tier 1 Ratio 16.7% 19.5% 17.3% 17.1% Cost/Income ratio 56.0% 54.7% 54.4% 53.2% ROE (adj.) 5.1% 5.2% 6.1% 6.6% NPL ratio (gross) 3.5% 3.6% 3.9% 3.5% NPL coverage 38.5% 41.9% 34.8% 34.8% LIC/Avg. RWA 0.7% 0.8% 0.9% 0.8% P/Pre-Provision Profit per Share 3.3 5.5 5.4 5.0 P/E (adj.) 11.2 18.5 16.7 14.2 P/BV 0.4 0.8 0.8 0.8 P/NAV 0.5 0.9 1.0 0.9 Dividend yield 0.0% 2.2% 3.7% 4.5% PPPPS 4.69 5.20 6.16 6.66 EPS (adj.) 1.41 1.55 2.00 2.34 EPS (adj.) growth -17.7% 10.3% 28.5% 17.4% BVPS 30.22 31.88 35.63 36.72 NAVPS 29.32 30.77 34.73 35.82 DPS 0.00 0.75 1.25 1.50 Abs. Performances(12m,6m,3m,1m): 76.3% 24.8% 13.5% 4.6% 12 month High/low: EUR34.22 / 17.50 Avg. Daily nb traded shares:291,808,000 Main shareholders: Free float 71.0% (0.0%); Verwaltungsgesellschaft 29.0%; Profile: Aareal Bank focuses on commercial real estate financing and software/consulting services for commercial real estate clients. Aareal Bank was one of the first German mortgage banks that expanded internationally and has thus one of the most diversified international portfolios with an international proportion of almost 90%. ARL is among the best capitalized Euro banks with a fully loaded Basel III CT 1 ratio of 13.4% (Q4 2013). End of last year ARL announced the takeover of Corealcredit which is not strategically but purely financially driven. In addition to its real estate financing activities Aareal Bank offers various real estate related services like software development for the housing sector. Aareon, its most important subsidiary, is an international consultant and system integrator and offers its services to professional customers in the real estate sector. Currently some 8m dwellings and commercial units are managed by almost 50,000 users at c. 2,000 clients using Aareon systems. For 2014 we expect EBT to almost double yoy to EUR 389m due to the badwill of EUR 150m resulting from the Corealcredit takeover. SWOT Analysis Strengths • Solid capitalization Weaknesses • Relatively dependent on wholesale funding • Good asset quality • High exposure to commercial real estate markets • Strong management track record Opportunities • Extra dividend Threats • Euro crisis comes back • Portfolio growth higher than expected • Market environment deteriorates again All share prices at 19/05/14. FINANCIAL CALENDAR (Source: Precise) PRICE (SHORT & LONG AVERAGE) Recommendation: We recommend Accumulating the shares with a target price of EUR 36.00. ARL is on its way to become a dividend stock as we expect ARL to significantly increase its payout ratio in the coming years; an extra dividend for 2015 is quite likely in our view as ARL needs to actively manage its capital if it want to reach its 12% pretax ROE target. titre 35 30 25 22/05/14 Dividend Payment 2013 22/05/14 Ex Dividend Date 2013 21/05/14 AGM 2013 20 15 10 5 Mar 11 Target Price: EUR 36.00 AAREAL BANK SMALL & MID CAPS SELECTION Analyst(s) Philipp Häßler, CFA Jun 11 Sep 11 Dec 11 Mar 12 Jun 12 Sep 12 Dec 12 Mar 13 Jun 13 Sep 13 Dec 13 Mar 14 +49 69 58997 414 Equinet Bank [email protected] Jun 14 Source : Factset 17 Spain SMALL & MID CAPS SELECTION EUR 2.62 Hold AB-BIOTICS ABBO.MC/ABB SM Market capitalisation: EUR 25m Healthcare EUR Sales (m) EBITDA (m) EBITDA margin EBIT (m) EBIT margin Net profit (reported) (m) Net profit (adj.) (m) Cash Flow from Ops.bef. chg in NWC (m) Net debt (Cash) (m) Net Debt/Equity Net Debt/EBITDA Interest cover (EBITDA/Fin. interest) ROCE (adj.) ROCE (adj.)/WACC EV / CE EV / Sales EV / EBITDA EV / EBIT P/E (adj.) P/BV OpFCF yield Dividend yield EPS (adj.) EPS (adj.) growth BVPS DPS Abs. Performances(12m,6m,3m,1m): 12 month High/low: EUR3.80 / 1.33 12/12 3.1 -2.0 nm -2.6 nm -1.8 -1.7 -2.0 -0.8 -0.1 0.4 nm 0.0% 0.0 2.6 4.3 nm nm nm 1.8 -29.3% 0.0% -0.18 -chg 1.20 0.00 63.8% 12/13 2.2 -1.4 nm -2.2 nm -1.8 -1.8 -1.3 1.1 0.1 -0.8 nm 46.2% 3.2 3.4 7.5 nm nm nm 2.2 -15.3% 0.0% -0.19 -chg 1.04 0.00 54.1% 12/14e 12/15e 4.1 5.5 -0.7 0.4 nm 7.4% -1.3 -0.2 nm nm -0.9 -0.3 -0.9 -0.3 -0.9 -0.1 3.2 3.4 0.4 0.4 -4.6 8.3 nm 2.1 44.2% 5.6% 3.2 0.4 3.7 3.8 5.4 4.0 nm 54.9 nm nm nm nm 2.8 2.9 -7.6% 0.2% 0.0% 0.0% -0.10 -0.03 +chg +chg 0.94 0.91 0.00 0.00 -6.4% -14.1% Avg. Daily nb traded shares:0,000 Profile AB-BIOTICS is advancing in its growth based on strategic agreements to leverage its two business areas: Functional Ingredients (probiotics) and personalised medicine (Genotyping). Positioned in growing markets: functional ingredients market, particularly the segment of probiotics (which has been showing double-digit growth over the last decade) and the personalised medicine market (by marketing different types of Neurofarmagen). Following the agreement reached at the end of last year with the Danish company, DuPont Nutrition & Health, to market AB-Life, we expect the company to announce new agreements for probiotics soon. SWOT Analysis Strengths • Management flexibility and limited investment due to a new outlicensed model strategy • Proven innovation capabilities Weaknesses • Small size & short experience • Relevant partners in the main divisions (GlaxoSmithkline, Almiral & Dupont) • Market illiquidity Opportunities • Sustained growth of the probiotics market Threats • Potential loss of market exclusivity and future revenues due to an inadequate patent protection policy • Short term funding needs for the execution of its business plan • Shareholder dilution • Positioned in the personalized medicine segmen • Additional alliances within the pharmaceutical & food industries • Economies of scale in AB-Genotyping and AB-Functional Ingredients • Slow market penetration • Entry of new competitors with greater resources Main shareholders: Free float 41.7%; Founders & Advisors 41.4%; Employees 11.7%; Almirall 5.1%; Recommendation: We value the company via the sum of the parts method in EUR3.80/sh. The out-license agreements with strategic partners for the probiotics business line (DuPont) improves the visibility of this division. We expect the announcement of a new strategic partnership in the functional ingredients division in order to back the company’s strategy. All share prices at 19/05/14. FINANCIAL CALENDAR (Source: Precise) PRICE (SHORT & LONG AVERAGE) Target Price: EUR 3.80 titre 4.0 3.5 3.0 AB-BIOTICS SMALL & MID CAPS SELECTION Analyst(s) 2.5 2.0 Ana Isabel González García CIIA 1.5 1.0 Mar 11 Source : Factset 18 Jun 11 Sep 11 Dec 11 Mar 12 Jun 12 Sep 12 Dec 12 Mar 13 Jun 13 Sep 13 Dec 13 Mar 14 Jun 14 +34 91 436 78 09 BEKA Finance [email protected] Netherlands SMALL & MID CAPS SELECTION EUR 13.76 Reduce ACCELL GROUP ACCG.AS/ACCEL NA Market capitalisation: EUR 359m General Industrials EUR Sales (m) EBITDA (m) EBITDA margin EBIT (m) EBIT margin Net profit (reported) (m) Net profit (adj.) (m) Cash Flow from Ops.bef. chg in NWC (m) Net debt (Cash) (m) Net Debt/Equity Net Debt/EBITDA Interest cover (EBITDA/Fin. interest) ROCE (adj.) ROCE (adj.)/WACC EV / CE EV / Sales EV / EBITDA EV / EBIT P/E (adj.) P/BV OpFCF yield Dividend yield EPS (adj.) EPS (adj.) growth BVPS DPS Abs. Performances(12m,6m,3m,1m): 12 month High/low: EUR15.02 / 11.80 12/12 773 40.8 5.3% 32.5 4.2% 23.1 23.1 33.9 153 0.6 3.7 5.8 5.9% 0.7 1.4 0.7 13.8 17.3 13.9 1.3 12.3% 5.6% 0.96 -36.2% 10.39 0.75 -1.1% 12/13 12/14e 12/15e 849 885 913 45.6 52.2 56.4 5.4% 5.9% 6.2% 36.9 44.3 48.2 4.3% 5.0% 5.3% 19.0 28.5 31.8 22.4 29.1 32.4 33.8 31.5 39.4 193 181 156 0.8 0.7 0.6 4.2 3.5 2.8 3.9 5.1 6.1 6.5% 7.6% 8.3% 0.7 1.4 1.2 1.2 0.7 0.6 0.6 13.3 10.3 9.5 16.4 12.2 11.1 14.7 12.3 11.7 1.4 1.4 1.4 -7.8% -1.1% 8.1% 4.0% 4.4% 4.7% 0.91 1.11 1.18 -5.0% 22.0% 5.5% 9.84 9.56 9.97 0.55 0.60 0.65 -3.1% -3.0% -4.4% Avg. Daily nb traded shares:11,345 Main shareholders: Free float 70.5%; Darlin 7.0%; Delta Lloyd 6.6%; Profile: Accell designs, assembles and markets bicycles, bicycle parts and fitness equipment. Its products sell under mostly national brands. Accell distributes only to specialist retailers, forgoing the lower-end markets supplied by general stores and hypermarkets. The largest supplier of bicycles in Europe, Accell is the market leader in the Netherlands and has a top-three position in Germany. Bicycles represent 74% of group sales, of which an estimated half in the Netherlands and Germany. In the spring of 2012, Accell is acquired Raleigh Cycle, which adds significant shares in the US and the UK. Bicycle parts and accessories generate a quarter of group sales, fitness equipment 3%. The company’s business model hinges on the local positioning of its brands through design and marketing, and efficient distribution. Apart from engineering improvements and design updates, top line performance is driven by the uptake of electric bikes. The group has limited owned manufacturing capacity and procures most parts in Japan, China and Taiwan. Capital intensity is concentrated in working capital much more than in fixed assets. SWOT Analysis Strengths • Local positions in mid- and high-end bicycle markets, leading specialist distribution networks • Efficient design-assemble-market-distribute business model • Scale that allows in-house development for electric bicycles Weaknesses • Dependency on Shimano and Bosch for crucial drive-train parts • Large exposure to mature markets Opportunities • Expansion of bicycle parts distribution Threats • Working capital is moving upstream from dealers to assemblers • New (electric) technology may shake up competitive landscape • International expansion through acquisition of local-forlocal distributors • High-end bicycles and electric bikes are gaining share in mature markets ASR 5.8%; JH Langendoen 5.1%; De Engh 5.1%; Fidelity 5.0%; All share prices at 19/05/14. FINANCIAL CALENDAR (Source: Precise) PRICE (SHORT & LONG AVERAGE) titre 21 22/05/14 Dividend Payment 20 2013 Recommendation: With the revenue mix improving through electric bicycles with a higher selling price, Accell has attempted to offset the lack of volume growth and rising capital intensity. Exposure to mature Dutch and German bicycle markets is counterbalanced by the rising importance of the bicycle parts business. Margins that result from positioning and distribution, on a light asset base, should provide decent cash flows from current operations, were it not for a high working capital intensity. 10x EV/EBITA for the current year appears excessive in the light of business model issues, slow growth and high debt. 19 Target Price: EUR 11.00 18 17 16 15 14 Analyst(s) 13 12 11 Mar 11 Jun 11 Sep 11 Dec 11 Mar 12 Jun 12 Sep 12 Dec 12 Mar 13 Jun 13 Sep 13 Dec 13 Mar 14 Jun 14 Gert Steens SNS Securities +312 0 5508639 [email protected] Source : Factset 19 Italy SMALL & MID CAPS SELECTION EUR 9.35 Accumulate ACEA ACE.MI/ACE IM Market capitalisation: EUR 1990m Utilities EUR Sales (m) EBITDA (m) EBITDA margin EBIT (m) EBIT margin Net profit (reported) (m) Net profit (adj.) (m) Cash Flow from Ops.bef. chg in NWC (m) Net debt (Cash) (m) Net Debt/Equity Net Debt/EBITDA Interest cover (EBITDA/Fin. interest) ROCE (adj.) ROCE (adj.)/WACC EV / CE EV / Sales EV / EBITDA EV / EBIT P/E (adj.) P/BV OpFCF yield Dividend yield EPS (adj.) EPS (adj.) growth BVPS DPS Abs. Performances(12m,6m,3m,1m): 12 month High/low: EUR10.96 / 5.55 12/12 3,613 695 19.2% 294 8.1% 77.4 77.4 487 2,495 1.9 3.6 5.8 6.9% 1.0 0.8 1.0 5.1 12.1 12.5 0.8 -13.1% 6.6% 0.36 -10.0% 5.89 0.30 70.7% 12/13 12/14e 12/15e 3,571 3,529 3,535 766 792 812 21.5% 22.4% 23.0% 384 384 396 10.7% 10.9% 11.2% 182 136 143 182 136 143 576 555 570 2,468 2,485 2,465 1.8 1.7 1.6 3.2 3.1 3.0 13.4 7.1 7.3 8.8% 8.7% 8.9% 1.3 1.2 1.3 1.0 1.0 1.0 1.2 1.3 1.3 5.7 5.8 5.7 11.4 12.0 11.6 12.4 14.6 13.9 1.3 1.5 1.4 10.1% 3.2% 5.7% 4.5% 4.5% 4.7% 0.67 0.64 0.67 83.5% -3.9% 4.7% 6.22 6.44 6.69 0.42 0.42 0.44 12.9% 1.4% -12.3% Avg. Daily nb traded shares:120,408 Main shareholders: Rome Council 51.0%; Free Float 24.2%; Francesco Gaetano Caltagirone 14.8%; GdF-Suez 10.0%; All share prices at 19/05/14. FINANCIAL CALENDAR (Source: Precise) PRICE (SHORT & LONG AVERAGE) titre 11 29/07/14 Results 10 2014H1 9 8 23/06/14 Ex Dividend Date 2013 26/05/14 Dividend Payment 2013 7 6 Profile: the company is involved in the management of water, environmental and energy services: integrated water service management, the disposal and creation of energy from waste, the production, sale and distribution of energy, the development of renewable sources, public and artistic lighting. Acea features a balanced portfolio of mainly regulated businesses: around 80% of the group’s margins are generated by these activities, with little exposure to the energy sector. SWOT Analysis Strengths • Solid position in Central Italy Weaknesses • Very high exposure on the uncertain water business. • Business structure that is giving a competitive advantage in comparison to its peers (short in generation and on takegas contracts) •or-pay Network leadership in the reference areas • The Rome city council approved to dispose of 21% in Acea, fuelling an overhang risk Opportunities • The plant revamping should boost margins in the coming years • Great room for efficiencies Threats • Execution risk of current projects and efficiency achievements • A sharp increase in interest rates, which may reduce the appeal of the whole utilities sector • Changes in the regulatory framework • Photovoltaic sale should help debt reduction programme Recommendation: the company has recently showed its 2014-2018 business plan, which is mainly focused on the regulated activities, which generate around 80% of the company’s current EBITDA; the operative and organizational efficiencies and the financial structure improvement. In particular, the company’s business plan is aimed at: a) boosting earnings across all the business areas, with particular focus on the regulated businesses that contribute for ca. 80% of consolidated EBITDA; b) selectively developing the businesses through careful management of capex; c) developing operating and organisational efficiencies; d) improving the quality of the services offered to customers through the expansion of communication channels, technological innovation and new billing processes; e) containing and reducing working capital; f) maintaining a solid and competitive financial structure. Based on the aforementioned guidelines, the company’s 2014-2018 business plan points to the following targets: Capex EUR 2.4bn related to the need to modernise grids and plants and improve the profitability; EBITDA CAGR of 5.2%; Pre-tax ROIC in 2018 at 12.5%; Net invested capital in 2018 at EUR 4,238m. On a divisional basis, Acea is pointing to the following targets: Water. The company is pointing to consolidate its leadership in the Italian water market and to invest in modernisation of the network and in improving water treatment. EBITDA CAGR: +5.3%; Networks. Acea is committed to develop energy efficiency projects and to exploit new technologies. EBITDA CAGR: +1.1%; Energy. In this segment, Acea is one of the leading energy retailers in Italy with around 13 TWh of electricity sold. EBITDA CAGR: 5.0%. The main focus is to improve the quality of the services provided and the customer relationship; Waste. The goal is to boost Acea’s position to number 3 (it is 5th now) in the Italian market by volume of waste treated by 2018, producing around 600 GWh from WTE per year. 2013-2018 EBITDA CAGR: 16.0%. In this area, the growth strategy will focus on: a) upgrading energy recovery plant facilities; b) consolidating Acea’s position by upgrading/building new plants; c) M&A opportunistic approach in other regions in central and northern Italy. We confirm our positive stance on ACEA given the high potential of the company’s portfolio. 5 Target Price: EUR 12.30 4 3 Mar 11 Source : Factset Jun 11 Sep 11 Dec 11 Mar 12 Jun 12 Sep 12 Dec 12 Mar 13 Jun 13 Sep 13 Dec 13 Mar 14 Jun 14 Analyst(s) Dario Michi 20 Banca Akros +39 02 4344 4237 [email protected] Netherlands SMALL & MID CAPS SELECTION EUR 17.48 Hold ACOMO ARBN.AS/ACOMO NA Market capitalisation: EUR 411m Food & Beverage EUR Sales (m) EBITDA (m) EBITDA margin EBIT (m) EBIT margin Net profit (reported) (m) Net profit (adj.) (m) Cash Flow from Ops.bef. chg in NWC (m) Net debt (Cash) (m) Net Debt/Equity Net Debt/EBITDA Interest cover (EBITDA/Fin. interest) ROCE (adj.) ROCE (adj.)/WACC EV / CE EV / Sales EV / EBITDA EV / EBIT P/E (adj.) P/BV OpFCF yield Dividend yield EPS (adj.) EPS (adj.) growth BVPS DPS Abs. Performances(12m,6m,3m,1m): 12 month High/low: EUR18.10 / 13.90 12/12 593 43.9 7.4% 41.1 6.9% 27.0 27.0 29.1 76.0 0.6 1.7 15.9 13.8% 2.0 1.9 0.7 9.1 9.7 12.0 2.7 11.8% 5.0% 1.16 0.5% 5.25 0.70 13.8% 12/13 584 43.7 7.5% 40.2 6.9% 27.4 27.4 31.7 76.5 0.6 1.8 17.2 13.3% 1.9 2.1 0.8 10.6 11.5 14.1 3.0 3.1% 4.4% 1.17 1.0% 5.61 0.77 5.7% 12/14e 12/15e 596 614 48.0 49.0 8.0% 8.0% 44.5 45.5 7.5% 7.4% 29.4 30.1 29.4 30.1 32.9 33.5 68.2 60.7 0.5 0.4 1.4 1.2 19.5 18.9 14.0% 14.1% 2.0 2.0 2.2 2.1 0.8 0.8 10.0 9.6 10.8 10.4 14.0 13.7 2.9 2.7 6.4% 6.5% 4.7% 4.7% 1.25 1.28 6.5% 2.1% 6.04 6.49 0.81 0.83 3.4% -1.5% Avg. Daily nb traded shares:9,571 Main shareholders: Free float 51.9%; Mont Cervin 15.8%; Red Wood Trust 10.7%; Jan Plas 5.9%; Todlin 5.5%; Westerduin 5.2%; Mawer 5.0%; All share prices at 19/05/14. FINANCIAL CALENDAR (Source: Precise) PRICE (SHORT & LONG AVERAGE) t i t re 19 19/05/14 Dividend Payment 18 2013 Profile: Amsterdam Commodities (Acomo) is a Netherlands-based group of companies operating internationally in the trade and distribution of agricultural niche products. It is a trading house in spices, nuts, dried fruits, tea and sunflower seeds and distributes a wide array of ingredients for the food industry. SWOT Analysis Strengths • Diversified products portfolio reduces risk profile Weaknesses • Limited free cash flow after dividend payment • Relatively stable operating performance • Limited synergy potential from acquisitions • Reputation for meeting contract terms • Loyalty and expertise of traders Opportunities • Acquisitions add to EPS Threats • Political risks as most sourcing is in emerging markets • Leverage limited market transparency of niche products • Prolonged period of low prices and low volatility • Benefit from commodity price volatility • Management control challenge at head office when more subsidiaries are added • Competition from local companies in originating countries • More focus on sustainability Recommendation: We rate Acomo shares Hold with a target price of EUR 17.50. Our recommendation is based on 1) Acomo’s solid track record based on contacts in origin countries, market intelligence and a loyal client base. The company has proved its value as an inventory holder in times of scarcity and volatile commodity prices. Earnings per share have grown strongly in the past 6 years. 2) The group is actively looking for expansion through M&A, which has been a key share price trigger in recent years. Acomo has paid relatively low multiples for acquisitions. Acomo aims to move into a new niche of €200m sales. 3) The new CEO Erik Rietkerk also plans to focus more strongly on more activities in the existing chains like in the sunflower seeds at this moment. 4) The new CEO has a focus on sustainability, which is a key growth segment for its main clients. 5) We forecast limited EPS growth going forward although the sustainability approach might give some acceleration through market share gains. Our EUR 17.5 target price is based on a base scenario (DCF calculation), and does not incorporate acquisitions. 17 Target Price: EUR 17.50 16 15 14 13 12 Analyst(s) 11 10 9 Mar 11 Jun 11 Sep 11 Dec 11 Mar 12 Jun 12 Sep 12 Dec 12 Mar 13 Jun 13 Sep 13 Dec 13 Mar 14 Jun 14 Gerard Rijk SNS Securities + 31 (0)20 550 8572 [email protected] Source : Factset 21 Italy SMALL & MID CAPS SELECTION EUR 17.38 Hold ACOTEL ACO.MI/ACO IM Market capitalisation: EUR 72m Telecommunications EUR Sales (m) EBITDA (m) EBITDA margin EBIT (m) EBIT margin Net profit (reported) (m) Net profit (adj.) (m) Cash Flow from Ops.bef. chg in NWC (m) Net debt (Cash) (m) Net Debt/Equity Net Debt/EBITDA Interest cover (EBITDA/Fin. interest) ROCE (adj.) ROCE (adj.)/WACC EV / CE EV / Sales EV / EBITDA EV / EBIT P/E (adj.) P/BV OpFCF yield Dividend yield EPS (adj.) EPS (adj.) growth BVPS DPS Abs. Performances(12m,6m,3m,1m): 12 month High/low: EUR25.35 / 16.85 12/12 101 1.1 1.1% -3.2 nm -5.5 -1.5 -1.1 -29.6 -0.5 -25.9 nm -10.3% -1.2 2.1 0.6 57.6 nm nm 1.6 -4.0% 0.0% -0.35 -chg 14.36 0.00 -12.9% 12/13 121 -2.3 nm -6.8 nm -8.9 -3.6 -4.2 -18.2 -0.4 7.8 6.0 -24.2% -2.8 2.2 0.5 nm nm nm 1.8 -13.0% 0.0% -0.86 -chg 10.87 0.00 -24.7% 12/14e 12/15e 142 146 4.6 8.0 3.2% 5.5% 0.3 3.8 0.2% 2.6% -0.8 2.1 0.2 2.4 3.8 6.5 -20.1 -22.8 -0.4 -0.5 -4.4 -2.8 nm nm 1.2% 14.8% 0.1 1.7 2.0 1.9 0.4 0.3 11.3 6.1 nm 12.9 nm 29.7 1.6 1.6 2.5% 3.8% 0.0% 0.0% 0.06 0.58 +chg nm 10.69 11.19 0.00 0.00 -21.1% -15.6% Avg. Daily nb traded shares:2,720 Main shareholders: Clama 41.4%; Free float 37.2%; Claudio Carnevale 16.6%; Intesa Sanpaolo 4.8%; All share prices at 19/05/14. FINANCIAL CALENDAR (Source: Precise) PRICE (SHORT & LONG AVERAGE) titre 40 Profile: ACO is an Italian-based multinational operating in the information and communications technology (ITC) industry. ACO operates in three business segments: Interactive (77% group sales in 2013), TLC (22% sales) and NET (1% sales). The interactive division includes the traditional B2C services “digital entertainment” provided through proprietary brands, “white label” services to mobile Cos and media and interactive advertising. The TLC division includes a) Mobile VAS Technology (Jinny Software) for mobile operators; b) Mobile Comms – mobile tlc services for end users provided by Noverca Italia Srl, and SMS information for corporate customers; c) Mobile Virtual Network Enabler; d) MVN Aggregator. The NET division represents the potential growth engine, leveraging on the booming markets of M2M, “internet of things”. The actual business of the unit is however still limited to the legacy activities, ie security and tele-surveillance. The traditional VAS business is migrating to a new internet model, and ACO is reengineering its B2C and B2B activities, is revamping its tlc operations, and launching new business in the M2M space. FY 2013 results. Q4 results were characterized by similar trends of the previous quarters, namely double-digit revenue growth and negative EBITDA. On the positive, net cash slightly improved in the past three months, to EUR 18.2m; however cash burn was above EUR 11m in the full year. The top-line was driven by the TLC division, which in turn reflects the full consolidation of Noverca. The interactive BU kept growing although at a slower pace than in 9m. The activities of the NET division are not generating meaningful revenues yet. The EBITDA was still at a small loss in Q4; on the full year, the performance reflects the consolidation of 100% losses of Noverca; the higher advertising expenses of Interactive (EUR 19.3m) and the costs to prepare the commercial offer of Acotel NET. Outlook 2014: The company said in a note that: a) Acotel Interactive: Margins will benefit from the actions taken in the previous year in new services, new geographies. b) Acotel TLC. Jinny software should provide good results, taking into account the positive market response to the new products presented at the MWC. The prospects for the telephone company, Nòverca, in 2014 are difficult to predict as “there is a clear need to find a partner capable of obtaining adequate synergies with its core business in order to drive the commercial roll out and achieve a return on the initiative”. c) Acotel NET. ACO expects "to enter into agreements with major commercial partners to proceed with the large-scale launch of operations”. The success of the latter initiatives and fixing the TLC business can deeply change the P&L of the Co. SWOT Analysis Strengths • Proprietary technological platform • Established relationship with operators • Financial independence Opportunities • New geographies • New approach to interactive services • The “Internet of things Weaknesses • Limited size • Poor track record • Limited financial communication Threats • Mobile VAS regulation • Changing Usage Profile • Changing Operators’ priorities Recommendation: HOLD. We warn of a very uncertain S/T outlook; the perspectives of all the three divisions seem to be very volatile. We suggest investors wait for more convincing evidence on new activities. Target Price: EUR 20.00 35 30 ACOTEL SMALL & MID CAPS SELECTION Analyst(s) 25 20 15 Mar 11 Source : Factset 22 Jun 11 Sep 11 Dec 11 Mar 12 Jun 12 Sep 12 Dec 12 Mar 13 Jun 13 Sep 13 Dec 13 Mar 14 Jun 14 Andrea Devita, CFA +39 02 4344 4031 Banca Akros [email protected] Belgium SMALL & MID CAPS SELECTION EUR 51.00 Hold AEDIFICA AOO.BR/AED BB Market capitalisation: EUR 504m Real Estate EUR 06/12 34 26 76.1% 9 (20) 15 15 15.32 294 597 642 2.14 1.86 37.29 30.1% 42.23 4.4% 3.8% 24.6 23 1.3 294 48.3% 0.5% 06/14e 06/15e 40 44 EBITDA (m) 31 34 EBITDA margin 77.3% 78.2% Portfolio Result (m) 7 11 Net Financial Result (10) (12) Net Profit (reported)(m) 28 33 Net Profit (adj.)(m) 20 22 Funds From Operations 19.74 22.44 Net Debt (m) 330 360 Portfolio Value (m) 761 806 Enterprise Value (m) 834 864 EPS (adj.) 2.00 2.27 DPS 1.89 1.98 IFRS NAVPS 39.83 41.29 Premium/(discount) 28.0% 23.5% EPRA NAVPS 41.91 41.91 Earnings adj. yield 3.9% 4.4% Dividend yield 3.7% 3.9% EV/EBITDA 27.0 25.3 P/E (adj.) 26 22 Int. cover(EBITDA/Fin.int) 3.3 2.9 Net debt/(cash) (m) 330 360 Net Debt/Total Assets 43.0% 44.3% Abs. Performances(12m,6m,3m,1m): -0.4% 2.0% 12 month High/low: EUR52.95 / 46.77 Avg. Daily nb traded shares:5,868 Main shareholders: Free float 88.2% (88.1%); Jubeal Fondation 6.4%; Wulfsdonck Invest. (via Finasucre) 5.5%; Gross Rental Income (m) 06/13 36 27 75.9% 9 (9) 28 17 17.00 226 647 696 1.95 1.86 38.63 22.9% 42.07 3.8% 3.6% 25.4 24 3.1 226 34.7% 0.4% All share prices at 19/05/14. FINANCIAL CALENDAR (Source: Precise) PRICE (SHORT & LONG AVERAGE) titre 54 52 50 48 46 44 Profile: Aedifica is a Belgian REIT whose strategy is driven by the ageing of the population and the return to city centers. Real estate portfolio of EUR 739m on top of a development pipeline of EUR 129m: 48 Belgian senior houses (67% of EBIT), 864 apartments (21% of EBIT) of which 281 furnished ones and 6 hotels with 521 rooms (12% of EBIT). Considering a huge wave of acquisitions and commitments since the capital increase of EUR 100m in December 2012, the debt ratio has climbed from 33% to 44.7% at the issue of March 2014. In the middle of 2013, Aedifica made its first step in the rest home sector in Germany. Today its German portfolio is made of five rest homes for a total value of EUR 36m. Aedifica has very ambitious objectives in Germany (EUR 200m at long term). Acquisitions in senior housing in the Netherlands are not planned for the short term. The inclusion of the stock since March 2013 in the “FTSE EPRA/NAREIT Developed Europe Index” had helped to boost its price. SWOT Analysis Strengths • 79% of EBITDA is triple net & inflation linked • Average remaining length of leases is 19 years • Development expertise offers competitive advantage Weaknesses • Limited net property yield offers small margin over average cost of debt • No organic growth potential of rents unless through indexation • Insufficient NOPAT of furnished apartments may lead to impairments if conversion in unfurnished apartments • Conservative valuation of apartments Opportunities • Operational leverage • Ageing of population, privatisation of senior houses and lack of public financing offer growth potential for the few actors •private Start of rotation of unfurnished apartments will make clear that valuation is conservative • 6% rise in Belgium population over next 7 yrs Threats • Regionalisation of taxation may imply a higher tax burden from 2014 onwards • Lasting of low inflation environment implying low indexation of rents • Poor economic environment weighing on occupancy rate of furnished apartments Recommendation: Aedifica is probably the best available inflation hedge in the Belgian REIT universe built on a length of leases of 19 years, of which 79% of the EBIT is indexed (Belgian health index) on a secure contractual basis (triple net). Because of the further weakening in the furnished apartments (occupancy rate of 76.8%) Aedifica is renovating 9% of them while short term rentals will be avoided. The debt is totally hedged. Both the senior houses and the apartments offer good capital gain potential. NAV exclusive IAS39 was EUR41.57 at the end of March 2014. Target Price: EUR 50.00 42 40 38 Mar 11 Source : Factset Jun 11 Sep 11 Dec 11 Mar 12 Jun 12 Sep 12 Dec 12 Mar 13 Jun 13 Sep 13 Dec 13 Mar 14 Jun 14 Analyst(s) Jean-Marie Caucheteux Bank Degroof +32 2 287 99 20 [email protected] 23 Finland SMALL & MID CAPS SELECTION EUR 7.70 Reduce AHLSTROM AHL1V.HE/AHL1V FH Market capitalisation: EUR 359m General Industrials EUR Sales (m) EBITDA (m) EBITDA margin EBIT (m) EBIT margin Net profit (reported) (m) Net profit (adj.) (m) Cash Flow from Ops.bef. chg in NWC (m) Net debt (Cash) (m) Net Debt/Equity Net Debt/EBITDA Interest cover (EBITDA/Fin. interest) ROCE (adj.) ROCE (adj.)/WACC EV / CE EV / Sales EV / EBITDA EV / EBIT P/E (adj.) P/BV OpFCF yield Dividend yield EPS (adj.) EPS (adj.) growth BVPS DPS Abs. Performances(12m,6m,3m,1m): 12 month High/low: EUR12.14 / 7.40 12/12 1,011 68.9 6.8% 16.5 1.6% -21.9 -22.5 58.5 326 0.6 4.7 high 1.5% 0.2 1.0 0.8 12.0 49.9 nm 1.2 27.5% 4.8% -0.48 +chg 11.37 0.63 -34.2% 12/13 12/14e 12/15e 1,015 1,018 1,068 64.6 70.4 94.6 6.4% 6.9% 8.9% 10.7 19.2 43.5 1.1% 1.9% 4.1% -20.5 2.5 17.8 -18.5 11.1 17.8 61.3 68.1 85.5 292 269 275 0.9 0.8 0.8 4.5 3.8 2.9 high high high 1.9% 4.5% 6.2% 0.3 0.6 0.8 0.9 0.9 0.9 0.5 0.4 0.4 7.9 6.5 4.9 47.4 23.8 10.6 nm 32.5 20.2 1.2 1.1 1.1 -53.8% 3.4% 7.4% 3.9% 3.9% 3.9% -0.40 0.24 0.38 +chg +chg 61.1% 7.12 6.87 6.90 0.30 0.30 0.30 -15.7% 2.7% -1.3% Avg. Daily nb traded shares:21,658 Main shareholders: Free float 89.6%; Vimpu Intressenter Ab 10.4%; Antti Ahlström Perilliset Oy 10.0%; Varma Mutual Pension Insurance Co 3.3%; All share prices at 19/05/14. FINANCIAL CALENDAR (Source: Precise) PRICE (SHORT & LONG AVERAGE) Profile: Ahlstrom produces fibre based materials on rolls for industrial purposes. The products are used in many applications, such as filters, medical gowns and drapes, diagnostics, wallcoverings, flooring and food packaging. Ahlstrom is counted among the leading companies in each of its customer segments. Europe accounts over 50% of the company's sales, North America for one quarter and the rest is accounted for by South America, Asia Pacific and rest of the world. SWOT Analysis Strengths • Strong market shares Weaknesses • Heavy dependence on Europe • Global focus • Weak position in the middle of the value chain • Technological expertise • Weak business visibility • Concentrated ownership structure Opportunities • Streamlining of business structure after heavy M&A activity • Growth in Asia Threats • Failure to turn around focus units (Chirnside, Mundra, Longkou) • Volatile raw material prices • Tapping megatrends relating to global resource scarcity, emerging needs in healthcare, and urbanization • Commercialisation of innovations Recommendation: Ahlstrom's growth strategy relying strongly on pioneering products and global mega trends is certainly an appealing story but, in order to gain the market's trust, Ahlstrom needs to demonstrate improvement since the weak profitability history does support the story. Notable non-recurring expenses arising from the rightsizing programme are likely to keep profits and dividends lacklustre this year, which is why we think there is no hurry to buy the share. However, if the company shows it is on track to deliver on its profitability target and if the market begins to price this in during 2015, the share could offer plenty of upside in the medium term, even up to EUR 16 – but we are not convinced of this yet. titre 20 Target Price: EUR 7.20 18 16 AHLSTROM SMALL & MID CAPS SELECTION Analyst(s) 14 12 10 8 6 Mar 11 Source : Factset 24 Jun 11 Sep 11 Dec 11 Mar 12 Jun 12 Sep 12 Dec 12 Mar 13 Jun 13 Sep 13 Dec 13 Mar 14 Jun 14 Niclas Catani +358 10 252 8780 Pohjola [email protected] Germany SMALL & MID CAPS SELECTION EUR 10.16 Sell AIXTRON AIXG.DE/AIXA GR Market capitalisation: EUR 1134m Industrial Engineering EUR Sales (m) EBITDA (m) EBITDA margin EBIT (m) EBIT margin Net profit (reported) (m) Net profit (adj.) (m) Cash Flow from Ops.bef. chg in NWC (m) Net debt (Cash) (m) Net Debt/Equity Net Debt/EBITDA Interest cover (EBITDA/Fin. interest) ROCE (adj.) ROCE (adj.)/WACC EV / CE EV / Sales EV / EBITDA EV / EBIT P/E (adj.) P/BV OpFCF yield Dividend yield EPS (adj.) EPS (adj.) growth BVPS DPS Abs. Performances(12m,6m,3m,1m): 12 month High/low: EUR13.80 / 9.68 12/12 228 -118 nm -132 nm -145 -93.9 -139 -209 -0.4 1.8 50.9 -33.0% -3.4 2.5 3.0 nm nm nm 1.9 -9.5% 0.0% -0.93 -chg 4.66 0.00 -17.2% 12/13 12/14e 12/15e 183 218 287 -77.8 -1.7 26.2 nm nm 9.1% -95.7 -18.0 10.7 nm nm 3.8% -101 -15.2 10.8 -61.9 -15.2 10.8 -78.3 0.3 28.0 -306 -290 -298 -0.7 -0.6 -0.6 3.9 168 -11.4 nm 2.3 nm -33.1% -9.1% 5.3% -3.4 -0.9 0.6 4.3 4.9 4.7 4.2 3.9 2.9 nm nm 31.8 nm nm 77.6 nm nm nm 2.3 2.5 2.5 -1.4% -0.7% 0.8% 0.0% 0.0% 0.0% -0.60 -0.14 0.10 +chg +chg +chg 4.52 4.04 4.13 0.00 0.00 0.00 3.5% -19.1% -11.4% Avg. Daily nb traded shares:288,785 Profile: Aixtron AG is a leading developer and producer of so-called MOCVD (metal organic chemical vapour deposition) reactors. With the help of this equipment, Aixtron’s customers can produce compound semiconductors that have the ability to transform electric current into light and laser beams (LED/OLEDs). Beyond this, AIXA tools can produce power electronic chips or specialised solar cells to mention further examples. The main manufacturing site is located in Herzogenrath, near Aachen. 80% of Aixtron revenues are generated in Asia. The company employs around 900 people, one third of them engineers. SWOT Analysis Strengths • MOCVD duopoly with Veeco Weaknesses • Market share losses in MOCVD vs. main rival Veeco • Rock-solid balance sheet without debt and c. EUR 2 cash per share • Business model with high entry barriers • Cyclical business Opportunities • General/solid state lighting could emerge as the next mega-trend for LEDs • A stronger USD would support AIXA's operating margins Threats • Business visibility usually not beyond 3-6 months • Potential of organic light emitting diodes (OLED) • Technology changes • Power electronics and future ALD applications • Asian OLED players • ALD products for classical semis with limited financial performance so far • Dependence on key personnel is probably high Main shareholders: Free float 93.2%; Camma B.V. 6.8%; Allianz Global Investors 6.1%; Generation Investment 5.2%; All share prices at 19/05/14. FINANCIAL CALENDAR (Source: Precise) PRICE (SHORT & LONG AVERAGE) titre 28 29/07/14 Results 26 2014Q2 Recommendation: We see some positive signals from the underlying LED lighting demand and AIXA should post increasing order soon, but has to win back lost market share terrain from its main rival Veeco in this domain. AIXA’s OLED activities for TV production are still in an early stage. Despite the topic could mean big business, its success is currently hard to assess. AIXA’s share price usually reacts very sensitive to news flow and the speculation on an order recovery has kept valuation rich and short covering amplified upward movements. We believe that risks are high and EV/sales’15e of c.3x is too expensive in our opinion. We keep our ‘Sell’ rating and our PT of EUR 8.50 Target Price: EUR 8.50 24 22 20 18 16 AIXTRON SMALL & MID CAPS SELECTION Analyst(s) 14 12 10 8 Mrz 11 Source : Factset Jun 11 Sep 11 Dez 11 Mrz 12 Jun 12 Sep 12 Dez 12 Mrz 13 Jun 13 Sep 13 Dez 13 Mrz 14 Jun 14 Adrian Pehl, CFA +49 69 58997 438 Equinet Bank [email protected] 25 Finland SMALL & MID CAPS SELECTION EUR 8.90 Accumulate AKTIA AKTAV.HE/AKTAV FH Market capitalisation: EUR 593m Banks EUR 12/12 12/13 12/14e 12/15e Total Revenue (m) 218 224 217 222 Pre-Provision Profit (PPP) (m) 63.5 66.6 70.0 79.5 Loan Impairment Charge (m) -8.2 -2.8 -3.8 -4.9 Operating profit (OP) (m) 55.3 63.8 66.2 74.6 Earnings before tax (m) 65.0 63.8 66.2 74.6 Net profit (reported) (m) 49.2 50.8 52.7 59.4 Net profit (adj.) (m) 39.5 50.8 52.7 59.4 Shareholders equity (m) 593 577 603 630 Tier 1 Ratio 12.1% 13.8% 13.7% 14.3% Cost/Income ratio 70.8% 70.3% 67.7% 64.2% ROE (adj.) 6.7% 8.8% 8.7% 9.4% NPL ratio (gross) 0.9% 1.0% 0.9% 0.9% NPL coverage 73.1% 73.1% 73.1% 73.1% LIC/Avg. RWA 0.2% 0.1% 0.1% 0.1% P/Pre-Provision Profit per Share 6.1 8.1 8.5 7.5 P/E (adj.) 9.8 10.6 11.2 10.0 P/BV 0.7 0.9 1.0 0.9 P/NAV 0.7 0.9 1.0 0.9 Dividend yield 8.6% 4.7% 5.6% 6.2% PPPPS 0.95 1.00 1.05 1.19 EPS (adj.) 0.59 0.76 0.79 0.89 EPS (adj.) growth 8.2% 29.4% 3.8% 12.7% BVPS 8.85 8.67 9.06 9.46 NAVPS 8.85 8.67 9.06 9.46 DPS 0.50 0.42 0.50 0.55 Abs. Performances(12m,6m,3m,1m): 28.8% 10.8% 0.6% 1.1% 12 month High/low: EUR9.70 / 6.60 Avg. Daily nb traded shares:7,674,000 Main shareholders: Free float 70.0%; Tre Smeder Foundation 10.5%; Elinkorkolaitos Hereditas 10.0%; Pension Insurance Company Veritas 9.2%; Profile: Aktia is a Finnish bank with a strong focus on household clients, especially in mortgages. It offers a wide range of banking, asset management, insurance and real estate services. Aktia operates mainly in the Helsinki region, Finnish coastal areas and growth centres. It has about 350,000 customers who are served via 60 branch offices. With its partners, savings banks and local co-operative banks, Aktia operates an extensive network of about 430 branch offices for certain financial services. SWOT Analysis Strengths • Stable underlying market • Strong solvency position, high dividend • Very low balance sheet risks (NPL clearly below 1%) Weaknesses • Tightening of banking regulation eating into business profitability • Limited growth opportunities due to the strict focus on Finnish retail banking • More sensitive to the interest rate environment than most Nordic banks • Loyal customer base Opportunities • Cost savings measures could improve ROE Threats • Cooling down of the Finnish housing market • Potential for a significant capital repayment • Increasing competition in the field of Finnish mortgages • Further strengthening position in asset management business • European sovereign debt problems affect development in the sector as a whole Recommendation: We see Aktia as an attractive low-risk bet that provides a high dividend yield. The bank's growth prospects are fairly modest, but cost cutting measures will boost both earnings and ROE in 2015. In addition, Aktia has potential for a significant capital repayment once the Finnish FSA approves Aktia's IRBA application. Considering the stable business outlook, the earnings prospects and the very low balance sheet risks (NPL only 0.7% of loan portfolio), we regard Aktia's P/B 1.0 valuation level as attractive. All share prices at 19/05/14. Target Price: EUR 10.00 FINANCIAL CALENDAR (Source: Precise) PRICE (SHORT & LONG AVERAGE) titre 10 AKTIA SMALL & MID CAPS SELECTION Analyst(s) 9 8 7 Antti Saari 6 5 4 Mar 11 Source : Factset 26 Jun 11 Sep 11 Dec 11 Mar 12 Jun 12 Sep 12 Dec 12 Mar 13 Jun 13 Sep 13 Dec 13 Mar 14 Jun 14 +358 10 252 4359 Pohjola [email protected] Spain SMALL & MID CAPS SELECTION EUR 11.78 Buy ALMIRALL ALM.MC/ALM SM Market capitalisation: EUR 2037m Healthcare EUR Sales (m) EBITDA (m) EBITDA margin EBIT (m) EBIT margin Net profit (reported) (m) Net profit (adj.) (m) Cash Flow from Ops.bef. chg in NWC (m) Net debt (Cash) (m) Net Debt/Equity Net Debt/EBITDA Interest cover (EBITDA/Fin. interest) ROCE (adj.) ROCE (adj.)/WACC EV / CE EV / Sales EV / EBITDA EV / EBIT P/E (adj.) P/BV OpFCF yield Dividend yield EPS (adj.) EPS (adj.) growth BVPS DPS Abs. Performances(12m,6m,3m,1m): 12 month High/low: EUR12.99 / 8.69 12/12 683 124 18.2% 56.0 8.2% 76.4 77.8 147 -0.1 0.0 0.0 27.7 7.1% 0.8 1.7 1.9 10.7 23.6 16.3 1.4 8.6% 2.4% 0.46 -22.5% 5.42 0.18 22.3% 12/13 12/14e 12/15e 693 824 915 85.1 133 234 12.3% 16.2% 25.6% 15.7 59.2 158 2.3% 7.2% 17.3% -33.7 61.1 136 31.0 61.1 136 136 135 211 244 232 92.1 0.3 0.2 0.1 2.9 1.7 0.4 17.5 7.0 11.3 1.4% 5.5% 15.1% 0.2 0.8 2.2 2.1 2.2 2.1 3.4 2.8 2.4 27.5 17.4 9.3 nm 39.2 13.8 nm 33.3 15.0 2.3 2.1 1.9 -8.2% 3.9% 7.9% nm 1.1% 2.3% 0.18 0.35 0.78 -60.7% 97.3% 122.0% 5.14 5.56 6.22 -0.07 0.12 0.27 5.6% -6.0% 10.1% Avg. Daily nb traded shares:290,175 Main shareholders: Founders & BoD 66.7%; Free float 28.4%; Wellington Management Co. 5.0%; Profile: Almirall is the leading domestic integrated pharmaceutical, with a diversified product portfolio specialised on high growth potential therapeutic areas (respiratory, central nervous system, dermatology and digestive illnesses). Its local leadership places the company as a strategic partner for large industry peers. The company has focussed on the respiratory area (asthma and COPD), the gastrointestinal, the autoimmune and the dermatology areas as the main growth pillars. Two products of its respiratory pipeline stand out Eklira (aclidinium bromide), approved mid 2012 in the US and EU, and its LAMA/LABA combination (EU approval expected in Q4’14e) and the US (2015). Besides the company has presented Phase II results of its OD-LABA 100977 (with an excellent efficacy profile vs. other competitors’ drugs). This data should trigger an out-license agreement for the new molecule (ex-US). On the other hand, linaclotide, first in class in IBS-c on which Almirall holds the pan-European rights, has been launched in Europe mid 2013. The commercialisation of the new products, together with the restructuration program implemented in Spain should support mid-term growth, while improving the consolidated operating margins. SWOT Analysis Strengths • 2nd LAMA in the market in the US until 2015e Weaknesses • Highly regulated sector. • Potential 3rdLAMA+LABA to reach the market • Still high concentration in Spain. • Diversified product portfolio. • Rivaroxaban’s slow market penetration • Solid balance sheet (Cash positive) and recurrent cash flow generation. Opportunities • Gearing on its respiratory and gastro-intestinal franchises • Strong commercial investment in 2013 • Short/mid term product portfolio renovation. • Competition from generic drugs. • Abediterol’s (OD-LABA) out-license • Possible failure of R&D efforts • Increase of its geographic diversification • Possible delays in authorisation processes, limiting the group’s ability to gain market share All share prices at 19/05/14. FINANCIAL CALENDAR (Source: Almirall) PRICE (SHORT & LONG AVERAGE) titre 13 12 28/07/14 11 Results 2014Q2 Threats • Domestic regulatory pressures Recommendation: We rate the company Buy with a target price of EUR 15.4/share (including AB in COPD and linaclotide in IBS-c, and the risk adjusted AB+formoterol combination (85% approval probability) as well as the dermatological pipeline. The new compounds should help to keep mid term double digit growths in sales and net profit. Newsflow should concentrate in 2H 2014 (LAMA/LABA FDA meeting in September and EU approval in mid Q4). Additionally, we expect the company to out-license its second respiratory molecule. Target Price: EUR 15.40 10 9 8 7 Analyst(s) 6 5 4 Mar 11 Jun 11 Sep 11 Dec 11 Mar 12 Jun 12 Sep 12 Dec 12 Mar 13 Jun 13 Sep 13 Dec 13 Mar 14 Jun 14 Ana Isabel González García CIIA BEKA Finance +34 91 436 78 09 [email protected] Source : Factset 27 France SMALL & MID CAPS SELECTION EUR 36.00 Reduce ALTEN LTEN.PA/ATE FP Market capitalisation: EUR 1178m Software & Computer Services EUR Sales (m) EBITDA (m) EBITDA margin EBIT (m) EBIT margin Net profit (reported) (m) Net profit (adj.) (m) Cash Flow from Ops.bef. chg in NWC (m) Net debt (Cash) (m) Net Debt/Equity Net Debt/EBITDA Interest cover (EBITDA/Fin. interest) ROCE (adj.) ROCE (adj.)/WACC EV / CE EV / Sales EV / EBITDA EV / EBIT P/E (adj.) P/BV OpFCF yield Dividend yield EPS (adj.) EPS (adj.) growth BVPS DPS Abs. Performances(12m,6m,3m,1m): 12 month High/low: EUR.39 / .25 12/12 1 198 125 10,4% 116 9,7% 78,2 78,2 86,0 -58,6 -0,1 -0,5 nm -11,0% -1,2 2,1 0,6 6,2 6,6 11,0 1,9 7,1% 2,8% 2,39 22,5% 13,64 1,00 22,9% 12/13e 12/14e 12/15e 1 216 1 358 1 378 124 132 139 10,2% 9,7% 10,1% 111 125 132 9,1% 9,2% 9,6% 73,6 83,3 87,5 80,4 83,3 87,5 85,8 88,1 93,1 -91,7 -91,9 -123 -0,2 -0,2 -0,2 -0,7 -0,7 -0,9 nm nm nm -10,1% -10,7% -11,1% -1,1 -1,2 -1,2 2,6 2,6 2,4 0,8 0,8 0,7 7,8 8,0 7,4 8,7 8,4 7,8 13,4 14,2 13,5 2,2 2,2 2,1 6,6% 3,5% 6,1% 3,5% 3,5% 3,5% 2,46 2,54 2,67 2,9% 3,6% 5,1% 14,73 16,02 17,45 1,25 1,25 1,25 10,9% 0,9% -3,8% Avg. Daily nb traded shares:28405,000 Main shareholders: Free float 6.0% (5.8%); Founders 2.4% (3.6%); FMR 0.6% (0.5%); International Value Advisers LLC 0.4% (0.3%); Harris Associated Ltd 0.3%; Treasury Stock 0.1% (0.0%); FCPE Alten 0.1%; Managers 0.1%; All share prices at 19/05/14. Profile: High technology consulting company with a large R&D component which generated sales of EUR1,216m in 2013. The workforce totals 14,820 in 16 countries. Breakdown of sales by country: France 62%, Germany 9%, Sweden 8%, Spain 5%, UK 4%, Other 12%. Breakdown of sales by business sector: Aeronautics and Space 18.5%, Energy 20.2%, Automotive 14.5%, Finance & Tertiary 14.5%, Telecoms 12.5%, Multimedia 5.9%, Other: 13.9%. SWOT Analysis STRENGTHS Among the best management/performances of the sector (10.1% operating margin in 2012 vs 10.2% in 2010 and 2011) Positioning in a sector (outsourced R&D) with high entry barriers due to existing listing process Player of reference in France which helps listings Healthy balance sheet: EUR80m FCF in 2012 / net cash position of EUR58.4m on 31/12/12 OPPORTUNITIES Currently benefiting from its leadership position to gain market share Could take advantage of the fall in prices to pursue acquisitions WEAKNESSES High exposure to France (63% of sales), where the context is uncertain and margins lower. Still insufficient differentiation of services (mainly for engineers) Difficulties in Spain: 2012 sales publication showed some negative news regarding Spain, which was rapidly assumed at a cost of around EUR5m (however the margin on Spain is not likely to increase before 2014 and should remain at around 3-4% in 2013) THREATS Need to change the business model to develop fixed-price contract know-how, which is likely to weigh on margins Uncertain context in France Recommendation: The stock trades at 8.8x EBIT 2014e which is close to the historical valuation (9x). The company indicated that we could expect acquisitions representing EUR80m of sales which provide a 2% upside on the share price. However, the acquisition of GECI Engineering is expected to weigh on margins in the short term. Target Price: EUR 37,00 FINANCIAL CALENDAR (Source: Precise) PRICE (SHORT & LONG AVERAGE) titre 40 29/07/14 Trading Update 2014Q2 35 18/06/14 AGM 30 25 20 15 mars 11 Source : Factset 28 juin 11 sept. 11 déc. 11 mars 12 juin 12 sept. 12 déc. 12 mars 13 juin 13 sept. 13 déc. 13 mars 14 juin 14 2013 ALTEN SMALL & MID CAPS SELECTION Analyst(s) Jean-Michel Köster +33 1 45 96 77 17 CM - CIC Securities [email protected] France SMALL & MID CAPS SELECTION EUR 7.42 Reduce ALTRAN ALTR.PA/ALT FP Market capitalisation: EUR 1297m Software & Computer Services EUR Sales (m) EBITDA (m) EBITDA margin EBIT (m) EBIT margin Net profit (reported) (m) Net profit (adj.) (m) Cash Flow from Ops.bef. chg in NWC (m) Net debt (Cash) (m) Net Debt/Equity Net Debt/EBITDA Interest cover (EBITDA/Fin. interest) ROCE (adj.) ROCE (adj.)/WACC EV / CE EV / Sales EV / EBITDA EV / EBIT P/E (adj.) P/BV OpFCF yield Dividend yield EPS (adj.) EPS (adj.) growth BVPS DPS Abs. Performances(12m,6m,3m,1m): 12 month High/low: EUR8.44 / 5.04 12/12 1,456 126 8.7% 111 7.6% 64.6 64.6 56.6 163 0.3 1.3 6.1 14.9% 1.8 1.9 0.7 8.0 9.1 12.9 1.7 0.2% 0.0% 0.45 +chg 3.29 0.00 25.8% 12/13 12/14e 12/15e 1,633 1,750 1,815 118 168 187 7.2% 9.6% 10.3% 105 157 175 6.4% 9.0% 9.7% 65.8 100 114 67.9 100 114 16.7 99.6 119 121 82.0 -14.1 0.2 0.1 0.0 1.0 0.5 -0.1 9.1 23.3 38.1 13.8% 15.0% 16.4% 1.7 1.8 1.6 1.9 2.0 1.8 0.8 0.8 0.7 10.5 8.2 6.8 11.8 8.8 7.3 16.4 12.9 11.3 1.7 1.7 1.5 -11.2% 3.0% 7.4% 0.0% 0.0% 0.0% 0.39 0.57 0.65 -12.9% 47.8% 13.9% 3.74 4.32 4.97 0.00 0.00 0.00 14.5% 1.7% -8.3% Avg. Daily nb traded shares:334,921 Profile: European leader in externalised R&D generating EUR1,633m sales in 2013. The workforce is composed by more of 20,000 people in 11 countries. Breakdown of sales by region: France 45%, Northern Europe 32%, Southern Europe 19%, Rest of World: 4%. Breakdown by business sector: Aeronautics and Space 27%, Manufacturing 22%, Automotive 20%, Telecom and Media 18%, Financial services and Public sector 11%, Other 20%. SWOT Analysis STRENGTHS WEAKNESSES French market leader in the R&D outsourcing sector A broad and diversified portfolio of expertise with a supply-side policy Limited exposure to the banking sector in an uncertain environment According to our estimates, low added value projects excluding performance guarantees account for 70 to 75% of the group's activities Aggressive price competitive sector policy in a moderately Rising earnings with much higher margins since the sale of ADL and the Brazilian activities OPPORTUNITIES THREATS Capacity to improve its operating margin even in a tough environment The recent cash flow generation may allow the group to finance its next acquisitions without weakening its balance sheet Main shareholders: Free float 71.9% (68.5%); Altrafin 17.4% (19.6%); Harris Associates 4.4% (4.1%); IndustrieHansa integration in Germany H. Martigny 3.2% (3.9%); A. Kniazeff 3.1% (3.9%); Use of offshoring In 2013 the European macroeconomic environment could still weigh on the R&D outsourcing sector and could lead to industrial projects being deferred or scaled back, especially in France All share prices at 19/05/14. FINANCIAL CALENDAR (Source: Precise) PRICE (SHORT & LONG AVERAGE) Recommendation: The group has shown its ability to meet the expectations developed in the 2012-2015 strategic plan. The capacity to improve its margin to 11-12% has been confirmed in 2013 (11.3% in H2 2013) and the trend should be supported in 2014. Our recommendation was downgraded post Q1 2014 results when the stock was at EUR8 and our price target was defined on the basis of 9x EV/EBIT. titre 10.0 29/07/14 Trading Update 9.0 Target Price: EUR 7.60 2014Q2 8.0 Analyst(s) 7.0 6.0 Sébastien Liagre 5.0 CM - CIC Securities +33 1 45 96 90 34 [email protected] 4.0 3.0 2.0 Mar 11 Jun 11 Sep 11 Dec 11 Mar 12 Jun 12 Sep 12 Dec 12 Mar 13 Jun 13 Sep 13 Dec 13 Mar 14 Jun 14 Source : Factset 29 Portugal SMALL & MID CAPS SELECTION EUR 2.27 Buy ALTRI ALSS.LS/ALTR PL Market capitalisation: EUR 467m Basic Resources EUR Sales (m) EBITDA (m) EBITDA margin EBIT (m) EBIT margin Net profit (reported) (m) Net profit (adj.) (m) Cash Flow from Ops.bef. chg in NWC (m) Net debt (Cash) (m) Net Debt/Equity Net Debt/EBITDA Interest cover (EBITDA/Fin. interest) ROCE (adj.) ROCE (adj.)/WACC EV / CE EV / Sales EV / EBITDA EV / EBIT P/E (adj.) P/BV OpFCF yield Dividend yield EPS (adj.) EPS (adj.) growth BVPS DPS Abs. Performances(12m,6m,3m,1m): 12 month High/low: EUR2.94 / 1.64 12/13e 577 147 25.5% 95.3 16.5% 54.1 54.1 106 564 2.4 3.8 5.6 8.2% 1.0 1.2 1.8 7.0 10.7 8.5 2.0 18.6% 0.9% 0.26 3.7% 1.14 0.02 16.1% 12/14e 12/15e 12/16e 536 552 558 140 141 148 26.1% 25.6% 26.5% 93.2 97.8 107 17.4% 17.7% 19.2% 45.6 51.3 60.8 45.6 51.3 60.8 92.4 95.0 102 496 429 352 1.8 1.3 0.9 3.5 3.0 2.4 4.9 5.7 7.1 8.3% 8.9% 10.0% 1.0 1.1 1.2 1.2 1.1 1.0 1.8 1.6 1.5 6.9 6.3 5.5 10.3 9.2 7.6 10.2 9.1 7.7 1.7 1.4 1.2 15.5% 15.1% 17.3% 0.9% 0.9% 0.9% 0.22 0.25 0.30 -15.7% 12.6% 18.4% 1.34 1.57 1.85 0.02 0.02 0.02 -12.5% -16.7% -5.5% Avg. Daily nb traded shares:429,004 Main shareholders: Free float 43.0%; Management 23.0%; Ana Mendonça 15.0%; UBS 10.0%; Profile: As a pure pulp player Altri is exposed to the changes in its prices, which tend to be more volatile than paper. However, given its location and the characteristics of its industrial infrastructure, it is one of the most efficient players of the European industry. These enable Altri to produce above average operating margins, providing the indispensable buffer to accommodate its high debt stock. In fact, the ability to generate high cash flow outputs and the fact that there is no major investment plans in the radar screen, are the two major assets of the investment case for the company. We argue that this will provide, over the next years, a gradual erosion of the debt stock and the consequent higher appropriation of the company’s value from creditors to shareholders. The main risk is the rate of delivery of the deleveraging process, which is totally dependent on the evolution of pulp prices. SWOT Analysis Strengths • Celbi (highly efficient pulp mill) Weaknesses • Focus on the pulp business • Geographic localization vs. Brazilian pulp players • Above average leverage ratios • Pulp feedstock (eucalyptus globulus) • Cyclical nature of the pulp business • Cost efficiency oriented management Opportunities • Pulp production expansion plans Threats • Lower BHKP prices • Biomass business • Higher wood prices • Higher growth rates of short fibre pulp consumption in the world • Consolidation opportunities • Competition from LatAm producers • Economic slowdown All share prices at 19/05/14. FINANCIAL CALENDAR (Source: Precise) PRICE (SHORT & LONG AVERAGE) Recommendation: We continue to highlight the company’s strong cash flow generation profile, standing at the top of PSI20 members when adjusted by the share price. The decrease in net debt going forward (with no expansion plans on sight) should at least sustain the share price even at current EV values. titre 3.0 Target Price: EUR 2.80 2.8 2.6 2.4 2.2 2.0 Analyst(s) 1.8 1.6 1.4 1.2 1.0 0.8 mar 11 Source : Factset 30 jun 11 set 11 dez 11 mar 12 jun 12 set 12 dez 12 mar 13 jun 13 set 13 dez 13 mar 14 jun 14 Carlos Jesus Artur Amaro Caixa-Banco de Investimento +351 21 389 6812 +351 213 89 6822 [email protected] [email protected] Italy SMALL & MID CAPS SELECTION EUR 4.44 Accumulate AMPLIFON AMPF.MI/AMP IM Market capitalisation: EUR 993m Healthcare EUR Sales (m) EBITDA (m) EBITDA margin EBIT (m) EBIT margin Net profit (reported) (m) Net profit (adj.) (m) Cash Flow from Ops.bef. chg in NWC (m) Net debt (Cash) (m) Net Debt/Equity Net Debt/EBITDA Interest cover (EBITDA/Fin. interest) ROCE (adj.) ROCE (adj.)/WACC EV / CE EV / Sales EV / EBITDA EV / EBIT P/E (adj.) P/BV OpFCF yield Dividend yield EPS (adj.) EPS (adj.) growth BVPS DPS Abs. Performances(12m,6m,3m,1m): 12 month High/low: EUR4.89 / 3.59 12/12 847 145 17.1% 97.9 11.6% 43.1 52.8 90.8 306 0.7 2.1 5.7 7.0% 0.9 1.4 1.4 8.2 12.1 18.7 2.0 5.8% 1.1% 0.20 0.4% 1.92 0.04 11.8% 12/13 12/14e 12/15e 829 855 887 117 131 142 14.2% 15.3% 16.0% 68.5 80.5 91.0 8.3% 9.4% 10.3% 12.8 37.6 44.5 18.3 47.3 54.2 63.0 88.0 95.6 275 233 178 0.7 0.6 0.4 2.3 1.8 1.3 3.9 5.5 6.0 3.2% 6.7% 7.8% 0.4 0.9 1.1 1.6 1.7 1.7 1.5 1.5 1.4 10.4 9.7 8.5 17.8 15.7 13.3 nm 32.1 27.0 2.4 2.5 2.3 4.8% 5.5% 7.2% 1.0% 1.0% 1.1% 0.06 0.14 0.16 -70.1% 130.8% 19.0% 1.71 1.80 1.91 0.04 0.04 0.05 15.3% -1.2% -1.0% Avg. Daily nb traded shares:250,094 Main shareholders: Ampliter N.V. 54.8%; Free float 45.2%; All share prices at 19/05/14. FINANCIAL CALENDAR (Source: Precise) PRICE (SHORT & LONG AVERAGE) titre 5.0 4.8 4.6 4.4 4.2 Profile: Established in 1950, Amplifon (AMP) is an Italian multinational company which operates in the distribution of hearing systems (hearing aids and related services) and their fitting and personalisation to the needs of clients with hearing impairment. It is the world-wide leader with 9% of global market share. It is active in 20 countries (Italy, the Netherlands, France, Germany, the UK and Ireland, Switzerland, Spain, Portugal, Belgium, Luxembourg, Hungary, Turkey, Poland, Egypt, USA, Canada, Australia, New Zealand and India) through a network of over 3,200 points of sale and 2,200 service centres. SWOT Analysis Strengths • World-wide leader in the highly fragmented hearing aid retail market • High brand recognition and good geographical diversification • Strong operational leverage thanks to high purchase power to suppliers • Strong cash generation Weaknesses • USD exposure (about 18% of total sales), AUD exposure (about 16.3% of total sales) and GBP exposure (about 4.7% ofSudden total sales) • changes in the health regulation Opportunities • Global presence in a growing market due to: 1) ageing population£pv£ 2) acoustic pollution£pv£ 3) even higher prevalence by modern • Improvingdriven adoption rates aslifestyle stigma attached to hearing aids wears off Threats • Weakness in the economic scenario entails a strong slowdown in the consumption trend of ageing population • Evolution of Hearing Aids market from Medical to Retail oriented due to deregulation led to growing importance of traditional marketing • Price pressure from tools optical chains, venture capital, traditional competitors moving abroad • Potential delay in increasing the size of its local subsidiaries in some historical countries (such as France, Germany, in order to maximize profitability Q1 14 sales (+1.9% Y/Y) confirmed the expected recovery in Europe and the continuous positive momentum in the USA and APAC. Q1 14 profitability was decidedly better than expected: Q1 14 EBITDA grew by 5.0% Y/Y at EUR 18.6m. This improvement was achieved thanks to the sales recovery in several European countries and to the reorganisation processes in 2013. M&A activity speed-up: the group strengthened its international presence through several operations in the last few months: 1) entrance in the Israeli market by acquiring 60% of MedOrt; 2) acquisition of the retail chain retail chain owned by Audika in Italy; 3) increased the stake in Amplifon Poland from 49% to 63%; 4) network expansion in Germany (5 shops), France (4 shops opened + 4 recently acquired in April), Iberia (2 new openings), Turkey (2 shops acquired) and Hungary (1 shop opened). In our opinion, these acquisitions point out that the management is back to focus on the M&A activity, which was an important growth driver in the past. We believe that the group will continue a more aggressive M&A activities also in the coming months both in Europe and in new markets. Sales and profitability recovery expected in 2014: the management said that Q2 14 should confirm the positive sales and profitability trends recorded in Q1 14. after a difficult 2013, we reckon that the group could record a recovery both in sales and profitability in 2014. Indeed, we expect all the macro geographic areas (Europe, USA and APAC) to contribute positively to the group’s turnover growth. Recommendation: based on the foregoing indications, we confirm our Accumulate recommendation and our Target price of EUR 5.50 per share (WACC 7.2% and perpetual growth 1.5%). 4.0 Target Price: EUR 5.50 3.8 3.6 3.4 3.2 3.0 2.8 Mar 11 Source : Factset Jun 11 Sep 11 Dec 11 Mar 12 Jun 12 Sep 12 Dec 12 Mar 13 Jun 13 Sep 13 Dec 13 Mar 14 Jun 14 Analyst(s) Paola Saglietti Banca Akros +39 02 4344 4287 [email protected] 31 Italy SMALL & MID CAPS SELECTION EUR 7.62 Buy ANSALDO STS STS.MI/STS IM Market capitalisation: EUR 1372m Industrial Engineering EUR Sales (m) EBITDA (m) EBITDA margin EBIT (m) EBIT margin Net profit (reported) (m) Net profit (adj.) (m) Cash Flow from Ops.bef. chg in NWC (m) Net debt (Cash) (m) Net Debt/Equity Net Debt/EBITDA Interest cover (EBITDA/Fin. interest) ROCE (adj.) ROCE (adj.)/WACC EV / CE EV / Sales EV / EBITDA EV / EBIT P/E (adj.) P/BV OpFCF yield Dividend yield EPS (adj.) EPS (adj.) growth BVPS DPS Abs. Performances(12m,6m,3m,1m): 12 month High/low: EUR8.52 / 6.42 12/12 1,248 138 11.0% 117 9.4% 75.7 75.7 96.5 -302 -0.6 -2.2 46.6 62.5% 6.9 4.9 0.5 4.4 5.2 13.3 2.1 4.9% 2.9% 0.47 -9.2% 2.93 0.18 4.0% 12/13 12/14e 12/15e 1,256 1,337 1,409 132 140 161 10.5% 10.5% 11.4% 118 127 148 9.4% 9.5% 10.5% 75.9 81.3 94.8 75.9 81.3 94.8 90.1 95.0 108 -260 -331 -355 -0.5 -0.6 -0.6 -2.0 -2.4 -2.2 41.9 41.6 37.2 57.2% 74.9% 74.4% 6.3 8.2 8.2 7.8 8.4 7.0 0.8 0.7 0.6 8.0 6.7 5.7 9.0 7.4 6.2 18.6 16.9 14.5 2.7 2.4 2.2 -0.5% 7.5% 4.2% 1.9% 2.1% 2.4% 0.42 0.45 0.53 -10.9% 7.2% 16.6% 2.87 3.17 3.54 0.15 0.16 0.18 -5.5% -5.6% 1.1% Avg. Daily nb traded shares:640,717 Main shareholders: Free float 55.8%; Finmeccanica 40.0%; Altrinsic GA LLC 2.1%; Columbia Wanger AM 2.1%; All share prices at 19/05/14. FINANCIAL CALENDAR (Source: Precise) PRICE (SHORT & LONG AVERAGE) titre 8.5 8.0 22/05/14 Dividend Payment 2013 19/05/14 Ex Dividend Date 2013 7.5 7.0 6.5 Profile: STS provides railway signalling (“Signalling”) and mass-transit transportation systems (driverless metro systems); the signalling business generated ~58% of 2013 revenues, with a ~5% ROS, while the transportation system business generated ~42% of revenues with a ~14% ROS. STS boasts a ~EUR 5.6bn order backlog covering more than 4 years of activity. The company has a strong international exposure: in 2013, it booked ~16% of its new orders in Italy, ~21% in the Rest Of Europe, ~10% in APAC, ~12% in North America and ~41% in the Rest of the World (mainly Asia). STS is targeting a ~2.3/4.6% CAGR in the 2012-15 timeframe, virtually in line with the reference market’s growth expectation (CAGR of ~3% until 2015). The company is facing stiff market competition in the field of signalling and is working continuously at increasing the technological content of its solutions while reducing its cost base. SWOT Analysis Strengths • Strong positioning in the field of signalling Weaknesses • Price pressure on standardized signalling • Growing presence in the mass-transport field • Lack of a reliable rolling stock partner • Huge backlog and outstanding visibility • Downpayments are increasingly lower Opportunities • FNC may sell its 40% stake to someone else Threats • Chinese players are likely to become more and more competitive in the medium term • The resumption of the Libyan jobs is in doubt • Operating efficiency can be improved further • Huge business opportunities are looming in the MiddleEast and Russia • Budget constraints in mature countries Recommendation: The new order collection reached ~EUR 1.5bn in 2013 (flat Y/Y); revenues came in at EUR 1.25bn (~+1% Y/Y), with a ~EUR 114m EBIT (flat Y/Y, at 9.4% of revenues); net profit was EUR 75m (flat Y/Y). The net cash position came in at EUR 280m (EUR 302m as at the end of 2012). STS aims at collecting new orders worth EUR 1.4/1.7bn in 2014; the company had a good start of the year with an order collection of ~EUR 660m YTD; revenues are expected to come in at EUR 1.25/1.35bn with a 9.5% EBIT margin (implying a EUR 119/128m EBIT guidance); the net cash position should reach ~EUR 270/300m. We believe that STS' fundamental fair value is ~EUR 7.0 based on a DCF approach; if we look at the multiples of the Siemens/Invensys Rail deal, we can draw a higher "speculative" valuation of ~EUR 12; our current target price (EUR 9.3) is calculated as the average of these two valuations. 6.0 Target Price: EUR 9.30 5.5 5.0 4.5 4.0 Mar 11 Source : Factset Jun 11 Sep 11 Dec 11 Mar 12 Jun 12 Sep 12 Dec 12 Mar 13 Jun 13 Sep 13 Dec 13 Mar 14 Jun 14 ANSALDO STS SMALL & MID CAPS SELECTION Analyst(s) Gabriele Gambarova 32 +39 02 43 444 289 Banca Akros [email protected] Netherlands SMALL & MID CAPS SELECTION EUR 26.52 Accumulate ARCADIS ARDS.AS/ARCAD NA Market capitalisation: EUR 1984m General Industrials EUR Sales (m) EBITDA (m) EBITDA margin EBIT (m) EBIT margin Net profit (reported) (m) Net profit (adj.) (m) Cash Flow from Ops.bef. chg in NWC (m) Net debt (Cash) (m) Net Debt/Equity Net Debt/EBITDA Interest cover (EBITDA/Fin. interest) ROCE (adj.) ROCE (adj.)/WACC EV / CE EV / Sales EV / EBITDA EV / EBIT P/E (adj.) P/BV OpFCF yield Dividend yield EPS (adj.) EPS (adj.) growth BVPS DPS Abs. Performances(12m,6m,3m,1m): 12 month High/low: EUR28.23 / 18.75 12/12 2,545 199 7.8% 152 6.0% 89.1 105 136 285 0.5 1.4 9.1 10.8% 1.4 1.5 0.6 7.4 9.7 12.2 2.4 5.1% 2.7% 1.47 22.6% 7.49 0.47 23.0% 12/13 12/14e 12/15e 2,516 2,590 2,722 197 229 242 7.8% 8.9% 8.9% 146 183 197 5.8% 7.1% 7.2% 91.4 122 133 111 134 145 148 168 178 218 106 9.0 0.4 0.2 0.0 1.1 0.5 0.0 10.9 16.3 20.0 10.7% 13.3% 14.6% 1.4 1.8 1.9 2.0 2.0 1.9 0.8 0.8 0.7 10.1 8.7 7.8 13.6 10.9 9.6 17.2 14.8 13.7 3.8 3.5 3.3 5.2% 7.9% 7.3% 2.1% 2.2% 2.4% 1.49 1.79 1.94 1.7% 19.9% 8.2% 6.68 7.49 7.99 0.57 0.59 0.64 11.5% -1.5% 0.3% Avg. Daily nb traded shares:100,720 Main shareholders: Free float 56.8%; St. Lovinklaan 20.6%; ASR Nederland 4.2%; All share prices at 19/05/14. Profile: Arcadis is a truly international engineering company and has operations in 4 divisions: Infrastructure, Water, Environment and Buildings. For these segments ARCADIS delivers consulting, engineering and project management services. The company is active worldwide and is ranked in the top 3 engineering companies of Europe and top 10 of the world. The largest part of revenues is derived from the US (over 35%). SWOT Analysis Strengths • Track record in top line growth and margin expansion by positioning higher in the value chain • A successful history of value adding acquisitions Weaknesses • A large part of the company’s cost base is inflexible • Strong global presence • Despite presence in growth segments, still sensitive to the construction cycle Opportunities • Successful leader in consolidation within the fragmented industry. Financial head room for more acquisitions • Opportunities for further expansion, especially in Asia (a.o. China) • Benefiting from global trends like climate change and urbanization Threats • Limited pricing power in a downturn because of underutilization of staff • Surprises in the restructuring process in Europe • Low margins in Europe. • Exchange rate fluctuations (USD, GBP, PLZ and BRL) Recommendation: We believe that Arcadis is an excellently managed company that has successfully focused its activities to fast growing, higher margin businesses. The restructuring in Europe seems well on track and margins are moving accordingly. We have an Accumulate rating on the company as we believe that it is well positioned for the economic upturn especially in the US, South America and Asia. In terms of valuation it is not most cheap in the sector. FINANCIAL CALENDAR (Source: Precise) PRICE (SHORT & LONG AVERAGE) t i t re Target Price: EUR 29.00 30 28 09/06/2014 Dividend Payment 2013 26 24 ARCADIS SMALL & MID CAPS SELECTION Analyst(s) 22 20 18 16 14 Edwin de Jong 12 10 Mar 11 Jun 11 Sep 11 Dec 11 Mar 12 Jun 12 Sep 12 Dec 12 Mar 13 Jun 13 Sep 13 Dec 13 Mar 14 +312 0 5508569 SNS Securities [email protected] Jun 14 Source : Factset 33 Netherlands SMALL & MID CAPS SELECTION EUR 30.20 Buy ASM INTERNATIONAL ASMI.AS/ASM NA Market capitalisation: EUR 1917m Technology Hardware & Equipment EUR Sales (m) EBITDA (m) EBITDA margin EBIT (m) EBIT margin Net profit (reported) (m) Net profit (adj.) (m) Cash Flow from Ops.bef. chg in NWC (m) Net debt (Cash) (m) Net Debt/Equity Net Debt/EBITDA Interest cover (EBITDA/Fin. interest) ROCE (adj.) ROCE (adj.)/WACC EV / CE EV / Sales EV / EBITDA EV / EBIT P/E (adj.) P/BV OpFCF yield Dividend yield EPS (adj.) EPS (adj.) growth BVPS DPS Abs. Performances(12m,6m,3m,1m): 12 month High/low: EUR31.83 / 22.64 12/12 1,418 141 9.9% 88.5 6.2% 7.1 7.1 50.0 -196 -0.2 -1.4 6.5 9.0% 0.8 3.6 2.1 21.5 34.2 nm 2.0 -1.7% 1.8% 0.13 -94.9% 13.44 0.50 12.8% 12/13 12/14e 12/15e 452 542 640 44.7 92.8 117 9.9% 17.1% 18.3% 44.7 68.3 88.3 9.9% 12.6% 13.8% 1,004 122 151 24.5 61.1 78.5 45.4 197 242 -310 -426 -577 -0.2 -0.3 -0.3 -6.9 -4.6 -4.9 4.2 nm nm 21.2% 29.0% 33.4% 1.9 2.6 3.0 6.8 7.5 6.0 2.7 2.7 2.1 27.1 16.1 11.4 27.1 21.8 15.2 nm 31.4 24.4 1.1 1.2 1.1 1.1% 7.9% 9.8% 1.8% 1.8% 2.0% 0.39 0.96 1.24 198.6% 149.5% 28.4% 22.79 24.96 27.72 0.55 0.55 0.60 24.1% 16.1% 4.9% Avg. Daily nb traded shares:150,081 Main shareholders: Free float 65.1%; Mr A. Del Prado 18.0%; Aberdeen 9.9%; JP Morgan Chase 6.0%; Eminence Capital 5.0%; Capital 4.4%; Tokyo Electron 4.0%; Den Norges Bank 3.2%; MFS 3.0%; All share prices at 19/05/14. Profile: ASMI is a supplier of Front End semiconductor manufacturing equipment. The company targets the CVD market (Epitaxy, Vertical Furnaces, PECVD), where it competes with AMAT, Tokyo Electron and Novellus. The growth driver is the new ALD technology, which is being rapidly adopted because this technology is needed at higher nodes. In this fast growing segment, ASMI is by far market leader. Furthermore, ASMI has a 40% stake in ASMPT (with a separate listing in Hong Kong) which is the market leader in the back-end assembly equipment market. SWOT Analysis Strengths • Strong position in advanced technologies Weaknesses • Discount Front End activities ex value ASMPT stake • Well exposed to Intel and TSMC • Dependent on a limited number of products • Participation in ASMPT is market leader in back-end • Front-end still has to build track record of profitable growth Opportunities • Bring profitability in line with competition Threats • Front-end competes with large players (AMAT, TEL) • Capture growth in new applications for (PE) ALD • High dependency on a few customers • Expand in Memory and Foundry • Highly cyclical nature chip industry Recommendation: ASMI’s ALD technology is getting adopted rapidly and also in other parts of the front end business, like epitaxy and vertical furnaces ASMI holds defendable niche market positions. We do not exclude that ASMI will be involved in a new consolidation round in the front end, with the concentrated positions that the potential AMAT/TEL combination and ASML now hold. ASMI’s valuation is extremely undemanding. Target Price: EUR 30.00 FINANCIAL CALENDAR (Source: Precise) PRICE (SHORT & LONG AVERAGE) t i t re 34 23/07/14 Results 32 2014Q2 30 28 06/06/14 Dividend Payment 2013 23/05/14 Ex Dividend Date 2013 21/05/14 AGM 2013 26 24 22 20 18 16 Mar 11 Source : Factset 34 Jun 11 Sep 11 Dec 11 Mar 12 Jun 12 Sep 12 Dec 12 Mar 13 Jun 13 Sep 13 Dec 13 Mar 14 Jun 14 ASM INTERNATIONAL SMALL & MID CAPS SELECTION Analyst(s) Edwin de Jong +312 0 5508569 SNS Securities [email protected] Italy SMALL & MID CAPS SELECTION EUR 7.26 Accumulate ASTALDI AST.MI/AST IM Market capitalisation: EUR 715m Materials, Construction & Infrastructure EUR Sales (m) EBITDA (m) EBITDA margin EBIT (m) EBIT margin Net profit (reported) (m) Net profit (adj.) (m) Cash Flow from Ops.bef. chg in NWC (m) Net debt (Cash) (m) Net Debt/Equity Net Debt/EBITDA Interest cover (EBITDA/Fin. interest) ROCE (adj.) ROCE (adj.)/WACC EV / CE EV / Sales EV / EBITDA EV / EBIT P/E (adj.) P/BV OpFCF yield Dividend yield EPS (adj.) EPS (adj.) growth BVPS DPS Abs. Performances(12m,6m,3m,1m): 12 month High/low: EUR7.91 / 5.13 12/12 2,457 264 10.8% 212 8.6% 74.1 74.1 127 626 1.1 2.4 3.1 14.8% 1.5 1.2 0.5 4.4 5.5 6.7 1.0 -33.7% 3.1% 0.75 4.1% 5.16 0.16 33.0% 12/13 12/14e 12/15e 2,520 2,776 3,133 324 346 369 12.9% 12.5% 11.8% 236 264 276 9.4% 9.5% 8.8% 79.9 100 115 77.8 100 115 171 187 213 798 888 839 1.3 1.3 1.1 2.5 2.6 2.3 3.1 3.6 4.4 15.1% -28.0% -69.5% 1.6 -2.9 1.5 1.3 1.2 0.6 0.6 0.5 4.9 4.7 4.3 6.7 6.2 5.8 9.7 7.1 6.3 1.3 1.1 1.0 -13.3% -10.6% 10.1% 2.6% 3.5% 4.0% 0.79 1.02 1.15 5.0% 29.0% 13.2% 5.68 6.54 7.44 0.19 0.25 0.29 0.2% 3.0% -6.7% Avg. Daily nb traded shares:185,584 Profile: Astaldi is one of the main Italian contractors and concession operators; transport infrastructures, water and renewable energy, civil and industrial building are the group’s key sectors. The group also operates as a promoter of project finance initiatives and as a concession manager. Astaldi group was set up in the 1920s by the Astaldi family and was listed on the Milan stock exchange in June 2002. The group’s main shareholder is still the Astaldi family which owns 52.06% of the company. In November 2012 Astaldi unveiled its 2013-2017 business plan which focuses on: concession projects, development of new markets (namely Russia and Canada), development of large EPC contracts. The company’s main targets are: a 9% 2012-2017 CAGR in revenues, a 12% CAGR in EBIT and a 18% CAGR in net profit. It’s worth noting the high visibility the company has on its future revenues; particularly around 70% of revenues is expected to be secured in the next 5 years. One of the main issues on Astaldi is its capex and investment plan, particularly on the existing and new concessions, and the related impact on the company’s gross debt. Most of the concession projects the company invested in do not contribute, “line by line”, to the company’s P&L (e.g. Brescia-Padova Highway) or are in an early stage of development (e.g. Milan 5 subway line). Though the percentage of guarantee revenues on total revenues of Astaldi’s concession projects is quite high, the equity payback period is, on average, 15 years. The company is going to invest around EUR 400m in the concession business over the plan’s horizon. As a result the company’s net debt related to the concession business is expected to increase from the present EUR 330m to EUR 700m by 2017. The increase in the concession business’ net debt is expected to be offset by the cash-flow generated by the construction sector. At the end of the plan’s horizon the company expects EUR 630m net debt (EUR 800m at the end of 2013). SWOT Analysis Strengths • Excellent track record in the execution of the business plan • Low exposure to risky countries Weaknesses • low geographical diversification Opportunities • investments in the concession business Threats • sizeable investments in the concession business in Italy could increase the risk profile of the company.. • high exposure on the Italian market Main shareholders: Astaldi family 52.1%; Free float 47.9%; All share prices at 19/05/14. • geographical diversification FINANCIAL CALENDAR (Source: Precise) PRICE (SHORT & LONG AVERAGE) titre 8.0 7.5 7.0 6.5 6.0 Recommendation: the concession projects are the key issue for Astaldi; in this respect we do not expect the visibility to improve in the short term since most of the projects are still not completed. However, the stock is trading at cheap multiples and the stock price is an interesting entry point. 5.5 Target Price: EUR 9.00 5.0 4.5 4.0 3.5 Mar 11 Source : Factset Jun 11 Sep 11 Dec 11 Mar 12 Jun 12 Sep 12 Dec 12 Mar 13 Jun 13 Sep 13 Dec 13 Mar 14 Jun 14 ASTALDI SMALL & MID CAPS SELECTION Analyst(s) Francesco Sala +39 02 4344 4240 Banca Akros [email protected] 35 Finland SMALL & MID CAPS SELECTION EUR 7.00 Buy ATRIA ATRAV.HE/ATRAV FH Market capitalisation: EUR 198m Food & Beverage EUR Sales (m) EBITDA (m) EBITDA margin EBIT (m) EBIT margin Net profit (reported) (m) Net profit (adj.) (m) Cash Flow from Ops.bef. chg in NWC (m) Net debt (Cash) (m) Net Debt/Equity Net Debt/EBITDA Interest cover (EBITDA/Fin. interest) ROCE (adj.) ROCE (adj.)/WACC EV / CE EV / Sales EV / EBITDA EV / EBIT P/E (adj.) P/BV OpFCF yield Dividend yield EPS (adj.) EPS (adj.) growth BVPS DPS Abs. Performances(12m,6m,3m,1m): 12 month High/low: EUR8.88 / 6.01 12/12 1,344 80.1 6.0% 30.3 2.3% 10.2 10.2 59.9 364 0.8 4.5 7.1 2.7% 0.4 0.6 0.4 6.7 17.6 17.3 0.4 23.1% 3.5% 0.36 +chg 15.26 0.22 5.7% 12/13 1,411 84.1 6.0% 19.7 1.4% -4.3 -4.3 60.1 306 0.7 3.6 6.6 2.0% 0.3 0.7 0.4 6.2 26.2 nm 0.5 11.2% 3.1% -0.15 -chg 14.56 0.22 -12.9% 12/14e 12/15e 1,443 1,476 74.7 97.3 5.2% 6.6% 24.7 47.3 1.7% 3.2% 7.1 27.0 7.1 27.0 57.2 77.2 333 314 0.8 0.7 4.5 3.2 5.5 8.1 2.4% 4.6% 0.4 0.7 0.7 0.6 0.4 0.3 7.0 5.2 21.2 10.7 27.9 7.3 0.5 0.5 -10.6% 13.0% 3.1% 6.9% 0.25 0.95 +chg nm 14.59 15.33 0.22 0.48 -20.5% -0.3% Avg. Daily nb traded shares:9,631 Main shareholders: Free float 39.4%; Itikka osuuskunta 29.9%; Lihakunta 27.8%; Mandatum Life 2.9%; All share prices at 19/05/14. FINANCIAL CALENDAR (Source: Precise) PRICE (SHORT & LONG AVERAGE) Profile: A supplier of meat products, Atria makes 60% of its sales in Finland, 30% in Sweden, and 10% in Russia and the Baltic countries by selling products to customers in the retail, industrial and HoReCa sectors and export markets. Atria's product mix consists of fresh meat, processed meat and convenience foods. The company has own primary production in the Baltic countries. SWOT Analysis Strengths • Market leader in Finland Weaknesses • Weak bargaining power (Finnish and Swedish retail sectors are the most heavily concentrated in the world) • Weak market position in the Moscow region • Strong brands • Well-managed product portfolio • Two share series of which the voting ones are held by a cooperation of Finnish contract producers Opportunities • Turnaround in Russia Threats • Failure to turn the Russian business around • “Normalisation” of profitability after the raw material spike • Completed Saarioinen acquisition • Private label taking more market share • Declining supply of domestic meat raw material in Finland • Russia's import ban on EU pork prolonging Recommendation: Atria’s share price has come down to an attractive level. Our view for the next 12 months is positive, largely on the back of next year’s profit outlook, which is improved by the restructuring cost savings in Russia (some EUR 6m) and the achievement of full synergies from the acquired Saarioinen operations (some EUR 5m) from early 2015 onwards. If we assume that the measures yield the expected results and the meat market gradually regains its balance from the negative effects of Russia's import ban on EU pork, Atria’s valuation on our forecasts for 2015 is attractive. We see few positive triggers over the next couple of quarters as the meat market will not recover from the disruption immediately and price hikes will take time, but we believe these factors have been priced in already. titre 9.0 Target Price: EUR 8.50 8.5 8.0 7.5 7.0 ATRIA SMALL & MID CAPS SELECTION Analyst(s) 6.5 6.0 5.5 5.0 4.5 Mar 11 Source : Factset 36 Jun 11 Sep 11 Dec 11 Mar 12 Jun 12 Sep 12 Dec 12 Mar 13 Jun 13 Sep 13 Dec 13 Mar 14 Jun 14 Niclas Catani +358 10 252 8780 Pohjola [email protected] Belgium SMALL & MID CAPS SELECTION EUR 54.82 Accumulate BARCO BAR.BR/BAR BB Market capitalisation: EUR 670m Electronic & Electrical Equipment EUR Sales (m) EBITDA (m) EBITDA margin EBIT (m) EBIT margin Net profit (reported) (m) Net profit (adj.) (m) Cash Flow from Ops.bef. chg in NWC (m) Net debt (Cash) (m) Net Debt/Equity Net Debt/EBITDA Interest cover (EBITDA/Fin. interest) ROCE (adj.) ROCE (adj.)/WACC EV / CE EV / Sales EV / EBITDA EV / EBIT P/E (adj.) P/BV OpFCF yield Dividend yield EPS (adj.) EPS (adj.) growth BVPS DPS Abs. Performances(12m,6m,3m,1m): 12 month High/low: EUR67.36 / 52.41 12/12 1,156 159 13.8% 97.6 8.4% 94.2 96.9 156 -104 -0.2 -0.7 nm 14.7% 1.4 1.4 0.5 3.8 6.2 7.4 1.3 18.7% 2.6% 7.34 9.0% 41.42 1.40 -17.9% 12/13 12/14e 12/15e 1,158 1,155 1,161 153 155 162 13.2% 13.4% 14.0% 69.6 71.9 74.4 6.0% 6.2% 6.4% 57.1 60.0 60.5 57.1 60.0 60.5 132 143 148 -101 -127 -171 -0.2 -0.2 -0.3 -0.7 -0.8 -1.1 70.9 nm nm 11.4% 9.2% 10.3% 1.1 0.9 1.0 1.2 1.1 1.0 0.5 0.5 0.4 3.9 3.5 3.1 8.6 7.6 6.8 13.1 12.1 12.0 1.2 1.1 1.0 12.5% 6.8% 9.5% 2.7% 2.9% 3.1% 4.33 4.54 4.58 -41.1% 5.0% 0.8% 47.44 50.75 54.10 1.50 1.60 1.70 -0.5% -0.3% -3.3% Avg. Daily nb traded shares:21,275 Profile: Barco is specialised in visualisation solutions for professional markets. The company is divided in 5 Business Units: Entertainment & Corporate (Digital Cinema, Rental & Staging, Coporate AV), Healthcare (Diagnostic Imaging, Modalities, Surgical Imaging, Healthcare IT), Industrial & Govenrment (Research & Design, Security & Surveillance, Utilities), Defense & Aerospace (Defense, Avionics, Air Traffic Control, Training & Simulation) and Ventures (small start-ups or recently acquired companies developing with the goal to be integrated in another BU). Barco's strategy is based on differentiation and R&D culture. It is active all over the world: the Americas, Europe and APAC. SWOT Analysis Strengths • Leader in high-end niche markets with growth potential • Strong activity in growing markets Weaknesses • Short technology life-cycle resulting in short product life cycle and the need to innovate. • The USD depreciation: 45% of sales and 35% of costs in USD related currencies. • R&D excellence as main differentiator • Broad patent portfolio Opportunities • Strong growth potential in several markets (AV, Healthcare, etc) • Further development in emerging markets Threats • Maturation nears in penetration Digital Cinema • Positioning in upcoming technologies • Technological opportunity misjudgement resulting in missing key technology or investing in unprofitable sectors • Price pressure from potential competitors • Local production reducing exposure to currency transactional risks Main shareholders: Free float 74.5%; Gimv 9.8%; Treasury shares 5.8%; Recommendation: Barco’s 1Q sales were a clear disappointment with a decrease of 12.3%. The increase of the EBITDA margin was a soothing factor, especially since it is unusual for Barco, given such a decrease. Therefore, we give management the benefit of the doubt and have only slightly decreased our estimates. With a FY P/E of 12, the share is still not expensive; hence we stick to our Accumulate rating. Our Target Price decreases from EUR 64.5 to EUR 64, our new DCF value. Templeton Investment Counsel 5.0%; Franklin Templeton Inv 4.9%; All share prices at 19/05/14. Target Price: EUR 64.00 FINANCIAL CALENDAR (Source: Precise) PRICE (SHORT & LONG AVERAGE) titre 70 65 23/07/14 Results 2014H1 23/07/14 Results 2014H1 23/07/14 Results 2014H1 60 55 50 45 40 BARCO SMALL & MID CAPS SELECTION Analyst(s) Bart Jooris, CFA +32 2 287 92 79 Bank Degroof [email protected] 35 30 Mar 11 Jun 11 Sep 11 Dec 11 Mar 12 Jun 12 Sep 12 Dec 12 Mar 13 Jun 13 Sep 13 Dec 13 Mar 14 Jun 14 Source : Factset 37 Finland SMALL & MID CAPS SELECTION EUR 34.67 Accumulate BASWARE BAS1V.HE/BAS1V FH Market capitalisation: EUR 445m Software & Computer Services EUR Sales (m) EBITDA (m) EBITDA margin EBIT (m) EBIT margin Net profit (reported) (m) Net profit (adj.) (m) Cash Flow from Ops.bef. chg in NWC (m) Net debt (Cash) (m) Net Debt/Equity Net Debt/EBITDA Interest cover (EBITDA/Fin. interest) ROCE (adj.) ROCE (adj.)/WACC EV / CE EV / Sales EV / EBITDA EV / EBIT P/E (adj.) P/BV OpFCF yield Dividend yield EPS (adj.) EPS (adj.) growth BVPS DPS Abs. Performances(12m,6m,3m,1m): 12 month High/low: EUR40.80 / 17.43 12/12 114 14.8 13.0% 8.3 7.3% 5.9 5.9 12.4 -24.0 -0.2 -1.6 nm 8.4% 1.1 3.1 2.0 15.6 27.8 44.1 2.6 -4.2% 1.1% 0.46 -39.4% 7.89 0.23 72.1% 12/13 123 10.4 8.4% 3.3 2.7% 2.6 2.6 9.7 -4.6 0.0 -0.4 nm 2.8% 0.4 3.4 2.5 30.1 93.7 nm 3.3 0.9% 0.7% 0.20 -55.8% 7.62 0.23 66.7% 12/14e 12/15e 132 143 17.8 26.2 13.5% 18.3% 10.6 19.0 8.0% 13.3% 8.5 15.0 8.5 15.0 15.7 22.2 -11.2 -21.7 -0.1 -0.2 -0.6 -0.8 nm nm 9.1% 16.1% 1.2 2.1 4.8 4.7 3.3 2.9 24.2 16.1 40.6 22.1 nm 29.7 4.3 3.9 3.2% 4.0% 0.9% 1.6% 0.66 1.17 nm 75.7% 7.99 8.79 0.30 0.55 5.9% 2.2% Avg. Daily nb traded shares:3,945 Main shareholders: Free float 70.7%; Mutual Pension Insurance Company Ilmarinen 11.3%; Sihvo Ilkka 6.8%; Eräkangas Kirsi 6.2%; All share prices at 19/05/14. Profile: Basware develops enterprise purchase to pay (P2P), electronic purchase and travelling expense management, and financial management solutions. The company has shown robust growth for a couple of years, but recent quarters have been difficult for it due to changes in the sales mix. For the period between 2011 and 2015, the company targets 15–30% growth, with the EBIT margin improving towards the end of the period, to 15–20%. Basware intends to become the leading e-invoice supplier in the world and to reach the threshold of 150 million transactions by 2015. SWOT Analysis Strengths • Able to produce good profits even under difficult macroeconomic conditions • Offers solutions that quickly lower customers' costs • Competitive: often competes with small local companies in areas that are not core fields for large ERP providers Opportunities • Co-operation with Mastercard • Outside the Nordic region e-invoicing has only taken baby steps • Exploitation of market growth potential especially with the SaaS service model • Several small competitors (e-invoicing operators) are lowprofit businesses: buyer's market in acquisitions • Investments needed in the distribution channel, problematic indirect/external distribution channel • Growth requires investment in business support services Threats • Large ERP providers increasing outlays in P2P, lowering prices • Fast growth may require more outlays in Basware's own distribution channel, resulting in a weak margin Recommendation: In the long term, Basware's investment case is appealing. The company operates in growing markets where it has a strong position. Several international reviewers have rated Basware's products among the best in the sector. Recent years have been tough for the company but we expect things to turn out better in 2014 when the current SaaS business model should start scaling up. Co-operation with Mastercard offers a unique new revenue source for Basware, with very limited additional costs. The sector’s M&A activity has been very good in recent years (SAP/Ariba, Tungsten/OB10, Lexmark/Readsoft). Target Price: EUR 42.00 FINANCIAL CALENDAR (Source: Precise) PRICE (SHORT & LONG AVERAGE) Weaknesses • Weak profitability at the moment titre 45 10/07/14 Results 40 30 25 Kimmo Stenvall 20 15 Mar 11 Source : Factset 38 2014Q2 BASWARE SMALL & MID CAPS SELECTION Analyst(s) 35 Jun 11 Sep 11 Dec 11 Mar 12 Jun 12 Sep 12 Dec 12 Mar 13 Jun 13 Sep 13 Dec 13 Mar 14 Jun 14 +358 10 252 4561 Pohjola [email protected] Germany SMALL & MID CAPS SELECTION EUR 40.35 Accumulate BAYWA BYWGa.DE/BYW6 GY Market capitalisation: EUR 1394m Food & Beverage EUR Sales (m) EBITDA (m) EBITDA margin EBIT (m) EBIT margin Net profit (reported) (m) Net profit (adj.) (m) Cash Flow from Ops.bef. chg in NWC (m) Net debt (Cash) (m) Net Debt/Equity Net Debt/EBITDA Interest cover (EBITDA/Fin. interest) ROCE (adj.) ROCE (adj.)/WACC EV / CE EV / Sales EV / EBITDA EV / EBIT P/E (adj.) P/BV OpFCF yield Dividend yield EPS (adj.) EPS (adj.) growth BVPS DPS Abs. Performances(12m,6m,3m,1m): 12 month High/low: EUR41.55 / 35.27 12/12 10,531 307 2.9% 187 1.8% 96.7 87.2 142 1,462 1.3 4.8 4.8 5.1% 0.8 0.6 0.2 5.3 8.7 12.8 1.3 7.6% 2.0% 2.54 62.8% 25.01 0.65 3.9% 12/13 12/14e 12/15e 15,958 16,204 17,010 360 355 368 2.3% 2.2% 2.2% 222 235 245 1.4% 1.4% 1.4% 98.2 112 121 90.2 112 121 129 231 274 1,671 1,613 1,567 1.4 1.3 1.1 4.6 4.5 4.3 6.7 5.7 6.1 5.1% 5.4% 5.5% 0.8 0.8 0.9 0.6 0.7 0.7 0.1 0.1 0.1 5.5 6.2 6.1 9.0 9.3 9.2 14.4 12.4 11.6 1.4 1.4 1.3 27.2% 6.2% 5.5% 1.9% 2.0% 2.2% 2.62 3.25 3.49 3.1% 24.0% 7.4% 26.46 28.96 31.65 0.75 0.80 0.90 2.9% -1.1% 0.9% Avg. Daily nb traded shares:43,390 Profile: BayWa is one of the global Top 10 traders in grains/oilseeds with strong roots in German origination. The acquisition of a majority in Turners&Growers in New Zealand boosted BayWa’s presence in the fruit trading market. This primarily opens the door to Asia while the acquisition in the Southern Hemisphere allows for fruit deliveries across the entire year. BayWa’s Renewable Energy Segment leverages the company’s customer base and financial strength. BayWa also holds No2 spot in the German Building Materials market, currently benefiting from strong construction activities. We expect BayWa to further improve the leverage of its ample elevator capacity in a (mostly) contango-shaped world of grain trading. Most recent acquisition of a Dutch grain trader is about to quintuple BayWa’s grain trading volume. SWOT Analysis Strengths • Top 10 in global grain trading£pv£ Top European fertilizer wholesaler • No 2 in German Building Materials Market Weaknesses • Group profitability and Return on Equity below peers • Structural weakness in Heating Oil Segment • Global footprint in grains via acquisitions • Solid balance sheet, Strong portfolio management Opportunities • Expanding acquired market position in Renewable Energy by leveraging financial firepower and customer base • Accelerated expansion into fast-growing Agri markets • Consolidating market position in fragmented Building Materials market • Implementing value-based steering Main shareholders: Free float 39.2% (0.0%); Bayerische Raiffeisen Beteiligungs AG 35.7%; Raiffeisen Agrar Invest GmbH 14.8%; Threats • Volatility in grain prices remains low • Farm economics and, hence, farmer’s ability to invest remain poor (weighs on Agro Trading / Equipment) • Turnaround in Building Materials no sustainable • Change in regulation in Renewables RWA Verbundservice 10.3%; All share prices at 19/05/14. FINANCIAL CALENDAR (Source: Precise) PRICE (SHORT & LONG AVERAGE) titre 42 40 07/08/14 Results 2014Q2 07/08/14 Results 2014Q2 Recommendation: Our PT of EUR 45 implies a target PE 14e of13.8x, recognizing around EUR 22 / share property value of the company. We recommend to ACCUMULATE BayWa on the back of the company’s ongoing transformation towards a global grain/oilseed trading house with strong roots in German origination. Further growth in in fruit and visible growth in the renewables asset segment are additional key drivers for BayWa’s performance. 38 36 Target Price: EUR 45.00 34 32 30 17/06/14 AGM 2013 17/06/14 AGM 2013 28 26 24 Mar 11 Source : Factset Jun 11 Sep 11 Dec 11 Mar 12 Jun 12 Sep 12 Dec 12 Mar 13 Jun 13 Sep 13 Dec 13 Mar 14 Jun 14 BAYWA SMALL & MID CAPS SELECTION Analyst(s) Michael Schaefer +49 69 58997 419 Equinet Bank [email protected] 39 Germany SMALL & MID CAPS SELECTION EUR 119.50 Buy BB BIOTECH BION.DE/BBZA GR Market capitalisation: EUR 1416m Financial Services PROFIT & LOSS (CHFm) BALANCE SHEET (CHFm) NAV Constituents & Total NAV (CHFm) Celgene Actelion Gilead Vertex Pharmaceuticals Novo Nordisk Incyte Isis Pharmaceuticals NAV others component Total Net Asset Value Discount/(Premium) to NAV Listed shareholdings on NAV OTHER ITEMS (CHFm) Total Market Cap Dividend Yield (Gross) PER SHARE DATA (CHF) NAVPS DPS 2012 2013 2014e 2015e 288.5 219.6 220.3 97.4 80.3 164.8 216.6 646.1 1,933.6 -20.9% 105.4% 289.1 302.4 259.3 105.4 18.3 242.7 335.1 955.4 2,507.7 -21.0% 101.0% 272.0 274.0 214.0 79.0 89.0 160.0 191.0 622.0 1,901.0 -15.0% 101.0% 272.0 274.0 214.0 79.0 89.0 160.0 191.0 622.0 1,901.0 -15.0% 101.0% 1,038.0 5.1% 1,671.6 4.8% 1,732.1 4.8% 1,732.1 4.8% 163.173 4.500 163.200 7.000 163.200 7.000 163.200 7.000 Profile: BB Biotech is a listed biotechnology investment company focussed on selecting the innovation leaders in the field of new drug development Source: Company, Equinet Bank estimates FINANCIAL CALENDAR (Source: Precise) PRICE (SHORT & LONG AVERAGE) titre 160 140 SWOT Analysis Strengths • Core holdings Weaknesses • M&A opportunities not part fo investment criteria • Experienced portfolio management team • Some investment opportunities are unavailabkle to BB Biotech • Persistent discount to NAV • Rigorous analytical approach • Thorough due diligence process Opportunities • Medical breakthroughs in indications where BB Biotech ahs exposure • Underserved therapeutic areas • Some investors may face restrictions to invest in BB Biotech Threats • Clinical development risk • Medical innovation may be driven by firms unsuitable as investments • Biotechnology sector eprformance Recommendation: The shares are suited to investors who wish to participate in the potentially significant upside associated with medical progress, but lack the extensive resources or expertise required to determine the likely winners. Key features include core holdings that account for more than half of the portfolio’s value in the aggregate and high exposure to the US biotechnology segment. Our rounded €156 price target is based on the assumption of a 17% discount to the NAV implied in consensus price targets and an EUR/CHF rate of 0.82. For more detail please refer to our in-depth fundamental report published on June 10, 2013. Target Price: EUR 156.00 120 100 80 60 40 Mar 11 Source : Factset 40 Jun 11 Sep 11 Dec 11 Mar 12 Jun 12 Sep 12 Dec 12 Mar 13 Jun 13 Sep 13 Dec 13 Mar 14 Jun 14 BB BIOTECH SMALL & MID CAPS SELECTION Analyst(s) Marietta Miemietz CFA +49-69-58997-439 Equinet Bank [email protected] France SMALL & MID CAPS SELECTION EUR 12.02 Buy BENETEAU CHBE.PA/BEN FP Market capitalisation: EUR 995m Hotels, Travel & Tourism EUR Sales (m) EBITDA (m) EBITDA margin EBIT (m) EBIT margin Net profit (reported) (m) Net profit (adj.) (m) Cash Flow from Ops.bef. chg in NWC (m) Net debt (Cash) (m) Net Debt/Equity Net Debt/EBITDA Interest cover (EBITDA/Fin. interest) ROCE (adj.) ROCE (adj.)/WACC EV / CE EV / Sales EV / EBITDA EV / EBIT P/E (adj.) P/BV OpFCF yield Dividend yield EPS (adj.) EPS (adj.) growth BVPS DPS Abs. Performances(12m,6m,3m,1m): 12 month High/low: EUR14.18 / 7.99 08/12 831 54.9 6.6% 0.2 0.0% -0.7 -0.7 49.6 -21.7 0.0 -0.4 38.8 -0.5% 0.0 1.7 1.0 14.8 nm nm 1.4 -8.4% 0.0% -0.01 -chg 5.94 0.00 50.3% 08/13 08/14e 08/15e 815 815 928 58.1 73.5 101 7.1% 9.0% 10.9% 1.0 13.2 33.5 0.1% 1.6% 3.6% 0.7 10.2 25.5 0.7 10.2 25.5 58.7 67.5 89.7 -9.9 -6.3 -8.1 0.0 0.0 0.0 -0.2 -0.1 -0.1 29.2 73.5 nm 0.1% 1.7% 4.3% 0.0 0.2 0.4 2.2 2.1 2.0 1.3 1.3 1.1 18.8 14.4 10.2 nm 80.2 30.9 nm nm 38.2 0.7 0.9 0.9 -3.0% -0.4% 1.7% 0.0% 0.8% 2.1% 0.01 0.13 0.31 +chg nm 150.9% 13.00 13.00 13.00 0.00 0.10 0.25 -7.5% 3.9% -2.6% Avg. Daily nb traded shares:14,462 Main shareholders: B‚ri 21 (family holding) 54.3% (62.0%); Free float 43.5% (38.0%); Treasury stock 2.1% (0.0%); All share prices at 19/05/14. FINANCIAL CALENDAR (Source: Precise) PRICE (SHORT & LONG AVERAGE) titre 15.0 Profile: Bénéteau has been building boats since 1884 and has almost 30% of global market share in sailing boats. Today, pleasure boating (76% of sales, or 38% excluding Europe) accounts for 76% of the group’s sales (Europe 62%; RoW 38%) and 86% of its earnings. The House division, 21% of sales (Mobile Homes 90%; Wooden-frame houses 10%), is a new division with a European leadership position in mobile homes. SWOT Analysis Strengths • Established brand in prepared meats and delicatessen products • Network of 1,500 dealers worldwide Weaknesses • Challenger in motor boats with 2% of market share with the target being >10% in 5 years • Absent in >70’ segment of motor boats • Recent industrial setup bringing productivity gains • Challenger to become an international boating company Opportunities • Excellent financial situation could theoretically make acquisitions possible in the Boats line • Entry in motor boats in Brazil, US and China Threats • The number of rings available in French ports which slow down market growth • A boat activity dependent on purchasing power • Opening up to top-of-the-range boats for clients with its Prestige and Monte Carlo motorboat brand • Increase in raw materials which are passed onto selling prices but could curb growth Recommendation: Usually negative, H1 2014 results are not significant due to the preponderance of billings in H2. Underlying operating loss of EUR31m vs a loss of EUR40m, driven by renewed profitability for the boats division. Hence, the net loss was less deep (-EUR18.1m vs -EUR24.5m). Management confirmed the buoyant trend for leisure boat markets outside Europe and maintained its guidance. The habitat division is streamlining and launching a new product. The Habitat division posted UOI at breakeven (vs EUR4.2m in H1-2013). The division continues its three-pronged redeployment plan: 1) increased integration upstream; 2) less cannibalisation between the two brands; and 3) streamlining the sales force and product line-up. Management also announced a new product that is a cross between a mobile home and a tent and set to be on offer for long-term rental as of September. The Boats division confirmed its annual earnings forecast, despite lower-than-expected business, EUR20m below management’s expectations (notwithstanding 35% growth in the US). This reflects tighter control of variable costs (margin improved 3pts vs 2013) and fixed costs (down EUR3m vs 2013), despite postponed purchases in emerging markets, where clients have not accepted the abrupt increase in prices (+20-30%). Target Price: EUR 16.50 14.0 13.0 12.0 BÉNÉTEAU SMALL & MID CAPS SELECTION Analyst(s) 11.0 10.0 9.0 8.0 7.0 Mar 11 Jun 11 Sep 11 Dec 11 Mar 12 Jun 12 Sep 12 Dec 12 Mar 13 Jun 13 Sep 13 Dec 13 Mar 14 Jun 14 Francis Prêtre +33 4 78 92 02 30 CM - CIC Securities [email protected] Source : Factset 41 Italy SMALL & MID CAPS SELECTION EUR 0.60 Accumulate BENI STABILI BNSI.MI/BNS IM Market capitalisation: EUR 1149m Real Estate EUR 12/12 196 183 88.2% (84) (134) (16) 47 49.93 2,217 4,051 3,086 0.02 0.02 0.86 (48.3%) 1.07 4.8% 4.9% 16.9 21 1.4 2,217 48.8% 10.4% 12/13 12/14e 12/15e 195 200 206 EBITDA (m) 175 180 186 EBITDA margin 85.5% 85.8% 85.9% Portfolio Result (m) (78) 3 4 Net Financial Result (134) (125) (123) Net Profit (reported)(m) (4) 54 63 Net Profit (adj.)(m) 42 55 63 Funds From Operations 41.60 54.33 63.10 Net Debt (m) 2,164 2,162 2,140 Portfolio Value (m) 3,963 3,973 3,973 Enterprise Value (m) 3,117 3,325 3,304 EPS (adj.) 0.02 0.03 0.03 DPS 0.02 0.02 0.02 IFRS NAVPS 0.94 0.95 0.96 Premium/(discount) (47.7%) (36.7%) (37.7%) EPRA NAVPS 1.05 1.05 1.05 Earnings adj. yield 3.3% 4.5% 5.2% Dividend yield 3.7% 3.7% 3.7% EV/EBITDA 17.8 18.4 17.7 P/E (adj.) 25 22 19 Int. cover(EBITDA/Fin.int) 1.3 1.4 1.5 Net debt/(cash) (m) 2,164 2,162 2,140 Net Debt/Total Assets 46.7% 46.4% 45.9% Abs. Performances(12m,6m,3m,1m): 16.5% -0.5% -6.0% 12 month High/low: EUR.66 / .46 Avg. Daily nb traded shares:3,445,347 Main shareholders: Fonciere des regions 52.5%; Free float 42.5%; Predica 5.0%; Gross Rental Income (m) All share prices at 19/05/14. FINANCIAL CALENDAR (Source: Precise) PRICE (SHORT & LONG AVERAGE) Profile: Beni Stabili is one of Italy’s leading property companies and has been listed since 1999. The Beni Stabili business model is based on a long-term strategy. The management is focused on acquiring property portfolios at competitive prices and manages these assets for a long period; during this period the investment portfolio is rented to reliable tenants. Beni Stabili's business model shows a low exposure to the real estate cycle; the company's income is protected during a property downturn by long lease terms, quality tenants and high occupancy rate. At the end of 2013 Beni Stabili’s NNNAV, based on the market value of its properties, was EUR 0.955/sh on a fully diluted basis. SWOT Analysis Strengths • Reliable and quality tenants Weaknesses • No reversionary potential in the short-medium term • Long term rental agreements • High cost of debt • 95% of Beni Stabili’s total debt is hedged • Real estate prices in Italy are under pressure Opportunities • Consolidation in the sector Threats • Increase in the cost of debt • Completion of large development projects in Milan • Higher vacancy • Change in SIIQ law Recommendation: Beni Stabili portfolio is worth EUR 4.15bn with an average yield of 5.5% and is booked, on average, at EUR 2,176 per sqm, a cheap valuation if we consider that 50% of the company’s portfolio is located in Milan and Rome. The present 37% discount on NNNAV implies a valuation of around EUR 1,750 per sqm. In 2013 the company signed 27 closings for a gross selling price of EUR 134.1m (5.3% exit yield and 2.9% capital gain) and 9 preliminaries for a gross selling price of EUR 37.8m (5.4% exit yield and 0.1% capital gain) without incurring losses. At the end of 2013 Beni Stabili’s net debt was EUR 2.16bn. The company’s loan-to-value ratio was 49.9% while 96.9% of Beni Stabili’s total debt is hedged with a weighted average hedging duration of 3.6 years. The weighted average debt maturity was 3.78 years and theweighted cost of debt was 4.56% in 2013 vs 4.62% in 2012%. In 2010 Beni Stabili managed to achieve the SIIQ status (Italian REIT) which provides for a total tax exemption on rental fees. titre 0.80 The company issued EUR 350m of senior unsecured notes (maturity in 2018 with a coupon of 4.125%) in mid January sizeably lengthening its debt duration. 0.75 0.70 0.65 Valuation: we have valued Beni Stabili with a DCF model assuming a 6.83% WACC (5.0% cost of debt and 8.9% cost of equity) and a 2% perpetual growth rate. Our valuation implies a P/NNNAV of 0.7x on a NNNAV per share of EUR 0.955/sh. We confirm our Accumulate rating and target price of EUR 0.70/sh. 0.60 0.55 0.50 0.45 0.40 0.35 Target Price: EUR 0.70 0.30 0.25 Mar 11 Jun 11 Sep 11 Dec 11 Mar 12 Jun 12 Sep 12 Dec 12 Mar 13 Jun 13 Sep 13 Dec 13 Mar 14 Jun 14 Source : Factset Analyst(s) Francesco Sala 42 Banca Akros +39 02 4344 4240 [email protected] Netherlands SMALL & MID CAPS SELECTION EUR 11.62 Buy BESI BESI.AS/BESI NA Market capitalisation: EUR 438m Technology Hardware & Equipment EUR Sales (m) EBITDA (m) EBITDA margin EBIT (m) EBIT margin Net profit (reported) (m) Net profit (adj.) (m) Cash Flow from Ops.bef. chg in NWC (m) Net debt (Cash) (m) Net Debt/Equity Net Debt/EBITDA Interest cover (EBITDA/Fin. interest) ROCE (adj.) ROCE (adj.)/WACC EV / CE EV / Sales EV / EBITDA EV / EBIT P/E (adj.) P/BV OpFCF yield Dividend yield EPS (adj.) EPS (adj.) growth BVPS DPS Abs. Performances(12m,6m,3m,1m): 12 month High/low: EUR12.33 / 7.09 12/12 274 33.3 12.2% 20.8 7.6% 15.8 15.8 22.0 -79.5 -0.3 -2.4 12/13 254 31.7 12.5% 18.7 7.3% 15.9 15.9 25.0 -72.7 -0.3 -2.3 8.6% 0.7 0.8 0.5 4.1 6.6 13.8 0.8 10.5% 5.2% 0.42 -43.2% 7.05 0.30 53.4% 12/14e 292 50.6 17.3% 36.1 12.4% 30.8 30.8 40.4 -85.4 -0.3 -1.7 12/15e 336 65.7 19.6% 50.2 14.9% 42.6 42.6 55.1 -97.5 -0.3 -1.5 7.4% 13.9% 17.4% 0.6 1.2 0.2 1.2 1.8 1.6 0.9 1.2 1.0 7.4 7.0 5.2 12.5 9.8 6.8 19.4 14.2 10.3 1.2 1.5 1.4 0.8% 4.4% 4.3% 2.6% 2.6% 3.0% 0.42 0.82 1.12 0.6% 93.1% 37.7% 7.09 7.69 8.60 0.30 0.30 0.35 47.0% 29.7% 6.2% Avg. Daily nb traded shares:41,331 Main shareholders: Free float 53.8%; TWE Beheer BV 13.9%; D. Lindenbergh 6.6% (6.3%); Aviva 6.3% (6.6%); Darlin 5.9%; Project Holland 5.3%; J. van Caldenborgh 5.0%; Kempen Oranje Participaties 4.1%; Via Finis 3.2%; All share prices at 19/05/14. FINANCIAL CALENDAR (Source: Precise) PRICE (SHORT & LONG AVERAGE) Profile: Besi is one of the leading players in the market for semiconductor back-end equipment. This means that Besi makes machines for the assembly and packaging of chips. The company has a broad portfolio with the main activities being equipment for die bonding, attach and molding. The acquisition of Esec in 2009 (at highly attractive terms) has been a turning point in the company’s history, as it brought scale, leadership in one of the key market segments (die bonding). SWOT Analysis Strengths • One of the largest players in back-end equipment Weaknesses • High staff expenses • Leadership in selected segments such as die bonding • Weak after sales • Focus on innovation (flip chip, advanced packaging) • Market leader but still relatively low market share • Highly fragmented dealership network Opportunities • Weakness of competition, M&A opportunities Threats • Rolling out the general Stern Universeel format • New regulation • Increasing oil prices • Geographical expansion • New regulation • Improvement of public transport Recommendation: While the most appealing technology shifts in semi equipment manufacturing are usually captured by the front-end, we expect that the Back End will become more prominent. Form factor is getting more and more important and Besi has a strong position in packages for smaller shaped chips with its Flip Chip machines and also in the new growth segment Thermo Compression Bonders (TCB). Besi’s share price has had a good run recently. But we believe that there is more to come due to the better growth prospects. Target Price: EUR 13.00 t i t re 13 12 11 10 BESI SMALL & MID CAPS SELECTION Analyst(s) 9 8 7 6 Edwin de Jong 5 4 Mar 11 Jun 11 Sep 11 Dec 11 Mar 12 Jun 12 Sep 12 Dec 12 Mar 13 Jun 13 Sep 13 Dec 13 Mar 14 +312 0 5508569 SNS Securities [email protected] Jun 14 Source : Factset 43 Netherlands SMALL & MID CAPS SELECTION EUR 8.49 Hold BINCKBANK BINCK.AS/BINCK NA Market capitalisation: EUR 630m Financial Services EUR 12/12 12/13e 12/14e 12/15e Total Revenue (m) 49.8 187 184 183 Pre-Provision Profit (PPP) (m) 15.9 38.3 35.6 14.1 Loan Impairment Charge (m) Operating profit (OP) (m) 15.9 38.3 35.6 14.1 Earnings before tax (m) 15.8 38.3 35.6 14.1 Net profit (reported) (m) 11.1 29.1 30.5 14.3 Net profit (adj.) (m) 18.9 57.1 45.0 45.0 Shareholders equity (m) 420 402 355 355 Tier 1 Ratio 12.0% 13.1% 13.0% 0.0% Cost/Income ratio 68.1% 80.1% 81.7% 93.4% ROE (adj.) 4.5% 14.2% 12.7% 12.7% NPL ratio (gross) 0.0% 0.0% 0.0% 0.0% NPL coverage 0.0% 0.0% 0.0% 0.0% LIC/Avg. RWA P/Pre-Provision Profit per Share 28.5 14.9 17.7 44.6 P/E (adj.) 23.9 10.0 11.8 16.0 P/BV 1.1 1.4 1.8 1.8 P/NAV 1.7 2.3 3.6 nm Dividend yield 1.5% 4.5% 4.2% 3.1% PPPPS 0.22 0.52 0.48 0.19 EPS (adj.) 0.26 0.77 0.72 0.53 EPS (adj.) growth -70.5% 196.2% -6.4% -26.5% BVPS 0.00 5.43 5.12 0.03 NAVPS 3.67 3.36 2.39 -2.03 DPS 0.13 0.39 0.36 0.27 Abs. Performances(12m,6m,3m,1m): 19.4% 12.0% 3.1% 7.0% 12 month High/low: EUR8.78 / 6.23 Avg. Daily nb traded shares:147,565,000 Main shareholders: Free float 55.9%; Delta Lloyd N.V. 10.2%; Delta Lloyd Asset Management 9.4%; Profile: BinckBank is an online broker targeting retail and professional clients, with activities in the Netherlands, Belgium, France and Italy. The rationale behind the foundation of the online broker was to offer private investors the same trading possibilities as professional investors at extremely low fees. Currently, BinckBank has a dominant market share of approximately 50% with respect to transaction volume and the number of brokerage accounts in the Netherlands. SWOT Analysis STRENGTHS Brand name Higher than average active clients Innovative Flexible infrastructure OPPORTUNITIES Offering equity research and advice free of charge in order to keep the level of transactions high Targeting new client segments Winning new BPO contracts Expansion into new geographies (Italy) Derivatives trading via TOM on Euronext platform WEAKNESSES Dependency on Dutch market Integration risk Highly reliant on volatility levels THREATS Price wars General exposure to economic climate and market volumes Large banks in play for market share Operational deficiencies Financial transaction tax Recommendation: We anticipate that BinckBank is facing several short term and long term triggers which could have beneficial implications for the company. In particular, the growth of Professional Services is moving in favour of BinckBank. Based on these expectations and an attractive valuation we rate the stock a Buy with a target price of EUR 7.20. Target Price: EUR 7.20 Oppenheimerfunds 5.8%; Navitas BV 5.1%; Boron Investments 5.1%; All share prices at 20/05/14. BINCKBANK SMALL & MID CAPS SELECTION Analyst(s) Lemer Salah FINANCIAL CALENDAR (Source: Precise) PRICE (SHORT & LONG AVERAGE) t i t re 12 11 10 9 8 7 6 5 Mar 11 Source : Factset 44 Jun 11 Sep 11 Dec 11 Mar 12 Jun 12 Sep 12 Dec 12 Mar 13 Jun 13 Sep 13 Dec 13 Mar 14 Jun 14 '+312 0 5508516 SNS Securities [email protected] Germany SMALL & MID CAPS SELECTION EUR 83.09 Hold BIOTEST BIOG_P.DE/BIO3 GR Market capitalisation: EUR 1089m Healthcare EUR Sales (m) EBITDA (m) EBITDA margin EBIT (m) EBIT margin Net profit (reported) (m) Net profit (adj.) (m) Cash Flow from Ops.bef. chg in NWC (m) Net debt (Cash) (m) Net Debt/Equity Net Debt/EBITDA Interest cover (EBITDA/Fin. interest) ROCE (adj.) ROCE (adj.)/WACC EV / CE EV / Sales EV / EBITDA EV / EBIT P/E (adj.) P/BV OpFCF yield Dividend yield EPS (adj.) EPS (adj.) growth BVPS DPS Abs. Performances(12m,6m,3m,1m): 12 month High/low: EUR98.20 / 50.60 12/12 440 76.1 17.3% 44.7 10.1% 23.0 23.0 73.7 55.2 0.1 0.7 8.3 5.9% 0.6 1.3 1.6 9.2 15.6 25.0 1.6 5.2% 0.0% 1.97 23.1% 31.49 0.00 49.9% 12/13 12/14e 12/15e 501 552 606 85.6 92.8 116 17.1% 16.8% 19.1% 53.8 60.0 80.6 10.7% 10.9% 13.3% 32.0 39.9 55.0 32.0 39.9 55.0 86.4 107 123 -128 -151 -183 -0.3 -0.3 -0.3 -1.5 -1.6 -1.6 12.2 30.9 57.9 6.3% 6.9% 8.4% 0.6 0.7 0.8 1.5 1.7 1.5 1.8 1.8 1.6 10.4 10.9 8.5 16.5 16.8 12.2 29.6 27.5 19.9 2.1 2.2 2.0 -3.5% 4.5% 6.0% 0.0% 0.0% 0.6% 2.57 3.03 4.17 30.7% 17.8% 37.8% 36.97 37.51 41.11 0.00 0.00 0.50 23.2% -4.5% -4.2% Avg. Daily nb traded shares:20,030 Profile: Biotest operates three business units: Therapy (c. 75% of sales) focuses on plasma-derived proteins like IVIG, clotting factors and albumin; it also comprises a pipeline of therapeutic antibodies. Plasma & Services (c. 22% of sales) comprises toll manufacturing of plasma proteins & the sale of blood plasma.. SWOT Analysis Strengths • Resilient plasma protein base business: high production yields, double-digit EBIT margin • Strong position in the lucrative niche of hyper-immune globulins. • Tregalizumab (BT-061) partnership with the leading rheumatoid arthritis player, AbbVie Weaknesses • Currently under-represented in the lucrative US IVIG market (entry as recently as Feb 2013). • Modest size implies limited scope for economies of scale with respect to the IVIG business, although we note significant incremental towardsits the endin of the • Unlike peers, Biotest iscapacity not evaluating IVIGs Alzheimer’s disease, thus limiting the upside (but also the risk). Opportunities • Bivigam, launched in the US in February, has US peak sales potential of ca. $100m. • Further geographic expansion, notably re-entry of the Chinese market with Albiomin expected next year. • Rich plasma protein pipeline, with peak sales potential of €0.4bn and €0.2bn before and after risk adjustment, •respectively. Budding therapeutic antibody pipeline, with three potential blockbusters in clinical development Threats • IVIG pricing pressure in Europe may continue and may periodically worsen as and when peers add capacity. • Coagulation factor franchise is largely ex-growth and pressures may intensify further. • Clinical and regulatory delays to pipeline projects, including Albiomin for the Chinese market. Main shareholders: Free float 67.0% (41.0%); OGEL 24.0% (50.0%); KSK Biberach 9.0%; Recommendation: We recommend accumulating the shares based on our DCF-derived price target. All share prices at 19/05/14. Target Price: EUR 93.50 FINANCIAL CALENDAR (Source: Precise) PRICE (SHORT & LONG AVERAGE) titre 100 12/08/14 Results 90 80 2014Q2 BIOTEST SMALL & MID CAPS SELECTION Analyst(s) Marietta Miemietz CFA +49-69-58997-439 Equinet Bank [email protected] 70 60 50 40 30 Mar 11 Jun 11 Sep 11 Dec 11 Mar 12 Jun 12 Sep 12 Dec 12 Mar 13 Jun 13 Sep 13 Dec 13 Mar 14 Jun 14 Source : Factset 45 Belgium SMALL & MID CAPS SELECTION EUR 234.25 Reduce BOIS SAUVAGE CBOS.BR/COMB BB Market capitalisation: EUR 370m Financial Services PROFIT & LOSS (EURm) Revenues Non Recurrent Items Net Profit (reported) BALANCE SHEET (EURm) Shareholders Equity Minorities equity Net Debt NAV Constituents & Total NAV (EURm) Treasury portfolio Cofinimmo Oth. real estate Strategic Finance Neuhaus Recticel Other assets Net cash/(debt) position Total Net Asset Value Discount/(Premium) to NAV Listed shareholdings on NAV OTHER ITEMS (EURm) Total Market Cap Debt / Equity Payout Ratio P/BV Dividend Yield (Gross) PER SHARE DATA (EUR) EPS (reported) NAVPS BVPS DPS 2011 17.4 8.9 31.1 2012 15.4 -4.8 16.4 2013 11.6 6.3 -1.4 2014e 369.2 14.9 71.0 350.1 16.6 62.0 318.1 18.7 53.2 16.7 27.8 84.9 73.1 171.0 38.5 102.3 -71.0 443.4 -41.7% 40.4% 9.6 0.0 87.5 66.4 200.5 44.0 107.0 -62.0 453.0 -33.3% 36.1% 10.1 0.0 62.2 69.8 219.0 47.1 101.4 -53.2 456.3 -25.8% 43.1% 11.4 0.0 53.2 69.8 219.0 59.8 99.3 -42.5 469.9 -20.9% 32.6% 223.1 19.2% 162.1% 0.6 22.6% 300.9 17.7% 67.3% 0.9 3.7% 337.2 16.7% nm 0.9 3.1% 369.8 19.735 280.000 234.360 32.000 10.405 286.400 222.239 7.000 -0.891 288.480 229.505 7.280 3.2% 296.225 7.480 Source: Company, Bank Degroof estimates Main shareholders: Entr. Et Chemins de fer en Chine 43%, Guy Paquot/Fingaren 6% FINANCIAL CALENDAR (Source: Precise) PRICE (SHORT & LONG AVERAGE) titre 240 230 220 210 200 190 180 Profile: Compagnie du Bois Sauvage (COMB) is a holding company with a stable “family” main shareholder. It wants to concentrate on a limited number of participations, mainly industrial, to which it wishes not only to influence the choice of management and strategic orientations, but also to provide support to operational management and help in financial management. Vigilant with regards to the interest of its own shareholders, Bois Sauvage requires a recurring income from its investments in order to allow the distribution of a (if possible steadily growing) dividend. SWOT Analysis Strengths • Outstanding performance in recent years of Neuhaus (100% stake) and Berenberg Bank (12% stake) • Focused portfolio with 2 majore shareholdings that account for over 50% of GAV • Only limited capital gains taxes in Belgium Opportunities • Hidden value at the level of private equity (Neuhaus, Berenberg Bank, Noel Group…) • Turnaround of Recticel or change of control of the company. • Value creation in dormant property portfolio in Belgium (plots of lands). • Disposal of US real estate activities could be NAV enhancing Weaknesses • Lack of scale vs. Belgian peers and very low deal flow which casts some doubts on the strategy going forward • Limited visibility on the performance of private equity participations • Corporate governance peculiarities: the company is managed directly by its BoD • Poor track-record of Recticel and mixed performance of Noel Group in recent years Threats • Vulnerable to changes in stock market sentiment and impact holding company discount to NAV volatility • Uncertainty about future changes to tax legislation for holding companies in Belgium • Cash drag on return. Proceeds from cash have a negative impact on ROE. Recommendation: Although COMB is not the “pure-play” investors often are looking for, the portfolio of this holding company contains some assets which could entice long term value investors that at the same time are looking for yield. Why? Because of its present valuation and of its trophy asset Neuhaus. After all, COMB offers an indirect way to invest in the famous Belgian manufacturer of luxury chocolate Neuhaus, next to a shareholding the renowned German private bank Berenberg. We slightly revised our valuation of Neuhaus and Berenberg (together 60% of NAV) and computed a NAV of EUR 481m. Our EUR 217 TP implies an downward potential of 7%. Our adjusted NAV estimate is computed after “in the money” dilution. We assess the current -25% discount as rather low, when compared to the 5years historical average for COMB of -33% and the present market cap weighted average discount of Belgian peers (-25%). 170 160 Target Price: EUR 217.00 150 140 130 Mar 11 Source : Factset 46 Jun 11 Sep 11 Dec 11 Mar 12 Jun 12 Sep 12 Dec 12 Mar 13 Jun 13 Sep 13 Dec 13 Mar 14 Jun 14 Analyst(s) Hans D'Haese Bank Degroof +32 (0) 2 287 9223 [email protected] Spain SMALL & MID CAPS SELECTION EUR 31.15 Buy BOLSAS Y MERCADOS ESPANOLES SA BME.MC/BME SM Market capitalisation: EUR 2605m Financial Services EUR Sales (m) EBITDA (m) EBITDA margin EBIT (m) EBIT margin Net profit (reported) (m) Net profit (adj.) (m) Cash Flow from Ops.bef. chg in NWC (m) Net debt (Cash) (m) Net Debt/Equity Net Debt/EBITDA Interest cover (EBITDA/Fin. interest) ROCE (adj.) ROCE (adj.)/WACC EV / CE EV / Sales EV / EBITDA EV / EBIT P/E (adj.) P/BV OpFCF yield Dividend yield EPS (adj.) EPS (adj.) growth BVPS DPS Abs. Performances(12m,6m,3m,1m): 12 month High/low: EUR32.80 / 18.51 12/12 296 197 66.6% 189 64.0% 136 136 138 -349 -0.8 -1.8 nm 113% 11.9 10.1 4.0 6.0 6.3 11.4 3.7 7.8% 8.7% 1.62 -12.6% 4.93 1.60 55.8% 12/13 12/14e 12/15e 308 340 380 209 239 276 67.8% 70.2% 72.8% 201 230 266 65.4% 67.6% 70.1% 143 163 189 143 163 189 145 166 192 -317 -530 -650 -0.8 -1.3 -1.6 -1.5 -2.2 -2.4 nm nm nm 126% 136% 158% 13.3 14.4 16.6 17.8 17.5 16.5 6.5 6.1 5.1 9.6 8.7 7.1 9.9 9.0 7.3 16.2 16.0 13.8 5.9 6.5 6.4 5.5% 6.0% 7.0% 5.3% 5.9% 6.9% 1.71 1.95 2.26 5.6% 13.9% 15.9% 4.69 4.79 4.90 1.65 1.85 2.15 16.0% 3.3% 4.3% Avg. Daily nb traded shares:673,501 Main shareholders: Free float 96.6%; B Santander 3.4%; Profile: Bolsas y Mercados Españoles (BME) runs all Spanish stock and financial markets (equity, fixed income, derivatives, etc.). Since July 2006 BME has been a listed company as well as an IBEX35 constituent. In 2013 BME reiterated its leadership in terms of efficiency (C/I: 32.2%) and profitability (Roe: 35.9%). BME is a diversified company structured into seven business-units (reorganised in 2014): i) Equities (50% w/Ebitda); ii) Settlement (26% w/Ebitda); iii) Information (10% w/Ebitda); iv) Clearing (5% w/Ebitda); v) Fixed Income (3.2% w/Ebitda); vi) Derivatives (2.9% w/Ebitda) & vii) IT & Consulting (1.7% w/Ebitda). The main risk for BME is the threat of alternative platforms (last April’14 BATS claimed a 14.9% market share in the Spanish market vs. 12.6% a year ago). 1Q’2014 Earnings: EBITDA (EUR60.9m) increased 17.8%Y/Y based on: i) the 17.5% Y/Y rise in equity trading and ii) operating cost under control remaining almost flat. Efficiency: quarterly operating expenses (EUR25.12m) fell 0.2% Y/Y, which is within BME’s strategy pointing to these costs growing below CPI rate. At 1Q’14 BME’s C/I ratio reached 29.2% vs. 34.5% in 1Q’13. The improvement partially came from reducing personnel by 27 employees (-3.4% Y/Y decrease in the total workforce). Performance of operating costs also helps EBITDA reach 70.8% improving vs. 69.7% in 4Q’13 and 65.5%, a year ago. Profitability: With ROE at 41.1%, this is another indicator performing well above the 31% at 1Q’13. SWOT Analysis Strengths • Best in class C/I (29.2%), allowing BME to face shrinking fees and retain strong ROE. • Outstanding market depth and liquidity for all Spanish large caps. • Net cash: + EUR270m & stable cash dividend FINANCIAL CALENDAR (Source: Precise) PRICE (SHORT & LONG AVERAGE) titre 34 01/08/14 Results 32 30 28 26 2014Q2 • High dependence in equity trading and related business (+65%/70% of revenue) and EBITDA. • Limited to increase product catalogue due to conservative financial culture. • Solid ROE 41% (no negative quarterly results in 10y) Opportunities • To develop product diversification with local opportunities like MAB (S&M caps listings), etc. • Consultancy services in developing markets. • New Clearing & Settlement business, CCP. All share prices at 19/05/14. Weaknesses • Relative small player & vulnerable to attacks. Threats • Regulatory: transaction tax & short selling bans. • Alternative platforms, MTFs (Chi-x, etc.) and global competition and integration. • Risk aversion due to volatile debt markets Recommendation: BME is under sound a position to reap the profits from a low costs base and the recovery of equity trading in the stock exchange. During the economic cycle downturn, BME did not report a single quarter with a “profit” below EUR30m. Also, BME is a free debt company that makes this company a cash cow producer. For 2014 we expect a DPS of EUR1.71, currently yielding 5.5% (vs EUR1.65/sh in 2013). Buy Reiterated. 24 Target Price: EUR 34.95 22 20 Analyst(s) 18 16 14 Mar 11 Jun 11 Sep 11 Dec 11 Mar 12 Jun 12 Sep 12 Dec 12 Mar 13 Jun 13 Sep 13 Dec 13 Mar 14 Jun 14 Javier Bernat BEKA Finance +34 91 436 7816 [email protected] Source : Factset 47 France SMALL & MID CAPS SELECTION EUR 22.19 Accumulate BONDUELLE BOND.PA/BON FP Market capitalisation: EUR 710m Food & Beverage EUR Sales (m) EBITDA (m) EBITDA margin EBIT (m) EBIT margin Net profit (reported) (m) Net profit (adj.) (m) Cash Flow from Ops.bef. chg in NWC (m) Net debt (Cash) (m) Net Debt/Equity Net Debt/EBITDA Interest cover (EBITDA/Fin. interest) ROCE (adj.) ROCE (adj.)/WACC EV / CE EV / Sales EV / EBITDA EV / EBIT P/E (adj.) P/BV OpFCF yield Dividend yield EPS (adj.) EPS (adj.) growth BVPS DPS Abs. Performances(12m,6m,3m,1m): 12 month High/low: EUR22.19 / 17.17 06/12 1,767 133 7.5% 98.2 5.6% 46.7 49.5 110 631 1.3 4.7 4.8 6.5% 0.9 1.0 0.7 8.8 12.0 10.6 1.1 -8.7% 2.3% 1.57 15.7% 15.23 0.38 20.1% 06/13 06/14e 06/15e 1,896 1,955 2,100 149 189 209 7.9% 9.7% 10.0% 103 105 120 5.4% 5.4% 5.7% 52.1 46.5 57.5 54.1 46.5 57.5 124 151 158 607 609 581 1.2 1.1 1.0 4.1 3.2 2.8 4.9 6.3 7.5 6.8% 5.3% 6.1% 0.9 0.8 0.9 1.1 1.1 1.1 0.6 0.7 0.6 8.0 7.2 6.3 11.6 12.9 11.0 10.7 15.0 12.1 1.2 1.3 1.2 -6.2% 0.9% 6.1% 1.8% 1.8% 1.8% 1.72 1.48 1.83 9.3% -14.0% 23.7% 15.87 16.64 17.97 0.40 0.40 0.40 18.7% 12.7% 8.5% Avg. Daily nb traded shares:26,494 Main shareholders: Bonduelle family 60.0%; Free float 32.0%; Employees and treasury stock 8.0%; All share prices at 19/05/14. FINANCIAL CALENDAR (Source: Precise) PRICE (SHORT & LONG AVERAGE) titre 23.0 22.0 Profile: European leader in prepared vegetables: 1) tinned foods (47% of sales), in which it is European leader (29% market share) in a market where shipments are steady; 2) frozen foods (24% of sales), number two (12% market share) behind Unilever in a slowing market; and 3) fresh-cut products (28% of sales, covering chilled and delicatessen products), which are experiencing strong growth. SWOT Analysis Strengths • European leadership in processed vegetables Weaknesses • Dependence on supermarket food retail in Europe • A strong and European brand that can be rolled out in all • Significant capital intensity in conserves, which hampers the development of the product line vegetable segments • Improved margins • Becoming a large actor in Americas Opportunities • Enter supermarket food retail in emerging markets Threats • Climate effect • More acquisitions in USA (after Allens) and Europe • Weight of sales dollar • Level of consumer in CEE Recommendation: Bonduelle’s H1 2014 results for the period ending 31 Dec. 2013 show strong operating profit growth to EUR56.2m (EUR53m CM-CIC) vs EUR52.2m, +7.5%. The operating margin climbed to 5.7% from 5.3%. Financial debt fell EUR117.6m to EUR696.3m. The group adjusted its organic top-line growth to +4% (EUR1,970m/EUR1,980m) and raised the level of organic UOI to EUR106m/EUR107m (from flat at EUR105m). As H1 revenues climbed only +0.9% (+4.9% organic) the +7.5% UOI is somewhat surprising. The Canned division, which generates the bulk of the group’s earnings, maintained its momentum with organic top-line growth of +8.5% (+5.5% on the actual structure), which explains this performance. The international activity was the biggest driver of growth and earnings as the margin rose 110bp in organic terms to 11.3%. Management factors in a less profitable H2 owing to costs from the summer 2013 campaigns and an increase in A&P. While we consider the guidance on organic evolution to be reasonable, we are more cautious overall given the threat posed by currencies (especially the rouble and the real). 21.0 Target Price: EUR 22.50 20.0 19.0 18.0 17.0 Analyst(s) 16.0 15.0 Mar 11 Source : Factset 48 Jun 11 Sep 11 Dec 11 Mar 12 Jun 12 Sep 12 Dec 12 Mar 13 Jun 13 Sep 13 Dec 13 Mar 14 Jun 14 Francis Prêtre CM - CIC Securities +33 4 78 92 02 30 [email protected] France SMALL & MID CAPS SELECTION EUR 23.84 Buy BOURBON GPBN.PA/GBB FP Market capitalisation: EUR 1777m Oil Services EUR Sales (m) EBITDA (m) EBITDA margin EBIT (m) EBIT margin Net profit (reported) (m) Net profit (adj.) (m) Cash Flow from Ops.bef. chg in NWC (m) Net debt (Cash) (m) Net Debt/Equity Net Debt/EBITDA Interest cover (EBITDA/Fin. interest) ROCE (adj.) ROCE (adj.)/WACC EV / CE EV / Sales EV / EBITDA EV / EBIT P/E (adj.) P/BV OpFCF yield Dividend yield EPS (adj.) EPS (adj.) growth BVPS DPS Abs. Performances(12m,6m,3m,1m): 12 month High/low: EUR24.36 / 18.00 12/12 1,187 406 34.2% 162 13.6% 41.9 41.9 322 2,061 1.5 5.1 5.7 3.3% 0.5 1.1 3.2 9.4 23.7 33.6 1.0 -5.4% 3.4% 0.56 nm 18.09 0.82 19.8% 12/13e 12/14e 12/15e 1,312 1,443 1,587 437 399 448 33.3% 27.6% 28.2% 164 180 214 12.5% 12.4% 13.5% 115 146 148 19.5 102 148 415 394 411 1,610 991 535 1.1 0.6 0.3 3.7 2.5 1.2 5.3 8.7 15.4 4.4% 5.8% 7.7% 0.5 0.6 0.8 1.1 1.3 1.3 2.7 2.3 1.7 8.0 8.5 6.2 21.3 18.8 13.0 nm 17.5 12.0 1.1 1.2 1.2 -4.0% 0.1% 9.8% 4.2% 4.8% 5.5% 0.26 1.36 1.99 -53.4% nm 46.0% 18.79 19.75 20.59 1.00 1.15 1.30 22.0% 11.8% -0.1% Avg. Daily nb traded shares:115,977 Main shareholders: Free float 56.9% (59.2%); Jaccar 26.1% (27.2%); Mach-Invest 7.7% (8.1%); Pleyel Investissements 5.3% (5.5%); Treasury shares 4.0% (0.0%); All share prices at 19/05/14. FINANCIAL CALENDAR (Source: Precise) PRICE (SHORT & LONG AVERAGE) titre 28 26 24 22 03/06/14 Dividend Payment 2013 29/05/14 Ex Dividend Date 2013 Profile: Bourbon’s maritime services include Offshore - logistics for oil-drilling & oil-producing platforms, with a focus on the deepwater niche and provision of state-of-the-art vessels for shallow waters, and Subsea Services (mainly Inspection, Repair and Maintenance of subsea installations). These are two strong-growth segments. Bourbon’s 2015 Strategic Leadership Plan allows for USD1.5bn in investments between 2012 and 2015 to build 100 extra vessels. With 520 operated vessels by end-2015, Bourbon will once again have doubled its size between 2010 and 2015. Bourbon is both the most aggressive player in the sector and the best protected thanks to its modern, state-of-the-art vessels, long-term contract policy and local JVs maximising local workforce content. Burdened by heavy debt, Bourbon announced a major change in strategy during the presentation of its 2012 results. In 2013 and 2014, the group plans to sell one-third of its fleet, both recent and under construction (AHTS+PSV+IMR), to investors for USD2.5bn and lease back these vessels for 10-year periods. This has already allowed Bourbon to reduce its debt by USD450m. SWOT Analysis STRENGTHS Technical know-how in offshore, with global sourcing of crews Constitution of barriers to entry in Offshore by forming links with local players (Angola, Nigeria, Mexico, Qatar and India, etc.) on markets where being local is a decisive factor Long-term, high-margin contracts (over 15 months) Fleet of modern ships lower clients’ costs Sale and long-term lease of 1/3 of PSV & AHTS fleet helps reduce debt OPPORTUNITIES Need to replace global ageing offshore continental fleet with modern vessels More segmentation, quality of customer service Lower costs (building long series of ships in China) Increase share of costs in USD (vessel leases + centralised maintenance & repair costs) Target Price: EUR 27.30 18 16 Source : Factset THREATS Excessive supply of deepwater offshore vessels (PSVs) partially offset by focusing capex on smaller vessels Risk of downturn in cycle leading to lower oil prices, industry capex and daily rates while fixed rental costs have increased Recommendation: Bourbon’s sale and leaseback operations will: 1) significantly improve Bourbon's ROCE (EBITDA/CE) to 24% compared with its previous target of 20%; 2) significantly lower its net debt (but there are off-balance sheet commitments); and 3) better reflect the value of its fleet. Jaccar’s offer on Bourbon at EUR24 per share does not reflect the fair value of the company or its fleet. This is even more the case as Bourbon’s debt is being reduced rapidly and the company is set to announce a new, bold strategic plan before the end of the year. We estimate the fair value of the stock between EUR27 (DCF) and EUR30.8 (restated NAV). 20 14 Mar 11 WEAKNESSES High exposure of earnings to dollar weakness, as Bourbon generates 70% of its revenues in USD but has only 30% of its costs in the same currency Sensitivity of EBITDAR margins to utilisation rate and availability rate of the fleet. 1% +/- utilisation rate can cost up to 1% of EBITDA margin in the Offshore Supply division Fixed rental costs on leased vessels increase Bourbon’s exposure if dayrates fall Jun 11 Sep 11 Dec 11 Mar 12 Jun 12 Sep 12 Dec 12 Mar 13 Jun 13 Sep 13 Dec 13 Mar 14 Jun 14 BOURBON SMALL & MID CAPS SELECTION Analyst(s) CM - CIC Securities Jean-Luc Romain [email protected] +33 1 45 96 77 36 49 France SMALL & MID CAPS SELECTION EUR 12.00 Hold BOURSORAMA FMTX.PA/BRS FP Market capitalisation: EUR 1054m Banks EUR 12/12 12/13e 12/14e 12/15e Total Revenue (m) 201 205 221 237 Pre-Provision Profit (PPP) (m) 66.5 50.9 58.7 65.7 Loan Impairment Charge (m) -2.0 -1.9 -2.0 -2.1 Operating profit (OP) (m) 64.5 49.0 56.7 63.7 Earnings before tax (m) 64.5 49.0 56.7 63.7 Net profit (reported) (m) 40.5 -30.9 35.6 40.0 Net profit (adj.) (m) 40.5 -30.9 35.6 40.0 Shareholders equity (m) 749 707 752 782 Tier 1 Ratio 60.8% 52.5% 51.4% 50.7% Cost/Income ratio 67.0% 75.2% 73.4% 72.3% ROE (adj.) 5.7% -4.2% 4.9% 5.2% NPL ratio (gross) 1.3% 1.3% 1.3% 1.3% NPL coverage 35.0% 35.0% 35.0% 35.0% LIC/Avg. RWA 0.2% 0.2% 0.2% 0.2% P/Pre-Provision Profit per Share 6.4 13.7 17.5 15.6 P/E (adj.) 10.5 nm 28.7 25.6 P/BV 0.6 1.0 1.4 1.3 P/NAV 0.6 1.0 1.4 1.3 Dividend yield 0.0% 0.0% 0.0% 0.0% PPPPS 0.78 0.60 0.69 0.77 EPS (adj.) 0.47 -0.36 0.42 0.47 EPS (adj.) growth -6.6% -chg +chg 12.1% BVPS 8.81 8.31 8.84 9.19 NAVPS 8.33 8.56 8.57 9.01 DPS 0.00 0.00 0.00 0.00 Abs. Performances(12m,6m,3m,1m): 98.3% 57.1% 35.0% -0.9% 12 month High/low: EUR12.14 / 5.82 Avg. Daily nb traded shares:0,000 Main shareholders: Soci‚t‚ G‚n‚rale 56.1% (56.6%); Free float 23.0% (23.1%); Caixa (Hodefi) 20.1% (20.3%); Treasury shares 0.8% (0.0%); All share prices at 19/05/14. Profile: France’s first online broker, Boursorama has continually innovated and expanded its offer and can now lay claim to being the No. 1 French online bank. In France, Boursorama is the leader in online brokerage with a 30% market share ahead of Direct Bourse, Fortunéo-Symphonis and Cortal. On 30 June 2013, operating revenues in France broke down as follows: 64.5% banking, 29.2% brokerage, 6.3% Internet portal. International revenues (Spain, UK and Germany) accounted for 21.0% of total revenues. SWOT Analysis STRENGTHS WEAKNESSES Leading Internet platform in France for financial information helps capture clients French leader in online brokerage: strong brand recognition. Capacity to innovate. Support of parent company Société Générale. Tier 1 ratio at 36.8% as at 30 June 2013. OPPORTUNITIES Restructuring in the UK, with a net loss of EUR4.3m in H1-2013 Low interest rates continue to erode revenues stemming from inflows Three CEOs in less than three years. Possible extension to other products in the medium term (consumer credit and insurance) Participation in Société Générale’s global project of accelerating expansion of retail banking Volatility of brokerage activities Competition in France with Hello Bank (BNPP) even if the business model is slightly different International strategy still unclear and difficulties implementing online banking abroad. Slow recovery in Spain and Germany, with net profit in H1-2013 vs net losses in 2012. THREATS Recommendation: H1-2013 net attributable profit was down 5.4% y-o-y at EUR17.6m. Guidance of a 20-25% decrease in 2013 net profit, mainly due to restructuring in the UK. Moreover, the recent change in governance could prompt the group to use its surplus shareholders’ equity more judiciously, e.g. exceptional pay-outs or acquisitions (means of payment or online banking in Europe). The current valuation appears unwarranted given the company’s surplus shareholders’ equity and its fairly resilient model. Target Price: EUR 9,30 PRICE (SHORT & LONG AVERAGE) FINANCIAL CALENDAR (Source: Precise) BOURSORAMA SA SMALL & MID CAPS SELECTION Analyst(s) 30/07/14 Results Pierre Chedeville titre 13.0 12.0 11.0 10.0 9.0 8.0 7.0 6.0 5.0 4.0 Mar 11 Source : Factset 50 Jun 11 Sep 11 Dec 11 Mar 12 Jun 12 Sep 12 Dec 12 Mar 13 Jun 13 Sep 13 Dec 13 Mar 14 Jun 14 2014H1 +33 1 45 96 78 71 CM - CIC Securities [email protected] Portugal SMALL & MID CAPS SELECTION EUR 1.60 Hold BPI BBPI.LS/BPI PL Market capitalisation: EUR 2227m Banks EUR 12/12 12/13 12/14e 12/15e Total Revenue (m) 1,330 1,048 1,051 1,154 Pre-Provision Profit (PPP) (m) 654 410 380 481 Loan Impairment Charge (m) -254 -255 -150 -129 Operating profit (OP) (m) 400 155 231 352 Earnings before tax (m) 424 182 260 383 Net profit (reported) (m) 249 66.8 118 206 Net profit (adj.) (m) 249 66.8 118 206 Shareholders equity (m) 1,708 1,922 2,034 2,221 Tier 1 Ratio 14.9% 16.3% 14.7% 14.1% Cost/Income ratio 48.1% 62.1% 60.7% 55.5% ROE (adj.) 22.9% 3.7% 6.0% 9.7% NPL ratio (gross) 3.2% 3.6% 3.8% 3.6% NPL coverage 92.4% 100% 89.7% 88.7% LIC/Avg. RWA 1.0% 1.1% 0.7% 0.6% P/Pre-Provision Profit per Share 2.0 4.1 5.9 4.6 P/E (adj.) 5.3 25.3 18.9 10.8 P/BV nm nm nm nm P/NAV 0.8 0.9 1.1 1.0 Dividend yield 0.0% 0.0% 0.0% 0.0% PPPPS 0.47 0.29 0.27 0.35 EPS (adj.) 0.18 0.05 0.08 0.15 EPS (adj.) growth +chg -73.2% 76.4% 74.8% BVPS 1.23 1.38 1.46 1.60 NAVPS 1.23 1.38 1.46 1.60 DPS 0.00 0.00 0.00 0.00 Abs. Performances(12m,6m,3m,1m): 47.0% 35.8% -4.6% -18.3% 12 month High/low: EUR1.99 / .83 Avg. Daily nb traded shares:3,185,775,000 Main shareholders: Caixabank 46.2% (20.0%); Free float 22.8% (22.9%); Santoro Financial Holding 19.5% (19.6%); Profile: The main focus of BPI management continues to be linked to the potential early repayment of the EUR 420m CoCo bonds currently in the bank’ balance sheet (from EUR 1.2bn in December 2012) that could be concluded before 30 June 2014. On 23 April the bank presented 1Q14 net loss of EUR 104.8m mainly due to weaker than anticipated consolidated NII (lower carry trade). Moreover, no main surprises in the other key lines, with the net loss related to the sale of MLT sovereign debt (Portugal and Italy) as the main event in the quarterly P&L. Going forward, the improvement in the macro economic outlook for Portugal is a relevant driver for the bank while the reform on the DTAs could have an impact close to EUR 230m (Core TIER I improvement). SWOT Analysis Strengths • Comfortable liquidity position - Loan-to-Deposits ratio at 94% by the end of 1Q14 • Lower provisioning cost than peers (cost of risk of 64bps by the end of March 2014) • Best asset quality in the Portuguese banking system with a NPL (>90 days) ratio of 3.7%. • Solid shareholder structure, as its three major shareholders have a 74.5% stake (CaixaBank with 46.2%, Opportunities Angolan company Santoro with 19.5% and Allianz with • Potential with BFA in Angola, a market with substantial potential for banking growth • Due to its liquidity position BPI has the flexibility to increase activity, namely credit, without regulatory constraints Weaknesses • World economic slowdown, mostly in Portuguese main trading partners • Higher risk in Angola with risk of volatility in BFA’s results and activity Threats • BPI investment case is closely related to the evolution of sovereign debt yields • Potential worsening of the Euro zone “sovereign debt crisis” namely in what refers to the evolution of risk aversion towards Portugal Recommendation: Our valuation for FY14 is EUR 1.50 per share with an Hold Recommendation, according to the ESN ratings matrix. All share prices at 19/05/14. From a fundamental point of view, BPI maintains a better than peers structural funding mix (customers' resources account for around 60% of its balance sheet vs. 50% in the case of BES and 55% for BCP) and low provisioning costs (based on its low risk portfolio). We also highlight its sound liquidity position with a consolidated LtD ratio of 94% at the end of 1Q14. Target Price: EUR 1.50 FINANCIAL CALENDAR (Source: Precise) PRICE (SHORT & LONG AVERAGE) titre 2.0 23/07/14 Results 1.8 1.6 1.4 1.2 1.0 2014H1 BPI SMALL & MID CAPS SELECTION Analyst(s) André Rodrigues 0.8 0.6 +351 21 389 68 39 Caixa-Banco de Investimento [email protected] 0.4 0.2 mar 11 jun 11 set 11 dez 11 mar 12 jun 12 set 12 dez 12 mar 13 jun 13 set 13 dez 13 mar 14 jun 14 Source : Factset 51 Italy SMALL & MID CAPS SELECTION EUR 27.34 Accumulate BREMBO BRBI.MI/BRE IM Market capitalisation: EUR 1826m Automobiles & Parts EUR Sales (m) EBITDA (m) EBITDA margin EBIT (m) EBIT margin Net profit (reported) (m) Net profit (adj.) (m) Cash Flow from Ops.bef. chg in NWC (m) Net debt (Cash) (m) Net Debt/Equity Net Debt/EBITDA Interest cover (EBITDA/Fin. interest) ROCE (adj.) ROCE (adj.)/WACC EV / CE EV / Sales EV / EBITDA EV / EBIT P/E (adj.) P/BV OpFCF yield Dividend yield EPS (adj.) EPS (adj.) growth BVPS DPS Abs. Performances(12m,6m,3m,1m): 12 month High/low: EUR28.80 / 12.52 12/12 1,389 172 12.4% 89.4 6.4% 77.5 77.5 160 321 0.8 1.9 25.6 12.9% 1.7 1.5 0.7 5.5 10.6 8.2 1.7 6.3% 4.1% 1.19 81.1% 5.82 0.40 118.5% 12/13 12/14e 12/15e 1,566 1,770 1,911 212 257 268 13.5% 14.5% 14.0% 121 154 157 7.8% 8.7% 8.2% 89.0 115 115 89.0 115 115 180 218 226 320 327 266 0.7 0.6 0.4 1.5 1.3 1.0 12.5 15.7 17.9 15.2% 16.4% 15.7% 2.0 2.2 2.1 2.3 2.8 2.6 1.0 1.2 1.1 7.5 8.3 7.7 13.1 13.8 13.2 14.3 nm 15.4 3.1 3.6 3.1 3.7% 3.2% 4.9% 1.8% 1.8% 1.8% 1.37 0.00 1.77 14.8% -chg +chg 6.35 7.59 8.85 0.50 0.48 0.48 40.8% 23.4% 0.5% Avg. Daily nb traded shares:259,861 Main shareholders: Bombassei Alberto 53.5%; Free float 41.6%; Goodman & Co 2.5%; Gamco INC. 2.3%; All share prices at 19/05/14. FINANCIAL CALENDAR (Source: Precise) PRICE (SHORT & LONG AVERAGE) titre 30 25 Profile: Brembo is a leading supplier of high-performance braking systems for passenger cars (~70% of 2013 revenues), LCVs (~12%) and motorbikes (~10%); the company also manufactures brakes for racing applications (~8% of 2013 revenues) and safety systems (~1%). BRE operates essentially through the OEM channel (~85% of revenues), while the after-market has a limited weight (~15%). BRE's major markets are: Germany (~24% of 2013 revenues), the NAFTA area (~24% of 2013 revenues), Italy (~13% of 2013 revenues) and the rest of Europe (~11% of 2013 revenues); Brazil, India and China accounted for ~12% of 2013 revenues. BRE’s customer base is well diversified as no single customer weighs more than 10% of group revenues. After the painful 2009, BRE re-started investing aggressively doubling its Polish plant, purchasing and revamping a Chinese foundry and building a new plant in the Czech Republic. Cumulated capex reached EUR 500m in the 2010-13 timeframe and should come in at ~EUR 130m in 2014. SWOT Analysis Strengths • Niche positioning at the top of the market Weaknesses • Limited exposure to the after-market channel • Strong brand recognition • Strong vertical integration making the cost structure less flexible • Limited FCF generation due to very high capex • Strong technical expertise Opportunities • Expansion in the mid-premium segment Threats • Competition by some Chinese producers on most simple products and aftermarket • Bigger competitors might enter Brembo’s niche market • Entrance in the aeronautic business • De-localisation in Poland/Czech Republic/China Recommendation: Revenues came in at ~EUR 1.6bn in 2013 (~+12.5% Y/Y), with the automotive, LCV and motorbike businesses growing ~17% Y/Y, ~4% Y/Y and ~6% Y/Y respectively. EBITDA reached EUR 212m (~+24% Y/Y at ~13.5% of revenues) and EBIT came in at ~EUR 121m (~+36% Y/Y). The bottom line result came in at ~EUR 89m (~+16% Y/Y) also thanks to a particularly low tax rate (~15%), while the NFP reached EUR -320m, flat year-over-year. After a very good Q1, BRE improved its FY14 guidance and now it sees the top line growing by 10/10.5% Y/Y, while EBITDA margin is expected to reach ~14%. We value Brembo on the basis of a DCF and peer multiples; our current target price is EUR 30. Target Price: EUR 30.00 20 15 10 5 Mar 11 Source : Factset Jun 11 Sep 11 Dec 11 Mar 12 Jun 12 Sep 12 Dec 12 Mar 13 Jun 13 Sep 13 Dec 13 Mar 14 Jun 14 BREMBO SMALL & MID CAPS SELECTION Analyst(s) Gabriele Gambarova 52 +39 02 43 444 289 Banca Akros [email protected] Netherlands SMALL & MID CAPS SELECTION EUR 44.69 Buy BRUNEL BRUN.AS/BRNL NA Market capitalisation: EUR 1113m Support Services EUR Sales (m) EBITDA (m) EBITDA margin EBIT (m) EBIT margin Net profit (reported) (m) Net profit (adj.) (m) Cash Flow from Ops.bef. chg in NWC (m) Net debt (Cash) (m) Net Debt/Equity Net Debt/EBITDA Interest cover (EBITDA/Fin. interest) ROCE (adj.) ROCE (adj.)/WACC EV / CE EV / Sales EV / EBITDA EV / EBIT P/E (adj.) P/BV OpFCF yield Dividend yield EPS (adj.) EPS (adj.) growth BVPS DPS Abs. Performances(12m,6m,3m,1m): 12 month High/low: EUR51.88 / 32.33 12/12 1,237 78.0 6.3% 73.6 5.9% 44.8 47.7 47.0 -98.6 -0.4 -1.3 nm 34.8% 4.2 5.0 0.6 10.1 10.7 18.3 3.4 3.0% 2.7% 2.00 18.6% 10.91 1.00 30.7% 12/13 12/14e 12/15e 1,283 1,416 1,522 78.3 91.7 102 6.1% 6.5% 6.7% 72.3 85.3 95.4 5.6% 6.0% 6.3% 50.0 60.3 67.4 50.0 60.3 67.4 64.0 59.7 74.2 -90.0 -102 -131 -0.3 -0.3 -0.4 -1.1 -1.1 -1.3 nm high nm 28.7% 30.6% 32.3% 3.5 3.7 3.9 5.3 4.8 4.5 0.8 0.7 0.7 12.7 11.0 9.8 13.8 11.9 10.5 21.5 18.3 16.7 3.9 3.5 3.1 1.3% 3.0% 4.8% 2.5% 2.7% 3.0% 2.07 2.44 2.67 3.3% 18.2% 9.5% 11.39 12.79 14.21 1.10 1.20 1.35 -0.3% -0.7% -8.0% Avg. Daily nb traded shares:20,845 Main shareholders: Noverhead 63.0%; Free float 37.0%; All share prices at 19/05/14. Profile: Brunel is a staffing company specialised in engineers, technicians and IT and legal specialists. In Oil & Gas, engineers are hired for and seconded to client projects around the world. In other sectors, specialists are full-time employed by Brunel and seconded on temporary assignments in Europe, predominantly the Netherlands and Germany. Brunel’s business model in oil and gas has been widened to include full-project recruitment and management services. Although lumpy in nature, such business offers revenues and profits uncorrelated to the highly cyclical patterns in European general engineering. SWOT Analysis Strengths • Integrated systems and co-ordinated management practices throughout network • International/global coverage Weaknesses • Fixed-cost business model in European engineering, operational gearing balancing act • Bargaining power vis-à-vis large corporations in oil & gas and scarce technical specialists in Europe • No Debt Opportunities • Quest for flexibility in volatile and cyclical manufacturing industry (e.g. automotive) • Increasing technical complexity of oil & gas projects Threats • Limited barriers to entry, especially in general engineering • Lumpy nature of upstream energy projects can temporarily swallow cash flow Recommendation: The Oil & Gas business continues to show strong growth outside the large projects; the secondment of German and Dutch engineers reflects the recovery of activity in the local manufacturing sector. The rising penetration of flexible contract engineering in the German industry and in offshore will extend top line growth potential. Brunel’s success in securing the top spot in specific outsourcing trends warrants a full valuation ahead of today’s multiples. Target Price: EUR 51.00 FINANCIAL CALENDAR (Source: Precise) PRICE (SHORT & LONG AVERAGE) titre 55 50 BRUNEL SMALL & MID CAPS SELECTION Analyst(s) Gert Steens 45 +312 0 5508639 SNS Securities [email protected] 40 35 30 25 20 Mar 11 Jun 11 Sep 11 Dec 11 Mar 12 Jun 12 Sep 12 Dec 12 Mar 13 Jun 13 Sep 13 Dec 13 Mar 14 Jun 14 Source : Factset 53 Spain SMALL & MID CAPS SELECTION EUR 340.30 Buy CAF CAF.MC/CAF SM Market capitalisation: EUR 1167m Industrial Transportation EUR Sales (m) EBITDA (m) EBITDA margin EBIT (m) EBIT margin Net profit (reported) (m) Net profit (adj.) (m) Cash Flow from Ops.bef. chg in NWC (m) Net debt (Cash) (m) Net Debt/Equity Net Debt/EBITDA Interest cover (EBITDA/Fin. interest) ROCE (adj.) ROCE (adj.)/WACC EV / CE EV / Sales EV / EBITDA EV / EBIT P/E (adj.) P/BV OpFCF yield Dividend yield EPS (adj.) EPS (adj.) growth BVPS DPS Abs. Performances(12m,6m,3m,1m): 12 month High/low: EUR400.00 / 312.60 12/12 1,721 182 10.6% 141 8.2% 100 100 141 415 0.6 2.3 17.4 10.6% 1.4 1.5 0.9 8.9 11.4 12.0 1.7 -12.7% 3.0% 29.18 -24.3% 206.42 10.50 9.0% 12/13 1,535 223 14.5% 151 9.9% 90.2 90.2 163 525 0.7 2.4 6.6 11.4% 1.5 1.8 1.2 8.3 12.3 14.6 1.8 -16.9% 3.1% 26.31 -9.8% 209.78 10.50 -9.7% 12/14e 12/15e 1,565 1,602 224 241 14.3% 15.1% 177 183 11.3% 11.4% 97.2 106 97.2 106 144 164 451 381 0.5 0.4 2.0 1.6 5.2 6.4 10.6% 11.0% 1.4 1.4 1.3 1.3 1.0 1.0 7.2 6.4 9.2 8.5 12.0 11.0 1.4 1.3 4.4% 9.1% 3.1% 3.1% 28.35 30.81 7.8% 8.7% 242.87 263.18 10.50 10.50 -10.7% -9.1% Avg. Daily nb traded shares:8,449 Profile: Construcciones y Auxiliar de Ferrocarriles, or CAF, is one of the international leaders in designing, manufacturing, maintenance and supply of equipment and components for railway systems. More than 80% of CAF’s revenues proceed from foreign countries (possibly rising to 90% in a couple of years). SWOT Analysis Strengths • Solid growths Weaknesses • Not a very communicative company • Good geographic diversification • Less than 20% sales in Spain • Strong order book (EUR 5 bn) Opportunities • Infrastructure plans in all countries where present • Strong growth of the railway sector due to the advantages vs. other transports Threats • Growth of companies within the Chinese railway sector, possibly gaining an important role • Margin pressure Recommendation: In 1Q14, sales below forecasts, representing 23.6% of the full year estimate, dropping 7% vs. 1Q’13. EBITDA fell 25% vs. 1Q’13.1Q’14 was affected by the delay of two construction projects, originating additional costs and not allowing higher sales volumes. Backlog reached EUR4,702m, 2.1% below 2013. The higher costs in 1Q’14 will affect the numbers of the year. Now we estimate EBITDA in 2014 will be close to 2013. Main shareholders: Free float 44.9%; Cartera Social 29.6%; Kutxa 20.1%; BNP 5.5%; Target Price: EUR 450.00 All share prices at 19/05/14. FINANCIAL CALENDAR (Source: Precise) PRICE (SHORT & LONG AVERAGE) titre 420 400 08/06/14 AGM 2013 07/06/14 AGM 2013 380 360 340 320 300 280 260 Mar 11 Source : Factset 54 Jun 11 Sep 11 Dec 11 Mar 12 Jun 12 Sep 12 Dec 12 Mar 13 Jun 13 Sep 13 Dec 13 Mar 14 Jun 14 CAF SMALL & MID CAPS SELECTION Analyst(s) Iñigo Recio Pascual +34 91 436 7814 BEKA Finance [email protected] Finland SMALL & MID CAPS SELECTION EUR 1.05 Accumulate CAPMAN CPMBV.HE/CPMBV FH Market capitalisation: EUR 90m Financial Services EUR Sales (m) EBITDA (m) EBITDA margin EBIT (m) EBIT margin Net profit (reported) (m) Net profit (adj.) (m) Cash Flow from Ops.bef. chg in NWC (m) Net debt (Cash) (m) Net Debt/Equity Net Debt/EBITDA Interest cover (EBITDA/Fin. interest) ROCE (adj.) ROCE (adj.)/WACC EV / CE EV / Sales EV / EBITDA EV / EBIT P/E (adj.) P/BV OpFCF yield Dividend yield EPS (adj.) EPS (adj.) growth BVPS DPS Abs. Performances(12m,6m,3m,1m): 12 month High/low: EUR1.21 / .79 12/12 27.3 3.4 12.6% 2.6 9.6% 2.7 0.3 3.6 25.5 0.3 7.4 nm 7.1% 0.7 3.5 3.5 27.9 36.6 nm 0.9 -2.3% 0.0% 0.00 -96.8% 0.99 0.00 25.0% 12/13 12/14e 12/15e 29.8 35.2 37.4 4.0 14.6 16.6 13.5% 41.4% 44.3% 3.3 14.1 16.2 11.2% 40.2% 43.3% 1.5 10.8 12.6 -1.0 9.9 11.6 2.1 11.2 13.0 14.5 13.6 14.2 0.2 0.2 0.2 3.6 0.9 0.9 5.4 21.8 39.0 32.5% 146% 167% 3.3 14.8 16.9 14.4 13.3 13.4 3.8 2.9 2.8 27.9 7.1 6.3 33.4 7.3 6.4 nm 9.1 7.7 1.5 1.3 1.2 3.7% 12.6% 14.5% 3.8% 7.4% 8.7% -0.01 0.12 0.14 -chg +chg 17.9% 0.76 0.84 0.90 0.04 0.08 0.09 -10.3% -3.7% 1.9% Avg. Daily nb traded shares:27,392 Main shareholders: Free float 76.4%; Ilmarinen Mutual Pension Insurance Co 8.4%; OY Inventiainvest AB 8.2%; Winsome Oy + Tuomo Raasio 4.4%; All share prices at 19/05/14. FINANCIAL CALENDAR (Source: Precise) PRICE (SHORT & LONG AVERAGE) titre 1.60 Profile: CapMan is a listed private equity fund manager with EUR 3.1 billion of assets under management. The company operates in the Nordic countries and Russia. In addition to fund management, the company is committed to investing money from its own balance sheet in the funds it manages. SWOT Analysis Strengths • Good investment track record Weaknesses • High labor costs • Well-established, reputable player in the market place • Deteriorated pricing power • Multiproduct platform (Equity, Mezzanine, Real estate funds) Opportunities • Russia, where CapMan has a good foothold compared to other foreign private equity firms • A relative advantage in the fundraising market as a Nordic player during the euro crisis • Revived M&A market Threats • Failure to raise funds in the extremely challenging market situation • Increasing regulation rendering private equity investments less competitive in relation to other assets • Lower availability of buyout funding • Political risks in Russia Recommendation: Action programmes in the more challenging portfolio companies have slowly started to bear fruit and CapMan is expecting a clear improvement in their performance in the next 12 months. This will support the group’s result through the fair value development of the company’s own fund investments. CapMan’s portfolio also holds several investments the company is ready to exit. Accordingly, we expect to see exits this year especially from funds that are in carry, with CapMan’s carried interest income rising materially as a consequence. The M&A market has livened up noticeably early this year, which supports CapMan’s determined exit intentions and underpins our profit forecasts, which involve high expectations for carried interest income generated during this and the following years. We regard the share price level as attractive in view of the anticipated positive news flow and earnings trend. 1.50 Target Price: EUR 1.25 1.40 1.30 1.20 1.10 CAPMAN SMALL & MID CAPS SELECTION Analyst(s) 1.00 0.90 0.80 0.70 Mar 11 Source : Factset Jun 11 Sep 11 Dec 11 Mar 12 Jun 12 Sep 12 Dec 12 Mar 13 Jun 13 Sep 13 Dec 13 Mar 14 Jun 14 Niclas Catani +358 10 252 8780 Pohjola [email protected] 55 Spain SMALL & MID CAPS SELECTION EUR 26.28 Buy CARBURES EUROPE SA CAR.MC/CAR SM Market capitalisation: EUR 501m Aerospace & Defense EUR Sales (m) EBITDA (m) EBITDA margin EBIT (m) EBIT margin Net profit (reported) (m) Net profit (adj.) (m) Cash Flow from Ops.bef. chg in NWC (m) Net debt (Cash) (m) Net Debt/Equity Net Debt/EBITDA Interest cover (EBITDA/Fin. interest) ROCE (adj.) ROCE (adj.)/WACC EV / CE EV / Sales EV / EBITDA EV / EBIT P/E (adj.) P/BV OpFCF yield Dividend yield EPS (adj.) EPS (adj.) growth BVPS DPS Abs. Performances(12m,6m,3m,1m): 12 month High/low: EUR39.89 / 5.01 12/12p 21.2 2.3 10.6% 1.0 4.9% 1.1 1.1 2.3 13.0 0.6 5.8 4.3 2.3% 0.2 1.1 1.6 15.3 33.2 23.2 1.0 -20.8% 0.0% 0.07 +chg 1.57 0.00 382.1% 12/13e 12/14e 12/15e 69.7 157 356 9.5 26.7 70.3 13.7% 17.0% 19.8% 5.3 20.1 56.5 7.6% 12.8% 15.9% 2.7 6.9 31.5 2.7 6.9 31.5 6.9 13.5 46.3 47.4 168 168 0.8 1.3 1.0 5.0 6.3 2.4 4.6 2.5 6.6 4.8% 5.3% 13.2% 0.5 0.5 1.3 3.3 2.4 2.1 3.7 4.0 1.8 26.9 23.6 9.0 48.2 31.4 11.2 nm nm 15.9 4.0 3.9 3.1 -6.3% -36.4% 0.1% 0.0% 0.0% 0.0% 0.14 0.36 1.65 97.1% 158.0% nm 3.29 6.80 8.46 0.00 0.00 0.00 165.7% 13.8% -21.9% Avg. Daily nb traded shares:49,763 Profile: Carbures is a nitch player in the aeronautic sector. The company takes advantage of its small size to make better use of the work load that for other large aeronautic structure manufacturers implies higher costs and management problems. Its engineering know-how makes manufacturing a wide range of airplane components possible, optimising procedures, and taking advantage of raw materials optimisation. The intention to reduce polluting emissions has boosted the use of lightweight materials such as carbon fibre, now being used by other sectors such as automobiles and civil construction, where Carbures has also taken a strong foothold. Carbures has made a number of acquisitions, diversified geographically in terms of clients and products, and incorporated new executives with ample experience. Carbures’ strategy is to grow in the aeronautic activity and develop new business lines (civil works, automotive, production lines manufacturing) allowing large scale production of carbon fibre products. Carbures is now beginning an important investment phase, to grow organically and inorganically, nationally and abroad, that will make the company a world reference in the production of fibre carbon structures SWOT Analysis Strengths • Carbon fiber is a key material for the aerospace industry. Entrance barriers to the sector • It is expected a significant growth in its use. Located in Europe, USA and China Weaknesses • Execution risk of new programs and new products. • Its main customer's financial position is strong, and its order backlog also, which gives visibility to suppliers. Opportunities • The A350 and the A320 Neo programs offer good prospects. • Carbures is growing via acquisitions and organically. • Rapid growth could affect its management. Main shareholders: Free float 35.0%; Neuer Gedanke 19.5%; SPE Juárez 8.0%; Rafcon Economist 6.6%; • Volatility of the air traffic Threats • Risk of delays in aeronautical programs • Risk of a slower than expected pace in the launch of the new industrial activities. • Newcomers to the production lines manufacturing business line All share prices at 19/05/14. • Carbon fiber is beginning to be used in the automotive sector, in civil works and other activities. PRICE (SHORT & LONG AVERAGE) Recommendation: If the growth plans remain on course, the estimated EBITDA for 2013 (EUR9.5m) will be 10 fold in 2016 (EUR95.3m). We begin our coverage on Carbures Europe with a fair value of EUR45.10/share and a Buy recommendation. FINANCIAL CALENDAR (Source: Precise) titre 40 Target Price: EUR 45.10 35 30 25 CARBURES EUROPE SA SMALL & MID CAPS SELECTION Analyst(s) 20 15 10 5 0 Mar 11 Source : Factset 56 Jun 11 Sep 11 Dec 11 Mar 12 Jun 12 Sep 12 Dec 12 Mar 13 Jun 13 Sep 13 Dec 13 Mar 14 Jun 14 Iñigo Recio Pascual +34 91 436 7814 BEKA Finance [email protected] Finland SMALL & MID CAPS SELECTION EUR 7.66 Accumulate CAVERION CAV1V.HE/CAV1V FH Market capitalisation: EUR 962m Materials, Construction & Infrastructure EUR Sales (m) EBITDA (m) EBITDA margin EBIT (m) EBIT margin Net profit (reported) (m) Net profit (adj.) (m) Cash Flow from Ops.bef. chg in NWC (m) Net debt (Cash) (m) Net Debt/Equity Net Debt/EBITDA Interest cover (EBITDA/Fin. interest) ROCE (adj.) ROCE (adj.)/WACC EV / CE EV / Sales EV / EBITDA EV / EBIT P/E (adj.) P/BV OpFCF yield Dividend yield EPS (adj.) EPS (adj.) growth BVPS DPS Abs. Performances(12m,6m,3m,1m): 12 month High/low: EUR8.90 / 3.75 12/12 2,803 85.8 3.1% 61.6 2.2% 42.9 61.6 67.2 -9.8 0.0 -0.1 45.2 17.6% 2.4 12/13 12/14e 12/15e 2,544 2,520 2,667 71.4 105 125 2.8% 4.2% 4.7% 49.8 81.5 102 2.0% 3.2% 3.8% 35.9 59.7 73.2 44.9 62.4 73.2 57.5 82.8 96.3 86.3 12.5 -41.4 0.3 0.0 -0.1 1.2 0.1 -0.3 10.8 21.1 27.8 13.4% 20.9% 26.8% 1.9 2.9 3.7 2.7 2.4 2.4 0.5 0.4 0.3 16.8 9.2 7.3 24.0 11.9 8.9 24.9 15.4 13.1 4.5 3.5 3.1 7.5% 10.9% 10.3% 2.9% 4.7% 6.1% 0.36 0.50 0.58 -27.1% 39.0% 17.3% 1.99 2.22 2.44 0.22 0.36 0.47 4.4% 7.3% -8.5% Avg. Daily nb traded shares:884,897 0.49 3.08 0.00 Main shareholders: Free float 100.0%; Structor S.A. 12.1%; Varma Mutual Pension Insurance Co 6.1%; Profile: Caverion is one of the leading building systems and industrial service companies in the Nordic countries, Central Europe, Russia and the Baltic countries. Caverion designs, builds and maintains userfriendly and energy-efficient building systems and offers industrial services. Building services, which comprises building systems and their service and maintenance in all of the Caverion’s countries of operation, accounts for the majority of Caverion’s revenue. In addition, Caverion offers industrial services mainly in Finland and Sweden, covering project deliveries of technical systems and processes to industry together with industrial service and maintenance as well as modernisation projects. In 2012, approximately 75% of revenue was generated in Northern Europe. Service and maintenance operations accounted for 64% of revenue in Northern Europe and 31% in Central Europe. SWOT Analysis Strengths • Comprehensive service portfolio Weaknesses • Low entry barriers • Good market positions in core markets • Fragmented market, no pricing power • Good cash conversion • Low visibility from outside • Focus on enengy efficiency • Poor management track record Opportunities • Successful turnaround in Northern Europe Threats • Slow GDP growth keeping competition up • Consolidation opportunities • Profitability turnaround fails • Upturn in Nordic non-residential new construction volumes • Streak of successful acquisitions continues Herlin Antti 3.6%; All share prices at 19/05/14. FINANCIAL CALENDAR (Source: Precise) PRICE (SHORT & LONG AVERAGE) titre 9.0 Recommendation: A profitability rebound to the level of competitors through project selection, cost savings and efficiency improvement is essential for Caverion’s investment case. At the EV/EBIT valuation of 10, the share price has upside to EUR 12 (+40%) if the company attains its 6% EBITDA margin target, lowers net working capital mildly below zero and records 6% top-line growth by 2016. Measures to release working capital will support cash flow over the coming years. Favourable risk/reward. 10/06/14 Analyst Meeting 8.5 Target Price: EUR 9.50 8.0 7.5 7.0 6.5 CAVERION SMALL & MID CAPS SELECTION Analyst(s) 6.0 5.5 5.0 4.5 4.0 Mar 11 Source : Factset Jun 11 Sep 11 Dec 11 Mar 12 Jun 12 Sep 12 Dec 12 Mar 13 Jun 13 Sep 13 Dec 13 Mar 14 Jun 14 Matias Rautionmaa +358 10 252 4408 Pohjola [email protected] 57 Belgium SMALL & MID CAPS SELECTION EUR 74.60 Accumulate CFE CFEB.BR/CFEB BB Market capitalisation: EUR 1888m Materials, Construction & Infrastructure EUR Sales (m) EBITDA (m) EBITDA margin EBIT (m) EBIT margin Net profit (reported) (m) Net profit (adj.) (m) Cash Flow from Ops.bef. chg in NWC (m) Net debt (Cash) (m) Net Debt/Equity Net Debt/EBITDA Interest cover (EBITDA/Fin. interest) ROCE (adj.) ROCE (adj.)/WACC EV / CE EV / Sales EV / EBITDA EV / EBIT P/E (adj.) P/BV OpFCF yield Dividend yield EPS (adj.) EPS (adj.) growth BVPS DPS Abs. Performances(12m,6m,3m,1m): 12 month High/low: EUR84.19 / 41.11 12/12 1,898 201 10.6% 81.4 4.3% 49.4 49.4 169 400 0.7 2.0 10.6 4.5% 0.6 0.7 0.5 4.9 12.0 11.6 1.1 0.4% 2.6% 3.77 -16.4% 40.67 1.15 62.5% 12/13 12/14e 12/15e 2,267 3,496 3,566 198 458 474 8.7% 13.1% 13.3% -28.6 210 232 nm 6.0% 6.5% -81.2 118 139 -81.2 118 139 138 377 393 783 646 522 0.7 0.5 0.4 4.0 1.4 1.1 7.5 14.4 18.2 -0.9% 6.4% 7.0% -0.1 0.8 0.9 1.0 1.0 1.0 1.1 0.7 0.7 12.3 5.6 5.2 nm 12.2 10.6 nm 16.0 13.6 1.4 1.5 1.4 -0.9% 8.8% 8.2% 1.5% 1.7% 1.9% -3.21 4.67 5.49 -chg +chg 17.5% 47.13 50.56 54.65 1.15 1.25 1.40 21.6% 15.8% -6.2% Avg. Daily nb traded shares:23,043 Main shareholders: Ackermans & van Haaren 60.4%; Free float 27.5%; Vinci 12.1%; Profile: CFE is an international multidisciplinary group, active in dredging and marine engineering, construction, real estate, multitechnics, rail & road and PPP-concessions. CFE forms a coherent whole in which each division is supported by the others. CFE’s dredging division DEME is by far the most important business line, accounting for c. 95% of EBITDA. The concessions and property development divisions award work to the general contracting companies, which in turn are potential customers of the companies making up the multitechnics division, which maintain the structures built under public private partnership contracts. SWOT Analysis Strengths • Structural market growth in dredging and well-filled order book • Oligopolic market: dominant market positions of top-5 world-wide • Stable management and clear strategy with balanced activity portfolio • Important barriers of entry: technological, geographical/topographical, capital needs… Opportunities • Opening of (semi-)protected dredging markets such as China, India and the US • Exposure to renewable energy, deep-sea mining, treatment of industrial polluted water, marine services… • Improving market momentum (amongst others larger works upcoming in Singapore) • Ramp-up of PPP & concessions segment and synergies between segments Threats • Cost inflation and cost over-run in Public Private Partnerships • Stated budgetary constraints and financing for the Public Private Partnership segment • Declining dredging capacity utilisation when additional capacity is added or made in unsuited niches • Exposure to geopolitical risks Recommendation: Throughout the years, in support of DEME’s core business, viz. dredging and land reclamation, a number of new entrepreneurial initiatives with future growth potential have been developed, such as hydraulic engineering, offshore and environmental works, deep-sea mining, marine services… The recent transformational deal with AvH warrants a re-rating of the stock as CFE has become a true offshore company with 95-100% of EBITDA derived from maritime infrastructure activities. The stock has had a strong run thanks to the improved outlook for dredging. All share prices at 19/05/14. Target Price: EUR 86.00 FINANCIAL CALENDAR (Source: Precise) PRICE (SHORT & LONG AVERAGE) Weaknesses • Very capital intensive business in a competitive environment • Highly cyclical activity, operations are very dependent on developments in the world economy • USD exposure in dredging, geopolitical risks in some important areas titre 85 28/05/14 Dividend Payment 80 75 70 65 60 55 45 40 35 Mar 11 58 CFE SMALL & MID CAPS SELECTION Analyst(s) Hans D'Haese 50 Source : Factset 2013 Jun 11 Sep 11 Dec 11 Mar 12 Jun 12 Sep 12 Dec 12 Mar 13 Jun 13 Sep 13 Dec 13 Mar 14 Jun 14 +32 (0) 2 287 9223 Bank Degroof [email protected] Finland SMALL & MID CAPS SELECTION EUR 2.67 Rating Suspended CITYCON CTY1S.HE/CTY1S FH Market capitalisation: EUR 1178m Real Estate EUR 12/12 226 135 56.4% 28 (68) 90 63 63.40 1,477 2,734 2,392 0.21 0.15 3.24 (20.8%) 3.49 8.2% 5.8% 17.7 12 2.0 1,477 52.4% 5.1% 12/13 12/14e 12/15e 234 237 244 EBITDA (m) 150 151 156 EBITDA margin 60.5% 60.3% 60.4% Portfolio Result (m) 24 12 0 Net Financial Result (63) (61) (64) Net Profit (reported)(m) 113 101 93 Net Profit (adj.)(m) 85 88 89 Funds From Operations 85.00 88.02 89.44 Net Debt (m) 1,420 1,468 1,563 Portfolio Value (m) 2,743 2,818 2,937 Enterprise Value (m) 2,651 2,753 2,848 EPS (adj.) 0.22 0.20 0.20 DPS 0.15 0.16 0.16 IFRS NAVPS 3.04 3.13 3.18 Premium/(discount) (15.7%) (14.7%) (16.1%) EPRA NAVPS 3.10 3.19 3.24 Earnings adj. yield 8.3% 7.5% 7.6% Dividend yield 5.6% 5.9% 6.0% EV/EBITDA 17.6 18.2 18.2 P/E (adj.) 12 13 13 Int. cover(EBITDA/Fin.int) 2.4 2.5 2.5 Net debt/(cash) (m) 1,420 1,468 1,563 Net Debt/Total Assets 47.7% 48.1% 49.3% Abs. Performances(12m,6m,3m,1m): 2.7% -0.4% 1.1% 12 month High/low: EUR2.85 / 2.23 Avg. Daily nb traded shares:338,765 Main shareholders: Free float 91.0%; Gazit-Globe Ltd. 9.0%; Ilmarinen Mutual Pension Insurance Co 0.7%; Gross Rental Income (m) Profile: Citycon is an owner, manager and long-term developer of shopping centres. A total of 56% of its assets are located in Finland, 30% in Sweden and 14% in the Baltics. Citycon owns or manages 36 shopping centres and 33 other retail properties. Common for the core assets is that they are located in areas where people live and work and, thus, enjoy natural population growth. The shopping centres provide access to public transportation and benefit from high barriers to entry, such as land constraints and zoning restrictions. The core assets also boast shared access to education, healthcare, culture or municipality services. The company's vision is to be leading owner and manager of urban, grocery-anchored shopping centres in the Nordics and Baltics. SWOT Analysis Strengths • Expertise in managing shopping centres Weaknesses • Dominant main owner • Good quality of top assets • Chronic discount to NAV makes growth difficult Opportunities • Successful sale of non-core supermarket premises to release capital • Several attractive development opportunities in the property portfolio Threats • Equity issues on discount to NAV to fund growth • e-Commerce erodes growth • Aggressive expansion on too tight prices State Pension Fund 0.6%; All share prices at 19/05/14. Recommendation: Since Pohjola Bank plc has committed to act as the lead manager of a rights issue proposed recently, we provide no recommendation or target price for Citycon for the moment (previously Accumulate, EUR 2.9). FINANCIAL CALENDAR (Source: Precise) PRICE (SHORT & LONG AVERAGE) titre 3.4 10/07/14 Results 3.2 3.0 06/06/14 AGM 2.8 2.6 2.4 CITYCON SMALL & MID CAPS SELECTION Analyst(s) Matias Rautionmaa 2.2 2.0 Mar 11 2014H1 Jun 11 Sep 11 Dec 11 Mar 12 Jun 12 Sep 12 Dec 12 Mar 13 Jun 13 Sep 13 Dec 13 Mar 14 +358 10 252 4408 Pohjola [email protected] Jun 14 Source : Factset 59 Germany SMALL & MID CAPS SELECTION EUR 8.21 Accumulate COMDIRECT CDBG.DE/COM GR Market capitalisation: EUR 1156m Financial Services EUR 12/12 Total Revenue (m) 330 Pre-Provision Profit (PPP) (m) 93.0 Loan Impairment Charge (m) -4.4 Operating profit (OP) (m) 88.6 Earnings before tax (m) 92.3 Net profit (reported) (m) 73.4 Net profit (adj.) (m) 73.4 Shareholders equity (m) 586 Tier 1 Ratio 46.1% Cost/Income ratio 71.8% ROE (adj.) 12.9% NPL ratio (gross) 2.3% NPL coverage 0.0% LIC/Avg. RWA 0.8% P/Pre-Provision Profit per Share 11.9 P/E (adj.) 15.1 P/BV 1.9 P/NAV 1.9 Dividend yield 5.6% PPPPS 0.66 EPS (adj.) 0.52 EPS (adj.) growth -34.4% BVPS 4.16 NAVPS 4.16 DPS 0.44 Abs. Performances(12m,6m,3m,1m): 8.5% 12 month High/low: EUR8.87 / 7.07 Main shareholders: Commerzbank 79.9%; Free float 20.2%; 12/13 12/14e 12/15e 332 344 361 71.9 80.6 94.2 -1.4 -1.0 -1.0 70.5 79.6 93.2 80.0 85.6 97.2 60.5 61.6 70.0 60.3 61.6 70.0 552 557 567 47.2% 45.5% 43.7% 78.3% 76.6% 73.9% 10.6% 11.1% 12.4% 2.3% 2.3% 2.3% 0.0% 26.7% 26.7% 0.2% 0.2% 0.1% 16.2 14.3 12.3 19.4 18.8 16.5 2.1 2.1 2.0 2.1 2.1 2.0 4.4% 4.4% 4.8% 0.51 0.57 0.67 0.43 0.44 0.50 -17.8% 2.2% 13.6% 3.92 3.96 4.03 3.92 3.96 4.03 0.36 0.36 0.40 -2.2% -4.9% 0.6% Avg. Daily nb traded shares:12,712,000 Profile: Comdirect is Germany’s biggest discount broker in terms of B2C brokerage accounts (844,083 acc. as of 31/03/2014) and among the leading online banks in Germany with 1.5m Tagesgeld PLUS and more than 1m current accounts. The bank’s major revenue source is net commission income which it receives for the execution of stock market transactions. Net interest income has become more and more important as a revenue source following comdirect’s conversion to an online bank. Due to higher commission income (+7% yoy) and a stabilizing net interest income (+1% yoy) we expect pretax profit to grow by 7% yoy in 2014e. Key earnings trigger in the mid-term should he higher short term rates which should have a significant positive earnings impact as comdirect holds around EUR 4bn of retail deposits (that do not pay any interest). SWOT Analysis Strengths • Highly scalable business model Weaknesses • Relatively high dependence on equity markets • Solid capitalization • Solid asset quality Opportunities • Market potential remains huge Threats • Price war in online banking • Rising short term rates • New aggressive competitors enter the market All share prices at 19/05/14. Recommendation:. We recommend accumulating the shares with a target price of EUR 9.50. Target Price: EUR 9.50 FINANCIAL CALENDAR (Source: Precise) PRICE (SHORT & LONG AVERAGE) titre 9.0 8.5 COMDIRECT 8.0 Philipp Häßler, CFA 7.0 6.5 6.0 Mar 11 Source : Factset 60 SMALL & MID CAPS SELECTION Analyst(s) 7.5 Jun 11 Sep 11 Dec 11 Mar 12 Jun 12 Sep 12 Dec 12 Mar 13 Jun 13 Sep 13 Dec 13 Mar 14 Jun 14 Equinet Bank +49 69 58997 414 [email protected] Spain SMALL & MID CAPS SELECTION EUR 43.03 Buy CORP. FINANCIERA ALBA ALB.MC/ALB SM Market capitalisation: EUR 2509m Financial Services PROFIT & LOSS (EURm) Revenues Non Recurrent Items Net Profit (reported) BALANCE SHEET (EURm) Shareholders Equity Minorities equity Net Debt NAV Constituents & Total NAV (EURm) ACS Acerinox Indra Ebro Foods Clínica Baviera Antevenio NON-LISTED REAL ESTATE OTHER ASSETS Total Net Asset Value Discount/(Premium) to NAV Listed shareholdings on NAV OTHER ITEMS (EURm) Total Market Cap Debt / Equity Payout Ratio P/BV Dividend Yield (Gross) PER SHARE DATA (EUR) EPS (reported) NAVPS BVPS DPS 2012 -263.2 0.0 -299.4 2013 299.1 0.0 226.9 2014e 299.1 0.0 226.9 2015e 299.1 0.0 226.9 2,764.0 0.7 144.2 2,951.1 0.4 -255.6 3,064.6 0.4 -265.5 3,178.0 0.4 -275.3 911.9 670.9 274.5 188.3 36.7 3.4 208.8 220.2 74.4 2,765.4 64.8% 81.8% 1,437.5 680.7 257.5 207.5 34.7 2.9 243.7 214.2 946.1 4,024.8 64.1% 65.1% 1,437.5 680.7 257.5 207.5 34.7 2.9 243.7 214.2 946.1 4,024.8 64.1% 65.1% 1,437.5 680.7 257.5 207.5 34.7 2.9 243.7 214.2 946.1 4,024.8 64.1% 65.1% 2,058.6 5.2% nm 0.7 2.8% 2,477.8 -8.7% 25.7% 0.8 2.3% 2,508.6 -8.7% 25.7% 0.8 2.3% 2,508.6 -8.7% 25.7% 0.8 2.3% 0.000 47.515 47.410 1.000 3.896 69.108 50.620 1.000 3.896 69.108 52.566 1.000 3.896 69.108 54.511 1.000 Source: Company, BEKA Finance estimates FINANCIAL CALENDAR (Source: Precise) PRICE (SHORT & LONG AVERAGE) titre 50 45 40 12/06/14 AGM 2013 11/06/14 AGM 2013 Profile: Corporación Financiera Alba (ALB) is a private equity investment company 68.8% owned by “Grupo March” (owner also of Banca March and Fundación Juan March). Alba’s main activity is to invest in other companies (Spanish mainly), either listed or not. The company has a select portfolio of equity shareholdings (ACS, ACX, IDR, EBRO, CBAV & Antevenio). In addition, Alba directly manages a real estate property business (close to 82,250m²) invested in top-tier office buildings in prime downtown or suburban business locations, strongly focused on the cities of Madrid and Barcelona. H1'2013 Results: In 1Q'2014 Corporación Financiera Alba (ALB) records a consolidated net profit of EUR77.2, 25.9% below the EUR104.2m in 1Q’2013. The 1Q’2014 earnings drop is mainly attributable to the fact that the capital gain obtained by ALBA (EUR46.2m, pretax) is lower vs. the EUR89.7m that earned in 1Q’2013 (Prosegur stake sale). 1Q'2014 Activity: i) Investments / Divestitures: sale of 1.31% stake of ACS by EUR117.1m (pretax capital gain of EUR46.2m) and acquisition of 1.80% stake of Ebro Foods, for a EUR45.1m consideration; ii) Income from Equity portfolio: increases 8.6%Y/Y to EUR44.0m vs. EUR40.5m same period last year, growth attributable to the earnings stream improvement of the companies in which ALBA is invested; iii) Financial Income (net): amounts to EUR3.5m vs. EUR1.2m at 1Q’2013, mainly due to increase in ST investments (EUR355m vs. EUR256m in1Q’14); iv) Corporate Tax: of EUR14.2m vs. EUR25.0m (1Q'2013), recapping the divestitures impact (lower gains & lower tax). SWOT Analysis Strengths • Proven management capacity. Weaknesses • Heavy weighting of listed stocks in the investment portfolio. • Valuation volatility due to exposure of the equity markets. • Robust history in attaining capital gains. • Active in share buy backs and treasury stock redemptions, enhancing shareholder value. Opportunities • Healthy financial statements. Threats • Potential losses from the quoted companies included in the investment portfolio. • Positive recommendation on main listed companies (mostly covered by ESN). • Sound position to take advantage from economic recovery. 35 Recommendation: We value ALBA shares at EUR55.3/sh (previous EUR52.8), backed by the good quality of ALBA’s equity portfolio of listed companies, that recently have seen improvements in earnings and outlook. We reiterate our Buy recommendation 30 25 20 Mar 11 Jun 11 Sep 11 Dec 11 Mar 12 Jun 12 Sep 12 Dec 12 Mar 13 Jun 13 Sep 13 Dec 13 Mar 14 Jun 14 Target Price: EUR 55.30 Source : Factset Analyst(s) Javier Bernat BEKA Finance +34 91 436 7816 [email protected] 61 Finland SMALL & MID CAPS SELECTION EUR 15.14 Buy CRAMO CRA1V.HE/CRA1V FH Market capitalisation: EUR 656m Materials, Construction & Infrastructure EUR Sales (m) EBITDA (m) EBITDA margin EBIT (m) EBIT margin Net profit (reported) (m) Net profit (adj.) (m) Cash Flow from Ops.bef. chg in NWC (m) Net debt (Cash) (m) Net Debt/Equity Net Debt/EBITDA Interest cover (EBITDA/Fin. interest) ROCE (adj.) ROCE (adj.)/WACC EV / CE EV / Sales EV / EBITDA EV / EBIT P/E (adj.) P/BV OpFCF yield Dividend yield EPS (adj.) EPS (adj.) growth BVPS DPS Abs. Performances(12m,6m,3m,1m): 12 month High/low: EUR16.83 / 8.61 12/12 688 178 25.9% 66.0 9.6% 40.1 34.1 152 349 0.7 2.0 8.7 5.5% 0.6 0.7 0.9 3.5 9.5 9.6 0.6 14.5% 5.3% 0.82 -23.3% 12.85 0.42 50.6% 12/13 12/14e 12/15e 658 658 701 173 176 204 26.4% 26.8% 29.0% 66.5 72.0 99.2 10.1% 10.9% 14.2% 42.5 43.9 65.0 39.5 43.9 65.0 149 148 169 365 336 336 0.7 0.6 0.6 2.1 1.9 1.7 11.7 11.1 12.7 5.5% 6.0% 7.9% 0.6 0.7 0.9 1.1 1.1 1.0 1.5 1.5 1.4 5.8 5.5 4.8 15.3 13.6 9.8 16.9 14.9 10.1 1.3 1.3 1.2 3.5% 0.6% 1.9% 4.0% 4.3% 5.3% 0.91 1.01 1.50 10.7% 11.2% 48.1% 11.55 11.97 12.82 0.60 0.65 0.80 2.3% -1.4% 0.1% Avg. Daily nb traded shares:132,306 Main shareholders: Free float 100.0%; Harwall Capital Oy Ab 15.5%; Rakennusmestarit Group 5.1%; Profile: Cramo is the second largest equipment rental company in the Nordic countries and Central and Eastern Europe. The company also operates in Germany (10% of sales). The share of the construction industry as a customer is 57%, meaning a 43% share for non-construction customers. In the Nordic countries, the equipment rental market has historically grown by twice the rate for construction volumes. As a market leader in Sweden and the second biggest in Finland, Cramo has captured faster growth than the equipment rental market. The long-term growth driver for the equipment rental market is increasing rental penetration. The market offers growth potential as the penetration is developing towards the 80% rate prevailing in the UK. In the Nordic countries, the penetration rate is currently between 30–40% and in Eastern Europe around 10%. Increasing rental penetration is driven by the benefits of rental, including release of capital, cost efficiency due to better capacity utilisation, no maintenance costs, and better access to equipment as well as higher safety. SWOT Analysis Strengths • Market leader in Sweden with a strong position in several markets • Modular space business reduces cyclical fluctuations Weaknesses • High importance of the Swedish market • High operational leverage makes the company a derivative of construction markets • High operational leverage makes the company a derivative of construction markets Opportunities • Growth in rental penetration continuing for several years Threats • Weakening of the construction cycle • Cyclical end-markets • Low penetration in German markets provides long term potential • Improving outlook for construction industry K. Hartwall Invest Oy Ab 5.1%; All share prices at 19/05/14. FINANCIAL CALENDAR (Source: Precise) PRICE (SHORT & LONG AVERAGE) Recommendation: We estimate that Q1 2014 represented the bottom of the European debt crisis-sparked downtrend for Cramo. The Swedish construction markets started to recover last year, with residential construction picking up first. Growth in rental demand should contribute to the company’s earnings as of H2. Last year Cramo made 61% of its profit in Sweden. Our target price leans on our 2015 forecasts and the EV/EBITDA valuation of 5.5. Target Price: EUR 18.50 titre 18 16 14 CRAMO SMALL & MID CAPS SELECTION Analyst(s) 12 10 Matias Rautionmaa 8 6 Mar 11 Source : Factset 62 Jun 11 Sep 11 Dec 11 Mar 12 Jun 12 Sep 12 Dec 12 Mar 13 Jun 13 Sep 13 Dec 13 Mar 14 Jun 14 +358 10 252 4408 Pohjola [email protected] Italy SMALL & MID CAPS SELECTION EUR 6.29 Reduce CREDEM EMBI.MI/CE IM Market capitalisation: EUR 2091m Banks EUR 12/12 Total Revenue (m) 971 Pre-Provision Profit (PPP) (m) 271 Loan Impairment Charge (m) -89.1 Operating profit (OP) (m) 182 Earnings before tax (m) 228 Net profit (reported) (m) 121 Net profit (adj.) (m) 96.6 Shareholders equity (m) 1,985 Tier 1 Ratio 9.4% Cost/Income ratio 65.6% ROE (adj.) 5.3% NPL ratio (gross) 2.9% NPL coverage 55.3% LIC/Avg. RWA 0.5% P/Pre-Provision Profit per Share 5.1 P/E (adj.) 14.2 P/BV 0.7 P/NAV 0.8 Dividend yield 2.9% PPPPS 0.82 EPS (adj.) 0.29 EPS (adj.) growth -3.2% BVPS 5.11 NAVPS 5.11 DPS 0.12 Abs. Performances(12m,6m,3m,1m): 43.7% 12 month High/low: EUR7.78 / 3.58 Main shareholders: Credemholding 76.9%; Free float 23.1% (0.0%); 12/13 12/14e 12/15e 995 1,017 1,056 335 341 370 -120 -98.4 -77.7 215 243 292 211 243 292 116 136 164 118 136 164 2,156 2,252 2,375 9.9% 10.8% 10.3% 65.2% 66.0% 64.7% 5.7% 6.2% 7.1% 3.6% 3.4% 3.3% 58.2% 58.2% 58.2% 0.7% 0.6% 0.5% 5.8 6.1 5.7 16.4 15.4 12.8 0.9 0.9 0.9 1.0 1.1 1.0 1.9% 1.9% 3.2% 1.01 1.03 1.11 0.36 0.41 0.49 22.3% 15.1% 20.6% 5.62 5.91 6.29 5.62 5.91 6.29 0.12 0.12 0.20 10.4% -2.9% -13.2% Avg. Daily nb traded shares:153,290,000 Profile: Credem is one of the few privately-owned banks in Italy, as it is controlled with a 77% stake by Credemholding, a company held by private investors, mainly entrepreneurs, including the Maramotti family (Credemholding’s main shareholder with about 35.5%). The FY13 results were slightly better than expected, ending with a net profit down 4% Y/Y to EUR 116m or 3.6% higher than anticipated, with a stable DPS of EUR 0.12 as we were expecting. The (fully Core) Tier1 ratio reached 9.9% and Solvency ratio 13.4% based on the Standardized approach. The operating performance was a bit stronger than estimated, with the gross operating profit increasing 4% to EUR 347m or 2% better than expected, thanks to revenues growing 2.5% to EUR 995m and operating costs increasing 1.7% to EUR 648m, leading to a C/I ratio of 65%. The good operating performance was however compensated by higher loan impairments, which grew 35% to EUR 120m or 5% more than expected, with a cost of risk of 60bps which enabled the bank to increase the NPL coverage ratio to 58.2% vs. 55.4% one year ago. In detail, the NII was down only 0.4% to EUR 466m thanks to continuous repricing and a resurgence of lending growth in Q4. Net commissions increased 3% to EUR 425m thanks to strong inflows in asset mgmt. products. The trading income grew 10% to EUR 48m thanks to the harvesting of the Italian Govies portfolio. Credem may post a 3-4% gain in revenues this year to over EUR 1bn as the NII is expected to be close to last year’s level while a 6-7% increase in non-interest income will drive revenue higher. Credem’s operating costs may increase 3-4% this year because of investments in personnel and technology. The CEO also said he expects 2014 net profit and dividend in line with last year (EUR 116m and EUR 0.12 per share respectively). SWOT Analysis Strengths • Stable shareholder structure Weaknesses • High cost/income ratio • Solid funding and strong liquidity • Sub-optimal presence in asset management Opportunities • Attrition in competitors’ client bases Threats • Consolidating sector • Branch acquisitions • Growing cost of credit risk All share prices at 19/05/14. FINANCIAL CALENDAR (Source: Precise) PRICE (SHORT & LONG AVERAGE) titre 8 7 6 22/05/14 Dividend Payment 2013 19/05/14 Ex Dividend Date 2013 Recommendation: Credem is best in class on asset quality and profitability. With a P/NAV of 1.2x we think this comes at a high price and have a Reduce recommendation on the stock. 5 Target Price: EUR 6.00 4 3 2 Mar 11 Source : Factset Jun 11 Sep 11 Dec 11 Mar 12 Jun 12 Sep 12 Dec 12 Mar 13 Jun 13 Sep 13 Dec 13 Mar 14 Jun 14 Analyst(s) Luigi Tramontana Banca Akros +39 02 4344 4239 [email protected] 63 Italy SMALL & MID CAPS SELECTION EUR 1.50 Hold CREVAL PCVI.MI/CVAL IM Market capitalisation: EUR 720m Banks EUR Total Revenue (m) Pre-Provision Profit (PPP) (m) Loan Impairment Charge (m) Operating profit (OP) (m) Earnings before tax (m) Net profit (reported) (m) Net profit (adj.) (m) Shareholders equity (m) Tier 1 Ratio Cost/Income ratio ROE (adj.) NPL ratio (gross) NPL coverage LIC/Avg. RWA P/Pre-Provision Profit per Share P/E (adj.) P/BV P/NAV Dividend yield PPPPS EPS (adj.) EPS (adj.) growth BVPS NAVPS DPS Abs. Performances(12m,6m,3m,1m): 12 month High/low: EUR1.75 / .86 Main shareholders: Free float 100.0%; 12/12 810 270 -391 -121 -425 -322 -103 1,982 8.1% 65.8% -7.0% 5.7% 59.7% 1.9% 1.9 nm 0.3 0.3 0.0% 0.61 -0.23 -chg 4.48 3.78 0.00 50.7% 12/13 12/14e 12/15e 828 875 867 321 365 360 -266 -323 -227 55.1 41.7 133 39.9 41.7 133 11.7 12.3 63.8 17.1 12.3 63.8 1,908 1,931 1,995 8.6% 10.8% 10.8% 60.8% 57.5% 57.8% 1.0% 0.8% 3.9% 8.9% 9.5% 8.9% 58.0% 58.0% 58.0% 1.4% 1.8% 1.3% 2.0 2.0 2.0 37.5 nm 11.3 0.3 0.4 0.4 0.4 0.4 0.4 0.0% 0.0% 2.7% 0.68 0.76 0.75 0.04 0.03 0.13 +chg -29.5% nm 4.05 4.02 4.15 3.40 3.38 3.51 0.00 0.00 0.04 11.5% 17.4% -10.3% Avg. Daily nb traded shares:1,743,875,000 Profile: Credito Valtellinese (Creval) is a cooperative banking group with almost 550 branches, o/w some 230 are located in Lombardy (3.5% market share). Creval’s EGM approved a EUR 400m rights issue, possibly due to take place before next Jul and pre-underwritten by a consortium led by Banca IMI, Credit Suisse and Mediobanca. The capital increase is aimed at adding some 220bps and reaching a pro-forma fully-loaded CET ratio of 10.9% as at YE13, in line with peers, including the impact of the SME supporting factor, estimated in 35bps. The organic capital generation should be rather limited over 2014-16, as half of the 40bps of retained earnings should be absorbed by RWA growth, with a net capital generation of 20bps. Creval also included in the plan some 70bps of capital generation arising from non-core asset disposals and other strategic actions. We think the group is considering the following: 1) the sale & lease back of some 150-200 instrumental properties to a specialised property company, which may potentially generate a one-off capital gain in the short term; 2) the disposal of some EUR 100m NPL to a specialised partner to free up liquidity and capital; 3) a partnership with a specialised partner in the leasing activity to become a distributor of third-party products and free up liquidity and capital on the new production. Finally, the AIRB model validation, which the bank postponed to the end of its business plan but which may happen in 2015, is expected to cut RWA for some EUR 5.4bn, corresponding some 150bps of higher equity, partly compensated by the creation of EUR 270m (or 15-20bps) shortfall on expected losses, with net positive impact on the CET ratio of 130bps. Over 2014-16 the revenue mix is due to improve as the recovery will be driven by the NII and net commissions generated by the commercial network, while the financial & other income sources are expected to decrease. Positively, the plan is based on very prudent macro assumptions, The NII growth will be supported mainly by loan and funding repricing. Positively, the mgmt. indicated the targeted 2.38% commercial spread has already been achieved end-Feb and will be kept stable over the coming years. Following the huge cost cutting of the last few years, we see this lever losing steam in the coming ones, as operating expenses will not decline over the plan horizon. The bank will continue to streamline its operations, with 165 less staff or 3.8% of the current workforce. However, the benefits on personnel costs (less than EUR 10m) will be compensated by the growth in other admin expenses. We think more aggressive branch closures would be needed to obtain further cost cuts. Most of the profitability rebound will come from the reduction in the cost of credit risk, with FY14 remaining tough and guided at 131bps, FY15 guided at 115bps, and FY16 guided at 96bps. This looks coherent with the expected stabilization of Italian GDP embedded in the plan. SWOT Analysis Strengths • Deeply rooted branch network Weaknesses • Weak capital position • Solid funding and strong liquidity • High cost/income ratio Opportunities • Attrition in competitors’ client bases Threats • Consolidating sector • Branch acquisitions • Growing cost of credit risk All share prices at 19/05/14. FINANCIAL CALENDAR (Source: Precise) PRICE (SHORT & LONG AVERAGE) titre 3.5 3.0 2.5 Recommendation: We stick to Hold with EUR 1.35 target price. 2.0 Target Price: EUR 1.35 1.5 1.0 0.5 Mar 11 Source : Factset Jun 11 Sep 11 Dec 11 Mar 12 Jun 12 Sep 12 Dec 12 Mar 13 Jun 13 Sep 13 Dec 13 Mar 14 Jun 14 Analyst(s) Luigi Tramontana 64 Banca Akros +39 02 4344 4239 [email protected] Portugal SMALL & MID CAPS SELECTION EUR 7.13 Hold CTT CTT.LS/CTT PL Market capitalisation: EUR 1070m Industrial Transportation EUR Sales (m) EBITDA (m) EBITDA margin EBIT (m) EBIT margin Net profit (reported) (m) Net profit (adj.) (m) Cash Flow from Ops.bef. chg in NWC (m) Net debt (Cash) (m) Net Debt/Equity Net Debt/EBITDA Interest cover (EBITDA/Fin. interest) ROCE (adj.) ROCE (adj.)/WACC EV / CE EV / Sales EV / EBITDA EV / EBIT P/E (adj.) P/BV OpFCF yield Dividend yield EPS (adj.) EPS (adj.) growth BVPS DPS Abs. Performances(12m,6m,3m,1m): 12 month High/low: EUR8.20 / 5.53 12/13 705 122 17.3% 87.2 12.4% 61.0 61.0 95.8 -485 -1.8 -4.0 29.0 79.7% 10.8 4.5 0.5 2.9 4.1 13.7 3.1 8.7% 7.2% 0.41 70.7% 1.82 0.40 12/14 704 126 17.9% 101 14.3% 69.8 69.8 87.4 -484 -1.7 -3.8 30.2 83.1% 11.3 6.7 0.8 4.6 5.8 15.3 3.8 5.8% 5.9% 0.47 14.4% 1.87 0.42 12/15 12/16 704 701 130 134 18.4% 19.1% 104 108 14.8% 15.4% 72.5 75.7 72.5 75.7 90.2 93.2 -491 -498 -1.7 -1.7 -3.8 -3.7 32.8 35.8 86.5% 89.5% 11.7 12.1 6.6 6.5 0.8 0.8 4.5 4.3 5.6 5.3 14.7 14.1 3.7 3.6 6.8% 7.1% 6.1% 6.4% 0.48 0.50 3.9% 4.3% 1.91 1.96 0.44 0.45 -0.6% -8.0% Avg. Daily nb traded shares:676,592 Profile: CTT – Correios de Portugal, is the leader in the Portuguese postal sector with c. 94% market share of the postal market, being the largest logistics operator in Portugal and the single designated provider of the Universal Service Obligations (USO) until 2020.CTT is a Portuguese state owned company, offering a wide range of services through its 4 business units, covering 3 product markets: (i) Mail (including mail, business solutions and retail & others); (ii) Express & Parcels; and (iii) Financial Services. CTT is a strong trusted brand that benefits from a 500-year history and a unique distribution network with a country wide coverage and high level of capillarity. Its strong brand combined with a strong balance sheet and resilient cash flow generation gives CTT a privileged position to leverage its network. The company’s solid balance sheet and its ability to generate cash are excellent foundations to implement a generous dividend policy going further (at least 90% pay-out ratio from 2014 onwards). SWOT Analysis Strengths • Large retail network Weaknesses • Declining mail volumes • Dense last mile network • Low margins in express & parcels • Solid balance sheet • Loss of market share in express & parcels • Strong margins in financial services Opportunities • Growth of e-commerce Threats • E-substitution • Innovation and optimization of products • Competition in parcels Main shareholders: Free float 61.4%; Portuguese government 31.5%; Goldman Sachs 5.0%; • Network leveraging • Economic environment Unicredit 2.1%; • Cross selling All share prices at 19/05/14. FINANCIAL CALENDAR (Source: Precise) PRICE (SHORT & LONG AVERAGE) Recommendation: We arrived at a YE14 fair value of EUR 7.90 per and a Hold recommendation. titre 8.5 30/07/14 Results 8.0 Target Price: EUR 7.90 2014Q2 7.5 CTT SMALL & MID CAPS SELECTION Analyst(s) 7.0 6.5 6.0 5.5 mar 11 Source : Factset jun 11 set 11 dez 11 mar 12 jun 12 set 12 dez 12 mar 13 jun 13 set 13 dez 13 mar 14 jun 14 Carlos Jesus Artur Amaro +351 21 389 6812 +351 213 89 6822 Caixa-Banco de Investimento [email protected] [email protected] 65 Italy SMALL & MID CAPS SELECTION EUR 23.28 Accumulate DANIELI DANI.MI/DAN IM Market capitalisation: EUR 1609m Industrial Engineering EUR Sales (m) EBITDA (m) EBITDA margin EBIT (m) EBIT margin Net profit (reported) (m) Net profit (adj.) (m) Cash Flow from Ops.bef. chg in NWC (m) Net debt (Cash) (m) Net Debt/Equity Net Debt/EBITDA Interest cover (EBITDA/Fin. interest) ROCE (adj.) ROCE (adj.)/WACC EV / CE EV / Sales EV / EBITDA EV / EBIT P/E (adj.) P/BV OpFCF yield Dividend yield EPS (adj.) EPS (adj.) growth BVPS DPS Abs. Performances(12m,6m,3m,1m): 12 month High/low: EUR26.83 / 17.76 06/12 3,081 303 9.8% 214 7.0% 193 192 265 -826 -0.6 -2.7 nm 25.0% 2.6 0.4 0.1 0.7 1.0 7.0 1.0 -47.6% 2.0% 2.36 -0.3% 16.08 0.33 10.9% 06/13 06/14e 06/15e 2,783 2,869 2,945 277 288 304 10.0% 10.0% 10.3% 182 193 208 6.6% 6.7% 7.1% 136 136 148 162 149 161 232 232 244 -851 -1,036 -1,118 -0.6 -0.6 -0.6 -3.1 -3.6 -3.7 high high high 19.6% 17.9% 17.4% 2.0 1.9 1.8 0.6 0.8 0.6 0.1 0.2 0.2 1.4 2.1 1.7 2.1 3.2 2.6 9.0 12.7 11.8 1.0 1.1 1.0 7.4% -2.4% 3.9% 1.4% 1.4% 1.4% 2.00 1.84 1.98 -15.3% -8.0% 7.6% 17.50 21.01 22.99 0.33 0.33 0.33 7.5% -13.2% -6.2% Avg. Daily nb traded shares:48,582 Main shareholders: Sind International 67.6%; Free float 32.4%; All share prices at 19/05/14. FINANCIAL CALENDAR (Source: Precise) PRICE (SHORT & LONG AVERAGE) titre 28 26 24 22 20 Profile: Danieli Group is one of the three largest worldwide suppliers of equipment and plants to the metals industry. The Group is involved in the construction and sale of plants for the iron and steel industry, offering a range of machines from primary process management to production of the finished products. Danieli also operates in the production of special steel through its subsidiary ABS (Acciaierie Bertoli Safau) located in Italy (near Udine), exporting about 65% of its steel output; the main reference markets for its products are the automotive sector, petrochemical, mechanics and pipe industries. SWOT Analysis Strengths • Strong worldwide leadership in the core business Weaknesses • Profitability exposed to steel price fluctuations • Recognised high technological know-how and continuous investments in R&D • Country risk: Danieli works often in countries characterized by strong instability • Capital intensive business Opportunities • Continuous growing trend in steel demand in the emerging markets (especially Far East, Middle East and Eastern Europe) • Revamping process of the old plants in Europe and USA Threats • Potential excess of capacity in steelmaking 9M 13/14 sales increased by 11% Y/Y thanks to the strong sales increase in the steel making division (+23%) and the good sales recovery in the plant making division (+7%). 9M EBITDA grew by 15%, especially thanks to the continuous strong improvement in the operating margins of the steel making sector (+62%) and a stable profitability in the plant making sector. Good trend the order book: Danieli’s total order book on 30 March 14 was of EUR 3,145m (EUR 3,110m on 31 December 2013). We remind investors that, based on the company guidance, the order book at the end of June 2014 is expected to be around EUR 3,000/3,100. Management confirmed FY 13/14 guidance: based on 9M results and on the visibility on the next quarter, the management is confident to reach annual results in line with the guidance (FY 13/14 sales 2,800/3,000; FY 13/14 EBITDA 270/290). So, we confirm our estimates, which are substantially in line with the guidance: FY 14e sales at EUR 2,868.6m and FY 14e EBITDA at EUR 287.8m. Sector perspectives: owing to the current over capacity in the steel making sector, the demand of new plants will be weak in the next 2/3 years. Nevertheless, the expected weaker trend in the plant making sector will be partially offset by the growing sales and profitability expected in the steel making division thanks to the important investments to increase the production capacity. Recommendation: the ongoing recovery in the steel making allows us to confirm our Accumulate recommendation and our target price of EUR 28.60 calculated based on our DCF model (1.2% perpetual growth rate and WACC from 9.7% to 9.4)%; EUR 19.80 for the saving shares assuming a 30% discount). Target Price: EUR 28.60 18 16 14 Mar 11 Source : Factset Jun 11 Sep 11 Dec 11 Mar 12 Jun 12 Sep 12 Dec 12 Mar 13 Jun 13 Sep 13 Dec 13 Mar 14 Jun 14 DANIELI SMALL & MID CAPS SELECTION Analyst(s) Paola Saglietti 66 • Entry of Chinese low cost manufacturers in traditional steel plants in the long term • A sudden slowdown in the emerging economies and a longer-than expected economic stagnation could entail a strong drop in the order book in the plant making division +39 02 4344 4287 Banca Akros [email protected] Italy SMALL & MID CAPS SELECTION EUR 8.70 Buy DATALOGIC DAL.MI/DAL IM Market capitalisation: EUR 508m Industrial Engineering EUR Sales (m) EBITDA (m) EBITDA margin EBIT (m) EBIT margin Net profit (reported) (m) Net profit (adj.) (m) Cash Flow from Ops.bef. chg in NWC (m) Net debt (Cash) (m) Net Debt/Equity Net Debt/EBITDA Interest cover (EBITDA/Fin. interest) ROCE (adj.) ROCE (adj.)/WACC EV / CE EV / Sales EV / EBITDA EV / EBIT P/E (adj.) P/BV OpFCF yield Dividend yield EPS (adj.) EPS (adj.) growth BVPS DPS Abs. Performances(12m,6m,3m,1m): 12 month High/low: EUR9.86 / 6.19 12/12 462 63.2 13.7% 16.3 3.5% 10.2 12/13 12/14e 12/15e 451 486 533 60.0 66.8 80.2 13.3% 13.7% 15.0% 45.5 49.7 64.1 10.1% 10.2% 12.0% 26.9 30.2 42.8 29.5 33.5 45.3 41.4 47.3 58.9 97.0 74.0 45.3 0.5 0.3 0.2 1.6 1.1 0.6 9.6 9.4 11.3 15.4% 16.2% 19.6% 1.9 1.9 2.6 2.1 2.0 1.8 1.4 1.3 1.1 10.4 9.4 7.5 13.8 12.6 9.3 18.0 16.9 11.9 2.6 2.4 2.0 5.2% 5.3% 5.6% 1.7% 1.7% 1.8% 0.46 0.52 0.73 162.6% 12.1% 41.8% 3.17 3.69 4.42 0.15 0.15 0.15 3.0% 12.2% -7.6% Avg. Daily nb traded shares:18,288 52.8 121 0.7 1.9 18.1 5.0% 0.6 1.7 1.2 8.8 34.2 37.7 2.2 -12.9% 2.3% 0.18 -60.5% 2.97 0.15 42.2% Main shareholders: Hydra 67.2%; Free float 32.8%; All share prices at 19/05/14. FINANCIAL CALENDAR (Source: Precise) PRICE (SHORT & LONG AVERAGE) titre 10.0 Profile: Datalogic provides products and solutions in Automatic Data Capture (ADC) and Industrial Automation (IA) for the retail, manufacturing, transportation & logistics and healthcare industries. Its products are used in over a third of the world’s checkouts, airports and mail sorting offices. Datalogic produces innovative bar code readers, data collection mobile computers, sensors, vision systems and laser marking systems. Over the last ten years, Datalogic has been transformed from a mid-sized player into a global market leader in the market of bar code readers and data collection mobile computers and vision systems (sales CAGR 2001-13 was +12%). The management has proved its ability to mix organic growth (a portfolio of over 1,000 patents) and growth through acquisitions (11 companies acquired in the period 1988-2013). SWOT Analysis Strengths • Strong position in high-end ADC market Weaknesses • Price erosion • Experienced management team • Limited free float • Geographic diversification • R&D crucial to preserve the competitive positioning • High entry barriers Opportunities • Potential consolidator in the highly fragmented IA market Threats • Working capital absorption • Growth in the emerging markts • Slowdown in the European market Today, after the slowdown in orders in 2012/13 due to the consumer crisis, as shown by the strong results recovery started in the second part of last year, the big retailers and couriers have started to invest again and Datalogic is ready to seize on this new growth opportunity through the launch of some innovative products, which could potentially become the new standard technology in the sector. Room to improve profitability: according to the 2013-15 strategic plan presented by the management, we believe that Datalogic will improve its profitability significantly in the coming years thanks to: 1) the increasing sold volumes in ADC; 2) the important internal reorganisation measures, geared to increase the processes efficiency. Q1 14 results confirmed the recovery started in H2 13: the good sales growth in the ADC division (+14.5% Y/Y) allowed the group to offset the still weak sales performance in the IA sector (-4.6% Y/Y). The profitability improved thanks to the strong operating leverage in the ASD division: while the IA division margins are still suffering for the ongoing reorganisation process, the ADC division showed a strong recovery in the profitability due to the strong operating leverage (EBITDA margin moved from 14.4% in Q1 13 to 19.5% in Q1 14). Recommendation: We confirm our Buy recommendation and we are setting a target price of EUR 12.00 per share, thus an upside over 30% on the current share price. Our valuation is based on a DCF model (WACC 7.55% and 1.5% of perpetual growth rate). 9.5 9.0 Target Price: EUR 12.00 8.5 8.0 7.5 7.0 6.5 6.0 5.5 5.0 Mar 11 Source : Factset Jun 11 Sep 11 Dec 11 Mar 12 Jun 12 Sep 12 Dec 12 Mar 13 Jun 13 Sep 13 Dec 13 Mar 14 Jun 14 DATALOGIC SMALL & MID CAPS SELECTION Analyst(s) Paola Saglietti +39 02 4344 4287 Banca Akros [email protected] 67 Italy SMALL & MID CAPS SELECTION EUR 15.99 Hold DE LONGHI DLG.MI/DLG IM Market capitalisation: EUR 2391m Household Goods EUR Sales (m) EBITDA (m) EBITDA margin EBIT (m) EBIT margin Net profit (reported) (m) Net profit (adj.) (m) Cash Flow from Ops.bef. chg in NWC (m) Net debt (Cash) (m) Net Debt/Equity Net Debt/EBITDA Interest cover (EBITDA/Fin. interest) ROCE (adj.) ROCE (adj.)/WACC EV / CE EV / Sales EV / EBITDA EV / EBIT P/E (adj.) P/BV OpFCF yield Dividend yield EPS (adj.) EPS (adj.) growth BVPS DPS Abs. Performances(12m,6m,3m,1m): 12 month High/low: EUR17.00 / 10.92 12/12 1,530 225 14.7% 189 12.4% 118 118 162 61.4 0.1 0.3 6.5 20.6% 2.3 2.3 1.1 7.6 9.1 13.8 2.6 5.6% 2.7% 0.79 26.2% 4.22 0.29 30.0% 12/13 12/14e 12/15e 1,633 1,731 1,847 240 259 289 14.7% 14.9% 15.6% 195 214 244 11.9% 12.3% 13.2% 117 128 151 117 128 151 165 174 196 2.2 -29.7 -80.9 0.0 0.0 -0.1 0.0 -0.1 -0.3 6.3 6.3 6.9 20.5% 21.1% 23.3% 2.3 2.4 2.6 2.5 3.1 3.0 1.1 1.4 1.3 7.5 9.2 8.1 9.2 11.2 9.6 15.2 18.6 15.9 2.6 3.2 2.9 7.1% 3.9% 5.2% 2.5% 2.9% 3.4% 0.78 0.86 1.01 -1.3% 9.8% 17.3% 4.48 4.94 5.48 0.40 0.47 0.54 27.9% 8.8% -0.1% Avg. Daily nb traded shares:86,033 Main shareholders: De Longhi Soparfi 67.0%; Free float 33.0%; All share prices at 19/05/14. FINANCIAL CALENDAR (Source: Precise) PRICE (SHORT & LONG AVERAGE) titre 20 18 16 Profile: De Longhi is now a pure leading small domestic appliances player: according to company data De Longhi is world leader in espresso coffee makers, portable air conditioners, portable heaters and food preparation. De Longhi has now a high focus on core Coffee Machines and Kitchen segments, that together represented around 76% of sales. With around 50% of its products positioned in the highest price quartile (price above EUR 179) vs. main competitors never exceeding 25%, De Longhi could claim to be in the high end of small domestic appliances segment. SWOT Analysis Strengths • World leader in espresso coffee makers, portable air conditioners, portable heaters and food preparation Weaknesses • Low visibility on sales due to lag time between sell in and sell out • Exposure to consumer spending Opportunities • Focus on core Coffee Machines and Kitchen segments Threats • Price pressure from low cost countries especially China Recommendation: De Longhi Group Q1 2014 sales were at EUR 338.1m increasing by 7.1% and up 12.0% at constant fx. Sales breakdown by regions & countries: positive performance of European markets (positive contribution on Group sales from UK, Spain, Scandinavia and Russia-despite fx headwind and a very difficult market here); sales in US and Brazil were strong; Middle East, India and Africa region was positive (strong performance from Saudi Arabia); Australia and New Zealand were negative (also due to fx headwinds). Q1 2014 EBITDA of EUR 46.1m was higher than our estimates of EUR 44.0m; Q1 2014 EBITDA margin of 13.6% was some 40bps lower than Q1 2013 level and better than expected. Q1 2014 EBIT was at EUR 35.4m vs. our forecasts of EUR 33.6m. Q1 2014 Net debt was at EUR 54.6m (vs. Q1 2013 level restated of EUR 55.1m); Q1 2014 NWC on sales at 17.0% (vs. Q1 2013 level of 17.3%). Q1 2014 results were solid despite heavy fx headwinds (impressive results in Russia but weaker in Nespresso overall in the quarter in our understanding), and ahead of our estimates. Our FY 2014e-FY 2015e estimates point to FY 2014e EBITDA of EUR 258.5m and FY 2015e EBITDA of EUR 288.7m. Our DCF-based Target Price is of EUR 17.40 per share. Hold. 14 Target Price: EUR 17.40 12 10 8 6 4 Mar 11 Source : Factset Jun 11 Sep 11 Dec 11 Mar 12 Jun 12 Sep 12 Dec 12 Mar 13 Jun 13 Sep 13 Dec 13 Mar 14 Jun 14 DE LONGHI SMALL & MID CAPS SELECTION Analyst(s) Claudio Giacomiello, CFA 68 +39 02 4344 4269 Banca Akros [email protected] Germany SMALL & MID CAPS SELECTION EUR 36.09 Hold DEUTSCHE EUROSHOP DEQGn.DE/DEQ GR Market capitalisation: EUR 1947m Real Estate EUR 12/12 210 181 85.7% 8 (86) 0 73 86.44 1,485 3,330 3,528 1.35 1.20 24.50 29.1% 28.53 4.3% 3.8% 19.5 23 2.5 1,485 41.9% 5.4% 12/13 12/14e 12/15e 187 201 205 EBITDA (m) 166 177 181 EBITDA margin 88.2% 87.8% 88.0% Portfolio Result (m) 56 30 30 Net Financial Result (34) (53) (53) Net Profit (reported)(m) 0 0 0 Net Profit (adj.)(m) 94 101 104 Funds From Operations 112.00 117.00 120.00 Net Debt (m) 1,446 1,405 1,371 Portfolio Value (m) 2,963 2,988 3,013 Enterprise Value (m) 3,417 3,610 3,581 EPS (adj.) 1.74 1.88 1.94 DPS 1.25 1.30 1.35 IFRS NAVPS 26.49 27.47 28.46 Premium/(discount) 20.1% 31.4% 26.8% EPRA NAVPS 30.59 31.29 32.28 Earnings adj. yield 4.8% 5.2% 5.4% Dividend yield 3.5% 3.6% 3.7% EV/EBITDA 20.6 20.3 19.8 P/E (adj.) 18 19 19 Int. cover(EBITDA/Fin.int) 2.9 2.9 3.0 Net debt/(cash) (m) 1,446 1,405 1,371 Net Debt/Total Assets 42.6% 40.4% 39.1% Abs. Performances(12m,6m,3m,1m): 8.9% 10.6% 6.2% 12 month High/low: EUR36.10 / 29.45 Avg. Daily nb traded shares:119,394 Main shareholders: Free float 82.0%; Alexander Otto 12.1%; Benjamin Otto 5.9%; Gross Rental Income (m) All share prices at 19/05/14. Profile: Deutsche EuroShop (DEQ) is Germany’s only public company that invests solely in shopping centers in prime locations. The company currently has equity interests in 19 European shopping centers in Germany (16), Austria (1), Hungary (1) and Poland (1). The market value of these shopping centers, which are predominantly in city centre locations amounts to EUR3.7bn. SWOT Analysis Strengths • Parts of the dividend are tax-free • Good locations and good condition of the properties Weaknesses • Relationship with ECE and the Otto family might lead to conflicts of interest • Demographic trends in Germany • "Pure play" shopping center property stock focused on Germany and partly Eastern Europe Opportunities • Benefitting from potential inflation Threats • Capital increases to finance growth • Potential for long-term appreciation of the shopping centers • Refinancing of debt leads to lower interest expenses • Earnings fluctuations as a result of property valuation • Exposure to developments in the retail trade • Trade tax issue might burden Recommendation: DEQ reported good Q1 2014 results with growth of 18% (equine forecast: about 17%) in revenue and EBIT, respectively. FFO per share increased by 10% to EUR0.55 (equinet forecast: EUR0.54). Additionally, DEQ confirmed the FY 2014 guidance. It is positive that the KAGB does not apply tor DEQ. We keep our forecast unchanged but increase our price target to EUR36 (EUR33) per share based on a premium of 15% to the EPRA NAV 2014e. Peer group multiples have increased accordingly. However, we reiterate our Hold recommendation. Target Price: EUR 36.00 FINANCIAL CALENDAR (Source: Precise) PRICE (SHORT & LONG AVERAGE) titre 38 36 DEUTSCHE EUROSHOP SMALL & MID CAPS SELECTION Analyst(s) 34 32 30 Jochen Rothenbacher, CEFA 28 26 +49 69 58997 415 Equinet Bank [email protected] 24 22 Mrz 11 Jun 11 Sep 11 Dez 11 Mrz 12 Jun 12 Sep 12 Dez 12 Mrz 13 Jun 13 Sep 13 Dez 13 Mrz 14 Jun 14 Source : Factset 69 Italy SMALL & MID CAPS SELECTION EUR 29.00 Accumulate DIASORIN DIAS.MI/DIA IM Market capitalisation: EUR 1620m Healthcare EUR Sales (m) EBITDA (m) EBITDA margin EBIT (m) EBIT margin Net profit (reported) (m) Net profit (adj.) (m) Cash Flow from Ops.bef. chg in NWC (m) Net debt (Cash) (m) Net Debt/Equity Net Debt/EBITDA Interest cover (EBITDA/Fin. interest) ROCE (adj.) ROCE (adj.)/WACC EV / CE EV / Sales EV / EBITDA EV / EBIT P/E (adj.) P/BV OpFCF yield Dividend yield EPS (adj.) EPS (adj.) growth BVPS DPS Abs. Performances(12m,6m,3m,1m): 12 month High/low: EUR35.69 / 29.00 12/12 434 170 39.1% 140 32.3% 87.7 87.7 117 -47.2 -0.1 -0.3 59.4 39.9% 4.5 4.7 3.8 9.8 11.9 19.3 4.6 4.5% 1.7% 1.57 -12.1% 6.58 0.50 -3.3% 12/13 12/14e 12/15e 435 444 472 163 164 175 37.5% 36.9% 37.1% 135 135 145 31.0% 30.3% 30.7% 83.1 82.7 89.2 83.1 82.7 89.2 112 112 120 -98.0 -167 -259 -0.2 -0.3 -0.4 -0.6 -1.0 -1.5 30.5 30.3 32.1 38.2% 36.4% 39.0% 5.2 5.0 5.3 5.2 4.0 3.7 4.2 3.3 2.9 11.2 9.0 7.9 13.6 11.0 9.6 22.9 19.6 18.2 4.6 3.3 2.8 4.1% 5.3% 5.5% 1.8% 1.8% 1.9% 1.49 1.48 1.60 -5.2% -0.4% 7.8% 7.41 8.89 10.49 0.52 0.53 0.55 -17.6% -15.6% -0.4% Avg. Daily nb traded shares:66,517 Main shareholders: IP Investimenti e partcipazioni 44.1%; Free float 44.0%; Management 11.9%; All share prices at 19/05/14. FINANCIAL CALENDAR (Source: Precise) PRICE (SHORT & LONG AVERAGE) titre 36 34 22/05/14 Dividend Payment 2013 19/05/14 Ex Dividend Date 2013 32 30 Profile: the company is specialized in the development, manufacturing and distribution of products in immunodiagnostics segment. The group develops, produces, and markets reagent kits for a wide range of in vitro tests for diagnosis in the main clinical areas (hepatitis and retrovirus, cardiac markers, infectious diseases, oncology and endocrinology and bone and minerals). After strong 5-year growth helped by the boom in demand for Vitamin- D tests, DiaSorin is now developing new drivers: 1) further menu expansion through new specialty test launches; 2) leveraging on Liaison XL’s new features to serve large hospital labs; 3) entry into the growing molecular diagnostic market through an innovative approach; 4) further geographical expansion and potential new acquisitions. SWOT Analysis Strengths • Assay menu that is unique for its width and presence of specialty tests • Anti-cyclical and defensive nature of its reference sector Weaknesses • Smaller size than big players • Strong cash flow generation and sound financials • USD exposure (about 35% of total sales) and Brazilian and Chinese currencies exposure (around 10%) • Negative impact of austerity measures in Europe and USA • Well established management Opportunities • Chances of finding further answers for hitherto unmet diagnostic needs • Dynamic growth in emerging markets • Growth through the importnat 5-year partnership with Roche and potential new acquisitions • Entrance in the molecular diagnostic segment Threats • Potential acquisitions realized at an unfair value or with strong difficulties in integration • Potential development of new and alternative technologies • Inability to develop new effective specialty tests Q1 14 results: the continuous strong growth in CLIA ex Vit-D tests sales (+21.4% at CER) was enough to offset the expected still negative trend in Vit-D tests sales (-7.2 at CER%). The profitability was negatively impacted by the negative forex effects (- EUR 1.1m) and by the costs to support the molecular business, which is still in a start-up phase (-EUR 1.9m). Net of these negative effects, the EBITDA margin would be 38.5%, in line with the profitability reported in the last 2 quarters of 2013. Cash remains strong and stable: Q1 14 free cash flow was EUR 27.5m, compared to EUR 25.2m in Q1 13. This confirms that DiaSorin is a value story that is very interesting for the strong cash generation; thanks its stable EBITDA margin, in a range of 38-40%, it generates around EUR 80-90m of free cash flow per year. FY 14 guidance confirmed: during the results conference call, the management confirmed its previously announced FY 14 guidance: 1) sales growth of +3 - 5% Y/Y at CER; 2) EBITDA growth of +3% Y/Y at CER. Recommendation: we maintain our positive view on the stock and confirm our Accumulate recommendation and our Target Price of EUR 34.70 per share (calculated based on our DCF model - WACC 7.4%, 2.0% perpetual growth rate). 28 26 Target Price: EUR 34.70 24 22 Analyst(s) 20 18 Mar 11 Source : Factset 70 Jun 11 Sep 11 Dec 11 Mar 12 Jun 12 Sep 12 Dec 12 Mar 13 Jun 13 Sep 13 Dec 13 Mar 14 Jun 14 Paola Saglietti Banca Akros +39 02 4344 4287 [email protected] Germany SMALL & MID CAPS SELECTION EUR 74.99 Hold DRAEGERWERK DRWG_p.DE/DRW3 GY Market capitalisation: EUR 1238m Healthcare EUR Sales (m) EBITDA (m) EBITDA margin EBIT (m) EBIT margin Net profit (reported) (m) Net profit (adj.) (m) Cash Flow from Ops.bef. chg in NWC (m) Net debt (Cash) (m) Net Debt/Equity Net Debt/EBITDA Interest cover (EBITDA/Fin. interest) ROCE (adj.) ROCE (adj.)/WACC EV / CE EV / Sales EV / EBITDA EV / EBIT P/E (adj.) P/BV OpFCF yield Dividend yield EPS (adj.) EPS (adj.) growth BVPS DPS Abs. Performances(12m,6m,3m,1m): 12 month High/low: EUR106.60 / 74.45 12/12 2,374 295 12.4% 230 9.7% 126 126 216 90.1 0.1 0.3 8.9 11.0% 1.3 1.1 0.6 4.9 6.3 9.9 1.8 8.3% 1.2% 7.69 4.7% 43.64 0.92 -24.0% 12/13 12/14e 12/15e 2,374 2,414 2,535 270 240 277 11.4% 10.0% 10.9% 201 164 191 8.5% 6.8% 7.5% 115 85.3 102 115 85.3 102 115 171 204 121 89.9 59.3 0.1 0.1 0.1 0.4 0.4 0.2 11.5 11.2 13.1 9.1% 7.2% 8.0% 1.1 0.9 1.0 1.2 1.0 0.9 0.8 0.6 0.6 6.6 6.0 5.1 8.9 8.7 7.4 13.7 14.4 12.1 1.9 1.4 1.3 -1.3% 3.5% 4.1% 1.1% 1.7% 2.0% 6.94 5.20 6.21 -9.8% -25.0% 19.4% 49.18 53.55 58.49 0.83 1.27 1.52 -16.7% -23.1% -14.3% Avg. Daily nb traded shares:22,108 Main shareholders: Free float 56.1% (28.7%); Draeger family 43.9% (71.3%); All share prices at 19/05/14. Profile: DRW3’s activities are divided into two segments: Dräger Medical (64% of revenues) specializes on respiratory, anaesthesia and monitoring systems that are mainly used at the acute point of care in hospitals. Dräger Safety (36% of revenues) manufactures and markets systems for personal protection and gas detection. The overall Dräger Group has a strong level of diversity: None of Dräger’s products accounts for more than 5% of sales. Dräger derives sales in more than 200 countries in more than 80 different currencies. SWOT Analysis Strengths • High barriers to entry related to quality and regulatory requirements • Demographics (growing & aging population) as long-term growth driver • Restructuring program has led to sustainable efficiency gains • Healthy balance sheet Weaknesses • Discount for corporate structure: 2 trading equity (ord. and pref.shares), 1 highly dilutive participation certificates 10xEBIT pref.margin shareslevel dividend), KGaA structure •(receive Draeger's is c. 200bps below the industry level. This makes the company less resilient in •downturns. Lack of external growth ambition Opportunities • Market growth driven by increasing healthcare and safety standards and the build up of the healthcare and public markets •infrastructure R&D projectsin/ emerging innovations are hitting the market, which should support the product mix • Structural efficiency improvements from a group-wide IT systems and re-organization of the company's sales & marketing organization • Transformation from a product into a service & solution provider may allow for stronger growth and higher margins Threats • Reduction in public funding may have an adverse impact on Dräger • Cyclicality of Dräger’s equipment business. Only c. 30% recurring sales from consumables & services • Rising low cost competition from Asian / cost pressure on healthcare systems • Consolidation in end markets, particularly in the hospital industry may lead to increased price pressure Recommendation: We rate Drägerwerk ‘Hold’ with a target price of EUR 76. Following disappointing Q1 2014 results and a stronger share price setback, it should be too early to bet on a stronger share price recovery. Dräger should have little self-help potential to improve profitability in the shorter term, thus profitability should largely depend on external factors (market environment, business volume, fx rates). Q2 should not be particularly strong (Q1 order book -3.3% YoY vs. headcount +5.7%; unchanged fx headwinds). We consider even Dräger’s revised FY2014 guidance as ambitious and potentially at risk. FINANCIAL CALENDAR (Source: Precise) PRICE (SHORT & LONG AVERAGE) titre 120 Target Price: EUR 76.00 110 100 DRAEGERWERK SMALL & MID CAPS SELECTION Analyst(s) 90 80 70 60 Mrz 11 Jun 11 Sep 11 Dez 11 Mrz 12 Jun 12 Sep 12 Dez 12 Mrz 13 Jun 13 Sep 13 Dez 13 Mrz 14 Jun 14 Konrad Lieder +49 69 5899 7436 Equinet Bank [email protected] Source : Factset 71 Germany SMALL & MID CAPS SELECTION EUR 26.95 Hold DRILLISCH DRIGn.DE/DRI GY Market capitalisation: EUR 1294m Telecommunications EUR Sales (m) EBITDA (m) EBITDA margin EBIT (m) EBIT margin Net profit (reported) (m) Net profit (adj.) (m) Cash Flow from Ops.bef. chg in NWC (m) Net debt (Cash) (m) Net Debt/Equity Net Debt/EBITDA Interest cover (EBITDA/Fin. interest) ROCE (adj.) ROCE (adj.)/WACC EV / CE EV / Sales EV / EBITDA EV / EBIT P/E (adj.) P/BV OpFCF yield Dividend yield EPS (adj.) EPS (adj.) growth BVPS DPS Abs. Performances(12m,6m,3m,1m): 12 month High/low: EUR27.65 / 12.00 12/12 324 61.9 19.1% 55.5 17.1% 23.5 32.7 32.0 255 2.1 4.1 5.8 26.6% 3.4 4.2 1.8 9.2 10.2 18.2 4.9 -4.7% 11.6% 0.61 3.5% 2.25 1.30 89.9% 12/13 12/14e 12/15e 290 297 309 70.8 87.3 100 24.4% 29.4% 32.4% 61.2 77.3 90.1 21.1% 26.0% 29.1% 156 56.3 63.2 41.4 56.3 63.2 162 66.6 74.1 -101 -85.5 -72.9 -0.5 -0.4 -0.4 -1.4 -1.0 -0.7 1.4 39.2 41.8 33.6% 44.1% 53.6% 4.4 5.7 6.9 6.9 9.6 10.1 3.1 4.1 3.9 12.8 13.9 12.2 14.9 15.7 13.6 26.0 23.0 20.5 5.0 6.6 7.2 15.4% 4.7% 5.3% 5.9% 6.3% 6.7% 0.81 1.17 1.32 31.6% 45.4% 12.2% 4.24 4.11 3.72 1.60 1.70 1.80 25.9% 12.6% 3.8% Avg. Daily nb traded shares:495,688 Profile: With nearly 2 million mobile customers and more than 350 employees, Drillisch AG is one of the largest network-independent telecommunications providers in Germany. The operating activities of the Drillisch Group are brought together in our wholly-owned subsidiaries Drillisch Telecom GmbH, MS Mobile Services GmbH and eteleon AG. With more than 25 years' experience as a wireless service provider and mobile virtual network operator (MVNO), Drillisch draws on standardised and unbundled advance services from the network operators Telefónica Germany GmbH & Co. OHG (O2) and Vodafone GmbH (Vodafone) to provide individual wireless services and products tailored to our customers' needs. SWOT Analysis Strengths • Price leader in domestic mobile, lean cost structures Weaknesses • Business model limited on German mobile • Net cash balance sheet, high shareholder remuneration • Deutsche Telekom partnership lost • Experienced mangement team with strong track record • Relatively low entry barriers • Rapid shift fo subscribers to the higher margin MVNO model Opportunities • German smartphone penetration might nearly double to 80% • M&A as a result of potential O2D/e-plus remedies • A smaller number of brands would reduce complexity • Own shares with EUR 50m gain could be sold • MVNO model might require additional resources • ARPU stabilisation as a result of consolidation • Operator pre-product conditions might worsen Threats • Market consolidation could lead to lower operator churn • Saturation of the smartphone market Main shareholders: Free float 86.7%; Drillisch 9.8%; M. Brucherseifer 2.0%; Management 1.5%; All share prices at 19/05/14. FINANCIAL CALENDAR (Source: Precise) PRICE (SHORT & LONG AVERAGE) titre 30 22/05/14 Ex Dividend Date 2013 22/05/14 Dividend Payment 2013 21/05/14 AGM 2013 25 20 15 Source : Factset 72 Target Price: EUR 27.50 Analyst(s) 10 5 Mrz 11 Recommendation: We have recently lowered our recommendation from ‘Accumulate’ to ‘Hold’ as our PT of EUR 27.50 was reached. Despite DRI’s still attractive dividend yields of more than 6%, we point now to the valuation that has come to 12x EV/EBITDA’15e which appears not attractive anymore. The 1Q14 report was very solid on new adds and margin, the average gross profit per user in the highly important budget tariff group failed to meet expectations slightly. We rate the outlook for the EBITDA’14e of EUR 82-85m however not in danger and model further increased to c. EUR 100m in FY15e, basically in line with the management guidance. Speculative appeal stems from potential M&A as a consequence of likely regulator remedies from the O2 Deutschland / e-plus deal. Jun 11 Sep 11 Dez 11 Mrz 12 Jun 12 Sep 12 Dez 12 Mrz 13 Jun 13 Sep 13 Dez 13 Mrz 14 Jun 14 Adrian Pehl, CFA Equinet Bank +49 69 58997 438 [email protected] Spain SMALL & MID CAPS SELECTION EUR 4.94 Reduce DURO FELGUERA MDF.MC/MDF SM Market capitalisation: EUR 790m Industrial Engineering EUR Sales (m) EBITDA (m) EBITDA margin EBIT (m) EBIT margin Net profit (reported) (m) Net profit (adj.) (m) Cash Flow from Ops.bef. chg in NWC (m) Net debt (Cash) (m) Net Debt/Equity Net Debt/EBITDA Interest cover (EBITDA/Fin. interest) ROCE (adj.) ROCE (adj.)/WACC EV / CE EV / Sales EV / EBITDA EV / EBIT P/E (adj.) P/BV OpFCF yield Dividend yield EPS (adj.) EPS (adj.) growth BVPS DPS Abs. Performances(12m,6m,3m,1m): 12 month High/low: EUR5.46 / 4.55 12/12 916 126 13.7% 118 12.9% 116 116 126 -320 -1.0 -2.5 nm -291% nm nm 0.5 3.7 4.0 6.6 2.6 6.5% 8.3% 0.72 16.3% 1.86 0.40 -8.3% 12/13 12/14e 12/15e 924 866 880 106 85.4 81.9 11.5% 9.9% 9.3% 108 77.8 74.2 11.7% 9.0% 8.4% 83.5 66.8 64.0 83.5 66.8 64.0 84.1 75.4 72.7 -159 -168 -163 -0.6 -0.6 -0.5 -1.5 -2.0 -2.0 38.7 nm nm 107% 63.7% 45.0% 9.9 5.9 4.2 8.7 7.1 5.3 0.7 0.7 0.7 6.1 7.6 8.0 6.0 8.3 8.8 9.4 11.8 12.3 3.3 3.0 2.8 -3.1% 6.6% 4.2% 5.3% 4.9% 4.9% 0.52 0.42 0.40 -28.0% -19.9% -4.2% 1.48 1.63 1.79 0.26 0.24 0.24 4.2% 2.3% 0.0% Avg. Daily nb traded shares:60,126 Profile: Duro Felguera is divided into three business lines: 1. Large turnkey projects, the engineering business, broken down into Energy, Mining & Handling and Oil & Gas facilities (82% of sales 13). The company specialises in simple or combined gas turbine power plants, conventional thermal plants and desulphurisation and denitrification plants for coal-fired power stations. Industrial plants include engineering and execution of turnkey projects in the mining, material handling, steelworks and petrochemical sectors. 2. Manufacturing and “others” (8% of sales 13). 3. Specialised Services (10% of sales 13): provides plant assembly, operations, and maintenance services. SWOT Analysis Strengths • Collaboration agreements with the four main electrical equipment providers. • Continuation of the dividend policy (although expected to be reduced) • 150 years of industrial experience Weaknesses • Low free float (34%) • Concentration on few projects • Lower prepayments • Solid finance Opportunities • Good backlog • First class clients Threats • Economic deceleration. Backlog depends on the global economy • Risks in developing countries • Presence in the energy sector. • Risks of delays in projects in Venezuela, increasing costs. • Presence in developing countries • Competition from larger engineering companies Main shareholders: Free float 40.0%; Invs El Piles 24.4%; Invs Río Magdalena 9.6%; Onchena SL 5.0%; All share prices at 19/05/14. FINANCIAL CALENDAR (Source: Precise) PRICE (SHORT & LONG AVERAGE) titre 6.2 6.0 20/05/14 AGM 2013 19/05/14 AGM 2013 5.8 5.6 5.4 Recommendation: Weak 1Q14 results, with EBITDA falling 12%. The fall in the financial line resulted in EBT (EUR10.3m) plummeting 46% vs. 1Q’13, and EBT margin of 5.8%. As the most profitable project nears its completion, margins will be closer to current market levels. In addition, Duro Felguera has decided to increase provisions for contingencies in the Roy Hill project (Australia) due to the increasing risk perceived following the exclusion of Forge from the project. Duro Felguera’s net cash reached EUR217m, above the EUR159m at 2013. 1Q’14 order intake dropped to EUR90m. According to the company, future projects have a greater probability of becoming firm contracts in 2H’14. Backlog reached EUR1,872m and 49% is made up by energy projects.. Target Price: EUR 4.85 5.2 5.0 4.8 Analyst(s) 4.6 4.4 4.2 Mar 11 Jun 11 Sep 11 Dec 11 Mar 12 Jun 12 Sep 12 Dec 12 Mar 13 Jun 13 Sep 13 Dec 13 Mar 14 Jun 14 Iñigo Recio Pascual BEKA Finance +34 91 436 7814 [email protected] Source : Factset 73 Italy SMALL & MID CAPS SELECTION EUR 1.47 Hold EDITORIALE L'ESPRESSO ESPI.MI/ES IM Market capitalisation: EUR 602m Media EUR Sales (m) EBITDA (m) EBITDA margin EBIT (m) EBIT margin Net profit (reported) (m) Net profit (adj.) (m) Cash Flow from Ops.bef. chg in NWC (m) Net debt (Cash) (m) Net Debt/Equity Net Debt/EBITDA Interest cover (EBITDA/Fin. interest) ROCE (adj.) ROCE (adj.)/WACC EV / CE EV / Sales EV / EBITDA EV / EBIT P/E (adj.) P/BV OpFCF yield Dividend yield EPS (adj.) EPS (adj.) growth BVPS DPS Abs. Performances(12m,6m,3m,1m): 12 month High/low: EUR1.95 / .77 12/12 804 102 12.7% 60.4 7.5% 21.8 21.8 64.0 108 0.2 1.1 6.3 4.5% 0.6 0.6 0.6 4.6 7.7 16.4 0.6 3.8% 0.0% 0.05 -62.8% 1.36 0.00 73.4% 12/13 12/14e 12/15e 708 675 691 63.5 77.7 89.0 9.0% 11.5% 12.9% 31.3 46.7 58.0 4.4% 6.9% 8.4% 3.7 13.6 21.3 3.7 13.6 21.3 36.1 44.9 52.6 73.5 76.7 49.0 0.1 0.1 0.1 1.2 1.0 0.6 4.5 6.5 11.1 1.1% 2.6% 3.6% nm 0.3 0.5 0.9 1.0 1.0 0.9 1.0 1.0 10.2 9.0 7.5 20.7 14.9 11.6 nm 44.1 28.3 1.0 1.0 1.0 6.7% 0.0% 6.2% 0.0% 2.0% 2.0% 0.01 0.03 0.05 -83.2% nm 56.2% 1.37 1.40 1.43 0.00 0.03 0.03 4.2% -23.0% -9.6% Avg. Daily nb traded shares:1,138,793 Main shareholders: Carlo De Benedetti 53.3%; Free float 40.1%; Eredi Caracciolo 11.7%; SWOT Analysis All share prices at 19/05/14. FINANCIAL CALENDAR (Source: Precise) PRICE (SHORT & LONG AVERAGE) titre 2.2 23/07/14 Results 2.0 1.8 Profile: L’Espresso is one of the leading media groups in Italy, active in: 1) newspapers: La Repubblica, the first national title in Italy with 324K avg copies sold and 2.8m readers, and 16 local titles with a total of 365K copies and >3m readers; 2) magazines: 6 titles, among which L’Espresso, the second news weekly in Italy with 239K copies; 3) radio: 3 national channels, with a total of 8m daily listeners, including Radio DeeJay, the second commercial radio in Italy with 5m listeners; 4) television: Deejay TV, a national music channel; 5) Internet: a yearly average of 1.8m unique users. L’Espresso ad agency Manzoni controls c. 6% of the Italian market. In spite of flattish newspapers diffusion in recent years, l’Espresso was able to keep circulation revenues increasing until 2006 thanks to the success of add-ons (like books, CDs and DVDs). The saturation of the market did however lead to a progressive decline in this revenue source. Q1 2014 results reflected the weak trend of the reference markets in terms of both advertising and diffusion. Indeed, in 2m 2014 the Italian ad collection was down by 15.7% Y/Y in print, 6% in on-line while radio was up by 7.5%. L’Espresso was affected by the loss of third-party collection whereas the performance of group properties outperformed the market with -9.7%. The diffusion figures follow the general market trend (-12% according to ADS). EBITDA was better than expected as a combination of tight cost cutting, decline of low margin activity (third-party ad collection) and more favourable accounting of certain provisions (estimated impact a couple of millions EUROs). Net debt declined by EUR 15m in the quarter to EUR 58m (slightly better than expected). Outlook: L’Espresso said in a note that based on the current booking figures, the second quarter outlook signals an attenuation of the negative trend. We have cut our full-year estimates to reflect the trend in third party advertising with a -5/3./1.5% negative impact on FY 2013/14/15 respectively. Corporate Action: L’Espresso is now in the process of merging its two Digital Multiplexes with the three of TI Media obtaining 30% of the MuxCo. The deal announced on April 9 and subject to the Agcom approval, could help improve L’Espresso financial position further, as a disposal is planned by year end. On April 2, the company issued a EUR 100m equity-linked bond with a fixed coupon of 2.625% and a conversion price of EUR 2.1523. The proceeds will help refinance the EUR 227m outstanding bond due next October, along with the EUR 182m cash available. A huge potential tax bill. In May 2012, ES disclosed an adverse sentence on behalf of a fiscal tribunal, referred to a deal dating back in 1991. The ruling states that a EUR 228m capital gain would have been taxable. ES estimates the potential sanction could reach EUR 350m. A different interpretation would suggest EUR 150m. ES asked thirdgrade review of the sentence; the Co declared to be confident of a positive outcome based on legal opinions and past sentences; the Co could be able to afford a EUR 150m bill through liquid assets (EUR 190m). The impact on FV would be EUR 0.36; the worst case scenario would wipe-out 85% of our FV. 2014H1 Strengths • Fully diversified and leader in media business Weaknesses • Pure domestic player, with no international role • Tight cost control Opportunities • DTT bandwidth rental/Mux disposal • Further cost cutting action • Small TV broadcasting business Threats • Increase in competition in the media sector • Negative tax ruling 1.6 1.4 Recommendation: In-line Q1 2014 publication, including weak top line but solid EBITDA performance. Limited impact on estimates. Neutral reco confirmed. Target Price: EUR 1.70 1.2 1.0 0.8 0.6 0.4 Mar 11 Source : Factset Jun 11 Sep 11 Dec 11 Mar 12 Jun 12 Sep 12 Dec 12 Mar 13 Jun 13 Sep 13 Dec 13 Mar 14 Jun 14 Analyst(s) Andrea Devita, CFA 74 Banca Akros +39 02 4344 4031 [email protected] Italy SMALL & MID CAPS SELECTION EUR 37.76 Accumulate EI TOWERS EIT.MI/EIT IM Market capitalisation: EUR 1067m Support Services EUR Sales (m) EBITDA (m) EBITDA margin EBIT (m) EBIT margin Net profit (reported) (m) Net profit (adj.) (m) Cash Flow from Ops.bef. chg in NWC (m) Net debt (Cash) (m) Net Debt/Equity Net Debt/EBITDA Interest cover (EBITDA/Fin. interest) ROCE (adj.) ROCE (adj.)/WACC EV / CE EV / Sales EV / EBITDA EV / EBIT P/E (adj.) P/BV OpFCF yield Dividend yield EPS (adj.) EPS (adj.) growth BVPS DPS Abs. Performances(12m,6m,3m,1m): 12 month High/low: EUR44.00 / 26.65 12/12 234 94.6 40.4% 44.5 19.0% 23.6 23.6 73.7 189 0.4 2.0 15.5 3.9% 0.5 1.0 3.1 7.6 16.2 24.7 1.1 3.1% 2.0% 0.84 nm 18.95 0.42 32.5% 12/13 12/14e 12/15e 233 236 243 106 109 114 45.3% 46.3% 47.0% 58.4 63.2 67.9 25.0% 26.7% 28.0% 32.9 35.5 39.3 32.9 35.5 39.3 80.2 81.9 85.7 131 86.6 46.7 0.2 0.1 0.1 1.2 0.8 0.4 high 16.3 19.7 5.4% 5.9% 6.7% 0.7 0.7 0.8 1.6 1.7 1.7 4.4 4.6 4.4 9.7 10.0 9.3 17.5 17.4 15.6 28.7 30.0 27.1 1.7 1.8 1.8 7.6% 4.2% 6.4% 0.0% 2.7% 2.9% 1.17 1.26 1.39 39.3% 7.8% 10.7% 19.69 20.95 21.33 0.00 1.01 1.11 12.4% -3.4% -6.7% Avg. Daily nb traded shares:62,167 Profile: EI Towers (EIT) is the largest Italian tower infrastructure operator for broadcasting and telecom players, with 3,200 sites under management including 2,300 directly owned. EIT is the result of the merger between the listed company DMT and Mediaset’s tower network operator unit, which was completed at the beginning of 2012. In turn, DMT originated back in year 2000 from the management buy-out of a MS technological division operating in the design and manufacturing of digital signal hardware and antennas. EI Towers is a pure play in the Italian tower sector, as the hardware activities of DMT, included in the Technology division, were disposed at the beginning of 2010 following three years of EBITDA losses. DMT grew to a size of 1,500 towers in 6 years in virtue of the acquisition of small local operators totalling c EUR 200m EV. This investment has been partially financed with the EUR 80m proceeds from the IPO in 2004. With the integration of MS EI Towers, it reached 3,200 sites, securing the leadership in the Italian broadcasting market. Solid FY 2013 results. Also the last quarter was characterized by solid results with strong margin performance. Revenues were slightly down Y/Y on a reported basis, due to the presence of switch-off related installations last year (EUR 6.7m); the organic performance was +2.5% with 1.8pp contributed by inflation indexation. The EBITDA was in line with our expectations and slightly higher than the revised target of EUR 105m. EIT basically achieved the 5-year plan efficiency target in just two years, with EUR 7.5m in both 2012 and incremental EUR 7.5m in 2013. Capex was EUR 10m in the full-year, as anticipated by the company with 9m publication (from EUR 12m previous target, originally EUR 20m). The pre-dividend FCF was EUR 58m, vs. a target of above EUR 50m; de-leveraging was EUR 27m in Q4. FY 2014 Outlook. EIT management expects EUR 3/4m increase in EBITDA, with low inflation offset by efficiencies, capex below EUR 15m and tax rate at 37%. The cash taxes will be around EUR 35. The forthcoming attribution of new muxes will not have an impact this year.. Mid-term targets. According to the business plan EIT is looking for EUR 268m revenues and EUR 128m EBITDA in 2016 (3.2% and 10.5% CAGR respectively). M&A. EIT acquired a small tower portfolio (mainly mobile towers) in February at a cost of EUR 4m (7.4x the underlying EBITDA). EIT is preparing to stepup its growth with M&A including diversification in mobile and/ or “transformational” deals. These could include Wind or TI towers, as well as Rai Way. The Board proposes to distribute no dividend “in order to keep financial flexibility”. The mgmt said such transformational deals could materialize at the end of this year beginning 2015. SWOT Analysis Strengths • Market leadership Weaknesses • Customer concentration • Full service operator • Domestic market concentration • Predictable revenue curve, High cash conversion Main shareholders: Free float 58.2% (0.0%); Mediaset 40.0% (0.0%); Mr Falciai 1.8% (0.0%); All share prices at 19/05/14. FINANCIAL CALENDAR (Source: Precise) PRICE (SHORT & LONG AVERAGE) Opportunities • New Mux Threats • Potential new competition • Additional telco business (eg Atlantia) • Substituting technologies • Domestic Consolidation • Regulatory risk titre 50 45 Recommendation: Accumulate. Following FY 2013 publication, we have increased our TP to EUR 43, to include the better than expected NFP, the expected value (EUR 2 at 50%) of a new mux and more favourable DCF parameters. We maintain a positive view on the stock. The next few months will be eventful with the Mux award, potential large M&A and the presentation of the new 2014/18 business plan. Target Price: EUR 43.00 40 35 30 25 20 15 Mar 11 Source : Factset Jun 11 Sep 11 Dec 11 Mar 12 Jun 12 Sep 12 Dec 12 Mar 13 Jun 13 Sep 13 Dec 13 Mar 14 Jun 14 Analyst(s) Andrea Devita, CFA Banca Akros +39 02 4344 4031 [email protected] 75 Germany SMALL & MID CAPS SELECTION EUR 28.61 Reduce ELRINGKLINGER ZILGn.DE/ZIL2 GR Market capitalisation: EUR 1813m Automobiles & Parts EUR Sales (m) EBITDA (m) EBITDA margin EBIT (m) EBIT margin Net profit (reported) (m) Net profit (adj.) (m) Cash Flow from Ops.bef. chg in NWC (m) Net debt (Cash) (m) Net Debt/Equity Net Debt/EBITDA Interest cover (EBITDA/Fin. interest) ROCE (adj.) ROCE (adj.)/WACC EV / CE EV / Sales EV / EBITDA EV / EBIT P/E (adj.) P/BV OpFCF yield Dividend yield EPS (adj.) EPS (adj.) growth BVPS DPS Abs. Performances(12m,6m,3m,1m): 12 month High/low: EUR35.14 / 24.20 12/12 1,127 218 19.4% 139 12.3% 85.7 85.7 112 260 0.4 1.2 14.5 8.1% 1.0 1.9 1.8 9.2 14.4 18.8 2.6 -0.1% 1.8% 1.35 2.2% 9.64 0.45 7.3% 12/13 12/14e 12/15e 1,175 1,271 1,347 240 245 267 20.4% 19.3% 19.8% 165 167 186 14.0% 13.1% 13.8% 105 108 122 89.2 106 120 120 204 220 295 268 210 0.4 0.3 0.2 1.2 1.1 0.8 15.3 21.2 26.7 8.6% 8.3% 8.9% 1.1 1.0 1.1 2.0 1.8 1.7 2.0 1.8 1.6 9.7 9.1 8.2 14.0 13.4 11.8 21.0 17.1 15.1 2.8 2.4 2.1 -0.4% 3.1% 4.9% 1.7% 2.1% 2.4% 1.41 1.67 1.89 4.1% 18.6% 13.4% 10.69 12.04 13.58 0.50 0.60 0.68 -6.5% 3.5% -0.1% Avg. Daily nb traded shares:47,034 Profile: ElringKlinger is a manufacturer of cylinder-head gaskets, specialty gaskets, cam cover modules and heat shields as well as high tech plastic components. The largest part of the business is related to the automotive industry. Additionally, the company has a lucrative aftermarket business and provides engine testing services. SWOT Analysis Strengths • Strong top-line growth. Weaknesses • High capital requirements. • High margins. • High labour costs in Germany. • Strong technological position. Opportunities • Growth with new products. Threats • Margin pressure. • Market share gains in Emerging Markets. Recommendation: ElringKlinger is not only one of the world’s most profitable automotive suppliers; it is also a supplier with above average organic growth. In recent years ElringKlinger has developed a broad range of new high tech products, has won new customers and successfully penetrated new markets. However, this growth has resulted in a strong increase of capital employed, while earnings did not keep track with this development. ROCE is one of the weakest in sector. Given that the valuation is still one of the highest in the sector, we see downside risks for the share price and thus advise to Reduce ElringKlinger shares. Main shareholders: Lechler Family 52.0%; Free float 48.0%; All share prices at 19/05/14. FINANCIAL CALENDAR (Source: Precise) PRICE (SHORT & LONG AVERAGE) titre 36 07/08/14 Results 34 32 30 28 2014H1 19/05/14 Ex Dividend Date 2013 19/05/14 Dividend Payment 2013 26 24 22 20 18 16 14 Mar 11 Source : Factset 76 Jun 11 Sep 11 Dec 11 Mar 12 Jun 12 Sep 12 Dec 12 Mar 13 Jun 13 Sep 13 Dec 13 Mar 14 Jun 14 Target Price: EUR 24.00 ELRINGKLINGER SMALL & MID CAPS SELECTION Analyst(s) Tim Schuldt, CFA +49 69 5899 7433 Equinet Bank [email protected] Spain SMALL & MID CAPS SELECTION EUR 2.11 Accumulate ENCE ENC.MC/ENC SM Market capitalisation: EUR 527m Basic Resources EUR Sales (m) EBITDA (m) EBITDA margin EBIT (m) EBIT margin Net profit (reported) (m) Net profit (adj.) (m) Cash Flow from Ops.bef. chg in NWC (m) Net debt (Cash) (m) Net Debt/Equity Net Debt/EBITDA Interest cover (EBITDA/Fin. interest) ROCE (adj.) ROCE (adj.)/WACC EV / CE EV / Sales EV / EBITDA EV / EBIT P/E (adj.) P/BV OpFCF yield Dividend yield EPS (adj.) EPS (adj.) growth BVPS DPS Abs. Performances(12m,6m,3m,1m): 12 month High/low: EUR3.13 / 2.05 12/12 828 139 16.8% 82.3 9.9% 43.0 43.0 100 277 0.4 2.0 5.9 5.6% 0.6 0.8 1.0 5.7 9.7 11.9 0.7 -12.8% 3.4% 0.17 4.5% 2.90 0.07 -13.7% 12/13 12/14e 12/15e 853 722 731 142 69.5 111 16.7% 9.6% 15.2% 31.8 -16.4 23.8 3.7% nm 3.3% 4.3 -31.3 -6.3 4.3 -31.3 -6.3 115 54.7 80.8 195 257 301 0.3 0.4 0.5 1.4 3.7 2.7 5.0 2.4 3.4 2.4% -1.2% 1.7% 0.3 -0.1 0.2 0.9 0.8 0.9 1.0 1.1 1.2 6.3 11.5 7.6 28.0 nm 35.4 nm nm nm 1.0 0.8 0.8 15.5% -6.2% -4.6% 3.3% 1.4% 1.4% 0.02 -0.12 -0.03 -90.0% -chg +chg 2.84 2.64 2.59 0.07 0.03 0.03 -29.0% -20.0% -2.1% Avg. Daily nb traded shares:640,687 Profile: ENCE is one of the largest eucalyptus pulp producer in the world and the one with the largest market share in Europe. ENCE's three plants have a capacity of 1,340,000 tons of pulp each year. Europe makes up 94% of ENCE's sales. The main variables affecting ENCE are the USD/EUR exchange rate, pulp prices and prices for energy generated with biomass. ENCE is the leading company in renewable energy through the use of biomass residue and energy crops in Spain. The current capacity of the three production mills is an operating 229 MW, of which 180 MW are exclusively from biomass. Ence develops biomass projects, one of which (Huelva 50 MW) started operations by the end of 2012 and another one in 2014 (Mérida 20 MW). Ence has started a plan to compensate the important impact from electricity regulation. SWOT Analysis Strengths • ENCE is the leader in Europe in eucalyptupulp (15%). Weaknesses • New renewable energy projects currently at a standstill. • High quality of its product and large client portfolio • Important impact from new electricity regulation. • Factories at good locations, near raw materials and clients. • Pulp prices depend of growth in China Opportunities • New restructuring measures Threats • Possibility in the medium-term of new capacities coming on stream that would lead to oversupply • Environmental requisites could become more stringent. • Eucalyptus pulp gaining ground over pine. • The Iberian Peninsula is the only European region capable of producing eucalyptus cellulose. • Disposal of forest assets progressively. Main shareholders: Free float 35.0%; Retos Operativos XXI 25.6%; Alcor Holding 19.8%; Fuente Salada 5.0%; All share prices at 19/05/14. FINANCIAL CALENDAR (Source: Precise) PRICE (SHORT & LONG AVERAGE) titre 3.2 30/07/14 Results 3.0 2014H1 Recommendation: 1Q’14 sales -21%, EBITDA -78% and Net Losses EUR-14m, impacted by the changes to the electricity regulation, very low pool prices (EUR26/MWh) and coinciding with certain industrial problems as well as a strong euro, thus the exceptionally low results (cannot be extrapolated). The Ministerial Order has not been approved as it is awaiting the allegations on behalf of the sector and companies affected. ENCE’s results estimate a 48% impact of the new regulation. If approved as is, additional cuts would have to be applied to energy revenues. The final draft is expected to be released in June/July and ENCE confides in maintaining the estimated 48% impact. ENCE has begun a competitive plan (2014-16) with cost management measures, investments in efficiency and restructuring of mix. 2.8 Target Price: EUR 2.35 2.6 2.4 2.2 2.0 1.8 1.6 1.4 1.2 Mar 11 Source : Factset Jun 11 Sep 11 Dec 11 Mar 12 Jun 12 Sep 12 Dec 12 Mar 13 Jun 13 Sep 13 Dec 13 Mar 14 Jun 14 ENCE SMALL & MID CAPS SELECTION Analyst(s) Iñigo Recio Pascual +34 91 436 7814 BEKA Finance [email protected] 77 Italy SMALL & MID CAPS SELECTION EUR 46.49 Hold ENGINEERING ENG.MI/ENG IM Market capitalisation: EUR 581m Software & Computer Services EUR Sales (m) EBITDA (m) EBITDA margin EBIT (m) EBIT margin Net profit (reported) (m) Net profit (adj.) (m) Cash Flow from Ops.bef. chg in NWC (m) Net debt (Cash) (m) Net Debt/Equity Net Debt/EBITDA Interest cover (EBITDA/Fin. interest) ROCE (adj.) ROCE (adj.)/WACC EV / CE EV / Sales EV / EBITDA EV / EBIT P/E (adj.) P/BV OpFCF yield Dividend yield EPS (adj.) EPS (adj.) growth BVPS DPS Abs. Performances(12m,6m,3m,1m): 12 month High/low: EUR54.05 / 27.16 12/12 770 92.6 12.0% 74.6 9.7% 51.9 41.4 70.7 28.6 0.1 0.3 25.2 6.5% 0.6 0.3 0.5 4.1 5.0 7.6 0.9 12.4% 1.8% 3.31 -9.2% 27.18 0.45 50.8% 12/13 823 101 12.2% 80.1 9.7% 46.9 53.1 67.5 -39.0 -0.1 -0.4 17.5 6.5% 0.7 0.4 0.6 5.3 6.7 10.2 1.4 15.3% 1.1% 4.25 28.1% 31.21 0.53 14.8% 12/14e 12/15e 862 890 107 106 12.4% 11.9% 86.8 87.3 10.1% 9.8% 54.8 53.6 46.8 45.6 74.7 72.3 -83.3 -120 -0.2 -0.3 -0.8 -1.1 nm nm 6.9% 6.8% 0.7 0.7 0.4 0.4 0.6 0.6 5.0 4.7 6.1 5.7 12.4 12.7 1.4 1.2 9.8% 8.5% 1.4% 1.4% 3.75 3.65 -11.8% -2.6% 34.30 37.29 0.66 0.66 -3.1% -6.1% Avg. Daily nb traded shares:4,281 Profile: Founded in Padua in 1980, the Engineering group is one of the largest Italian players in Information Technology services. The business model extends into a number of areas, including system integration, organizational consultancy and specialist services, proprietary application solutions, management applications and outsourcing. The target market consists of medium-to-large-sized customers in all primary market segments: public sector (central and local administration, healthcare and defence), Finance (banks, insurances and asset managers), industry and services, TLC and utilities. Recurring revenues account for c. 60% of group turnover and include outsourcing, license fees, application management revenues and evolutionary maintenance services. Over the past few years, ENG has been able to outperform both Italian GDP growth and the Italian IT market. Since its creation, Engineering has grown both internally and through acquisitions. In 2008, the group widened its diversification in terms of products, markets and countries with the acquisition of the Italian activities of Atos Origin (EUR 280m sales in 2007). In March 2013, ENG announced the acquisition of the Italian branch of TSystems International (a subsidiary of DT). The deal implied EUR 42m cash-in for ENG. FY 2013: The economic and financial performance in Q4 2013 was satisfying. Revenues were in line with expectations and within the guidance of EUR 810/830m, with Q4 keeping the growth rate of the first nine months. EBITDA was slightly above the guidance (EUR 98/100m) and our forecasts (it also includes residual integration costs with T-Systems) with Q4 flat Y/Y. ENG generated EUR 32m cash in Q4, EUR 68m on a full-year basis (incl. EUR 41m T-System). The Board proposed a dividend of EUR 0.656 per share, implying +23% on the FY 2012 DPS. MHT acquisition. On February 3, 2014, ENG announced the acquisition of MHT, an Italian IT services company focussed on the implementation of Microsoft products in ERP and CRM for SMEs. The deal includes an investment in the range of EUR 4.5/6m. MHT generated EUR 9.4m annual revenues through a workforce of 90 units. SWOT Analysis Strengths • Promising portfolio of reference customers Weaknesses • Strong dependence on the Italian IT market • Well-implemented vertical offering • WC dynamic affected by Public sector exposure • Business model with high entry barriers • Corporate tax higher than its international peers Menicucci Marilena 12.0%; Bestinver 10.0%; Opportunities • Increased contribution from outsourcing Threats • Firms could reduce their IT budget All share prices at 19/05/14. • Further expansion through acquisitions and partnership • Increasing competition from global players • Strengthening in Brazil • Souring price pressure Main shareholders: One Equity Partners 29.9%; Free float 24.9%; Cinaglia Michele 23.2%; FINANCIAL CALENDAR (Source: Precise) PRICE (SHORT & LONG AVERAGE) titre 55 10/07/14 Dividend Payment 50 45 40 2013 Recommendation: ENG stock performed very well in 2013 with +72%, while YTD it is up double-digit. Given the underlying trend in the sovereign bond, once can say the current price level is not stretched on a relative basis. On Mar-4, we have increased our TP to EUR 50 (+25%) assuming 9% WACC (from 10%), 1.5% g. Further upside shall be tested against accelerated revenue growth, earnings surprise or the final implementation of Public Administration debt repayment. 35 Target Price: EUR 50.00 30 25 20 Mar 11 Source : Factset Jun 11 Sep 11 Dec 11 Mar 12 Jun 12 Sep 12 Dec 12 Mar 13 Jun 13 Sep 13 Dec 13 Mar 14 Jun 14 ENGINEERING SMALL & MID CAPS SELECTION Analyst(s) Andrea Devita, CFA 78 +39 02 4344 4031 Banca Akros [email protected] Portugal SMALL & MID CAPS SELECTION EUR 3.64 Hold ESPIRITO SANTO SAUDE ESSS.LS/ESS PL Market capitalisation: EUR 348m Healthcare EUR Sales (m) EBITDA (m) EBITDA margin EBIT (m) EBIT margin Net profit (reported) (m) Net profit (adj.) (m) Cash Flow from Ops.bef. chg in NWC (m) Net debt (Cash) (m) Net Debt/Equity Net Debt/EBITDA Interest cover (EBITDA/Fin. interest) ROCE (adj.) ROCE (adj.)/WACC EV / CE EV / Sales EV / EBITDA EV / EBIT P/E (adj.) P/BV OpFCF yield Dividend yield EPS (adj.) EPS (adj.) growth BVPS DPS Abs. Performances(12m,6m,3m,1m): 12 month High/low: EUR3.73 / 3.12 12/13 374 59.0 15.8% 30.9 8.3% 14.0 14.0 42.1 210 1.5 3.6 5.7 0.0% 0.0 12/14e 385 60.3 15.7% 33.3 8.6% 16.8 16.8 43.7 186 1.0 3.1 6.3 0.0% 0.0 1.2 1.4 8.8 16.0 20.7 2.0 1.7% 1.2% 0.18 19.6% 1.85 0.04 12/15e 12/16e 398 411 65.1 67.8 16.3% 16.5% 38.4 41.2 9.6% 10.0% 22.0 25.0 22.0 25.0 48.6 51.5 163 141 0.8 0.7 2.5 2.1 8.0 9.9 0.0% 0.0% 0.0 0.0 1.1 1.1 1.3 1.2 7.8 7.2 13.3 11.8 15.8 13.9 1.8 1.6 8.1% 8.2% 1.6% 1.8% 0.23 0.26 30.9% 13.7% 2.02 2.22 0.06 0.07 12.3% 7.1% Avg. Daily nb traded shares:41,797 0.0% 0.15 +chg 1.48 0.00 Main shareholders: Espírito Santo Healthcare Investments 51.0%; Free float 26.7%; Och-Ziff 5.4%; T.Rowe 5.0%; All share prices at 19/05/14. FINANCIAL CALENDAR (Source: Precise) PRICE (SHORT & LONG AVERAGE) titre 3.80 3.70 Profile: Espírito Santo Saúde (ESS) is one of the reference players in Portuguese private healthcare sector. The company, incorporated in 2000, currently operates a network of 9 hospitals (one of which through a Public Private Partnership – PPP), 7 outpatient clinics and 2 senior residences. ESS’ growth has been based on both organic growth and acquisitions, allowing it to become one of the three largest private healthcare providers in Portugal (alongside José de Mello Saúde and Hospitais Privados de Portugal). The company operates 3 main areas (Private Healthcare, Public Healthcare and Other Businesses) and runs a Corporate Center unit destined to free the main areas from non-core activities, while capturing the associated synergies. At YE13, the Private Healthcare area accounted for 77.1% of the EUR 373.6m total operating revenues, the Public Healthcare segment generated 22% and the Other Businesses, namely Senior Residences, were responsible for the remaining 0.9%. SWOT Analysis Strengths • Leading position of Hospital da Luz (the largest private hospital and one of the most technologically advanced in •Portugal) Highly experienced management team (in ESS since inception) • Support and MLT commitment of Espírito Santo Group • Differentiation given ESS Integrated offer (Hospitals, Outpatient Clinics and Senior Residences) Opportunities • Demographic trends in Portugal (ageing population) • Financial difficulties in the public sector (more PPPs) Weaknesses • Senior Residences financial performance • Net Debt close to 3.6x EBITDA • Business concentration in Portugal Threats • Challenging economic environment in Portugal (high unemployment and low GDP growth) • Potential competition from other private players in a market with positive outlook • Highly fragmented private healthcare market (top 3 players account for around 12% of the market) • Expansion of Hospital da Luz and internationalization (Angola) Recommendation: We initiated our coverage of ESS on 28 March with a YE14 fair value of EUR 3.90 per share and a Hold recommendation. Overall, we believe that the healthcare sector in Portugal will tend to benefit from demographic trends as Portugal’s population is ageing fast due to a combination of longer life expectancy with a marked decline in birth rates. In this context, we also consider that public awareness of private healthcare companies’ competency will increase, along with demand for its services, being ESS one of the main potential winners of these dynamics. 1Q14 results will be published on Monday 26 May. 3.60 Target Price: EUR 3.90 3.50 3.40 3.30 Analyst(s) 3.20 3.10 Mar 11 Source : Factset Jun 11 Sep 11 Dec 11 Mar 12 Jun 12 Sep 12 Dec 12 Mar 13 Jun 13 Sep 13 Dec 13 Mar 14 Jun 14 André Rodrigues José Mota Freitas, CFA Caixa-Banco de Investimento +351 21 389 68 39 +351 22 607 09 31 [email protected] [email protected] 79 Spain SMALL & MID CAPS SELECTION EUR 3.86 PYCE.MC/PAC SM Market capitalisation: EUR 334m Basic Resources EUR Sales (m) EBITDA (m) EBITDA margin EBIT (m) EBIT margin Net profit (reported) (m) Net profit (adj.) (m) Cash Flow from Ops.bef. chg in NWC (m) Net debt (Cash) (m) Net Debt/Equity Net Debt/EBITDA Interest cover (EBITDA/Fin. interest) ROCE (adj.) ROCE (adj.)/WACC EV / CE EV / Sales EV / EBITDA EV / EBIT P/E (adj.) P/BV OpFCF yield Dividend yield EPS (adj.) EPS (adj.) growth BVPS DPS Abs. Performances(12m,6m,3m,1m): 12 month High/low: EUR4.14 / 2.60 Main shareholders: Harpalus Angel Fdez. Hold EUROPAC 12/12 724 90.1 12.4% 41.1 5.7% 14.3 14.3 63.2 298 0.9 3.3 3.4 4.1% 0.4 0.7 0.7 5.3 11.6 12.0 0.5 8.8% 3.4% 0.17 -51.2% 3.68 0.07 36.3% 12/13 12/14e 12/15e 802 809 817 104 106 109 13.0% 13.1% 13.3% 54.9 56.5 57.7 6.8% 7.0% 7.1% 27.4 24.8 26.6 27.4 24.8 26.6 76.6 74.2 77.4 298 266 240 0.9 0.8 0.7 2.9 2.5 2.2 4.9 5.4 6.0 5.5% 5.8% 6.0% 0.6 0.6 0.6 0.9 0.9 0.8 0.8 0.7 0.7 6.1 5.7 5.3 11.6 10.7 10.0 12.1 13.5 12.5 1.0 1.0 0.9 12.9% 12.9% 11.0% 3.3% 3.3% 3.3% 0.32 0.29 0.31 91.9% -9.7% 7.4% 3.86 4.02 4.20 0.13 0.13 0.13 -3.4% 1.2% -2.7% Avg. Daily nb traded shares:22,226 40.0%; Free float 38.0%; Cartera REA 6.6%; 6.4%; All share prices at 19/05/14. th Profile: Europac is one of the main European producers of containerboard (7 ). The key to activity is the vertical integration, beginning with the selective collection of recovered paper (raw material) to manufacture paper (recycled and kraftliner), to the corrugated board, and ending with packaging or cardboard boxes. This strategy includes all of the group’s added value. The fact the activity is intensive in energy, generating electricity has been incorporated via three cogeneration plants reaching an installed potential of 153MW. Europac has finished all the investments in new capacity, in all the business lines, paper (kraftliner and testliner), cardboard, and co-generation. SWOT Analysis Strengths • Europac draws 35%-45% of turnover from the food industry. • Few groups in Europe produce kraftliner paper Weaknesses • Consumption weakness hits at demand for boxes. • The right mix of kraftliner/testliner • Modest growth in the sector. • Vertical integration delivers greater added value • Impact from new electricity regulation Opportunities • Underrepresented in agriculture, with an enormous market. • Europac will be in the front line of industry concentration Threats • Volatility of prices in main raw materials used, paper and wood. • Kraftliner imports from USA when euro is strong vs. USD. • Paper/cardboard's high recyclability makes it more future friendly than plastic or wood Recommendation: 1Q’14 results were mainly affected by the new electricity regulation. Europac reports energy results according to the draft regulation, not including a positive effect. To minimise the impact, the company has reduced production 37%. Although paper prices have dropped a little in recent weeks, it remains at a reasonable level. Recycled paper fell 2% from highs and raw material also by -5%, thus margins could be maintained throughout the year. We highlight the good performance of recycled paper in France, which continues improving margins due to the controlled costs and efficiency measures implemented, although in Spain the margin has fallen little. Also worth mentioning is the improving cardboard activity in Portugal, where Europac holds a 40% market share. In our view, annual results could be similar to 2013 and the company has the capacity to improve EBITDA progressively. FINANCIAL CALENDAR (Source: Precise) PRICE (SHORT & LONG AVERAGE) • Rise in energy costs Target Price: EUR 4.00 titre 4.5 10/06/14 AGM 4.0 EUROPAC SMALL & MID CAPS SELECTION Analyst(s) 3.5 3.0 2.5 Iñigo Recio Pascual 2.0 1.5 Mar 11 Source : Factset 80 2013 Jun 11 Sep 11 Dec 11 Mar 12 Jun 12 Sep 12 Dec 12 Mar 13 Jun 13 Sep 13 Dec 13 Mar 14 Jun 14 +34 91 436 7814 BEKA Finance [email protected] Belgium SMALL & MID CAPS SELECTION EUR 39.05 Hold EVS EVSB.BR/EVS BB Market capitalisation: EUR 543m Electronic & Electrical Equipment EUR Sales (m) EBITDA (m) EBITDA margin EBIT (m) EBIT margin Net profit (reported) (m) Net profit (adj.) (m) Cash Flow from Ops.bef. chg in NWC (m) Net debt (Cash) (m) Net Debt/Equity Net Debt/EBITDA Interest cover (EBITDA/Fin. interest) ROCE (adj.) ROCE (adj.)/WACC EV / CE EV / Sales EV / EBITDA EV / EBIT P/E (adj.) P/BV OpFCF yield Dividend yield EPS (adj.) EPS (adj.) growth BVPS DPS Abs. Performances(12m,6m,3m,1m): 12 month High/low: EUR55.81 / 39.05 12/12 138 66.6 48.3% 61.2 44.4% 41.7 42.3 47.6 -20.6 -0.3 -0.3 nm 80.1% 8.4 10.9 4.2 8.7 9.4 14.1 8.9 5.5% 5.9% 3.15 32.3% 5.00 2.64 -30.1% 12/13 12/14e 12/15e 129 141 150 52.8 53.6 55.1 40.9% 38.0% 36.8% 48.4 50.1 51.4 37.5% 35.5% 34.4% 32.7 33.7 35.5 33.4 33.8 35.5 36.8 37.3 38.3 -1.7 2.9 -6.5 0.0 0.0 -0.1 0.0 0.1 -0.1 nm 62.6 73.5 43.6% 39.8% 44.4% 4.6 4.2 4.7 8.6 6.3 6.8 5.1 3.9 3.6 12.4 10.2 9.8 13.5 10.9 10.5 19.4 16.1 15.3 9.6 7.5 7.4 2.5% 4.6% 7.8% 5.5% 6.2% 6.3% 2.42 2.43 2.55 -23.1% 0.3% 5.2% 4.89 5.20 5.26 2.16 2.42 2.45 -6.9% -15.4% -14.1% Avg. Daily nb traded shares:49,969 Main shareholders: Free float 92.7%; Founders 6.3%; Treasury shares 1.0%; Profile: EVS assembles and sells solutions mainly for the production of live and near live broadcasts. The origin of its products lies in the Sports markets where EVS has gained significant experience in processing and manipulating (live) video and is clear market leader. Currently, the company aims at expanding this franchise to the News, Media and Entertainment market. SWOT Analysis Strengths • Technological advantage Weaknesses • Concentrated product portfolio • Leader in Sports market • Need to remain technologically superior • New CEO’s experience in ENM • Limited visibility • Entry barriers Opportunities • Transition to new formats Threats • Entrance of new competitors • Increasing investments in Sport broadcasting • Current competitors matching up technology • Increasing penetration of the ENM market • Risk of declining margins • Increasing number of content distributors Recommendation: Though 1Q14 was broadly in line with our estimates (but below consensus), we had to adapt our FY estimates downwards, decreasing our FY14 EPS from EUR 2.63 to EUR 2.43 preliminary. We consider the resulting FY14 P/E of 18 too high to keep buying the shares given the doubts around the profit growth levels in the medium term. Hence, we downgraded the share from Accumulate to Hold and our Target Price from EUR 50.5 to EUR 46.5. All share prices at 19/05/14. Target Price: EUR 46.50 FINANCIAL CALENDAR (Source: Precise) PRICE (SHORT & LONG AVERAGE) titre 60 55 50 45 02/06/14 Dividend Payment 2013 28/05/14 Ex Dividend Date 2013 EVS SMALL & MID CAPS SELECTION Analyst(s) Bart Jooris, CFA +32 2 287 92 79 Bank Degroof [email protected] 40 35 30 Mar 11 Jun 11 Sep 11 Dec 11 Mar 12 Jun 12 Sep 12 Dec 12 Mar 13 Jun 13 Sep 13 Dec 13 Mar 14 Jun 14 Source : Factset 81 Netherlands SMALL & MID CAPS SELECTION EUR 26.36 Hold EXACT HOLDING NV EXAH.AS/EXACT NA Market capitalisation: EUR 627m Software & Computer Services EUR Sales (m) EBITDA (m) EBITDA margin EBIT (m) EBIT margin Net profit (reported) (m) Net profit (adj.) (m) Cash Flow from Ops.bef. chg in NWC (m) Net debt (Cash) (m) Net Debt/Equity Net Debt/EBITDA Interest cover (EBITDA/Fin. interest) ROCE (adj.) ROCE (adj.)/WACC EV / CE EV / Sales EV / EBITDA EV / EBIT P/E (adj.) P/BV OpFCF yield Dividend yield EPS (adj.) EPS (adj.) growth BVPS DPS Abs. Performances(12m,6m,3m,1m): 12 month High/low: EUR28.45 / 15.76 12/12 217 50.7 23.4% 39.2 18.0% 17.4 17.4 43.0 -53.4 -0.5 -1.1 66.1 55.4% 6.7 7.4 1.5 6.3 8.2 21.9 3.9 9.1% 7.8% 0.73 17.1% 4.09 1.26 57.0% 12/13 12/14e 12/15e 213 228 240 47.2 47.4 54.2 22.1% 20.8% 22.5% 37.6 37.0 44.0 17.6% 16.2% 18.3% 31.8 29.8 35.5 31.8 29.8 35.5 41.7 40.7 46.1 -59.6 -68.4 -76.0 -0.6 -0.7 -0.7 -1.3 -1.4 -1.4 nm nm nm 80.8% 75.7% 95.9% 9.7 9.1 11.6 12.7 14.8 15.6 2.3 2.5 2.3 10.6 12.0 10.4 13.3 15.4 12.8 17.6 21.5 18.0 6.1 6.4 6.1 6.0% 5.4% 6.2% 4.4% 4.7% 5.5% 1.34 1.25 1.49 83.0% -6.4% 19.1% 3.88 4.21 4.41 1.18 1.25 1.49 17.4% 2.6% 0.9% Avg. Daily nb traded shares:19,144 Main shareholders: Free float 47.7%; van Nieuwland 15.7%; Hagens 14.9%; Janivo 8.9%; Aviva 7.5%; Delta VPV deelnemingenfonds 5.3%; All share prices at 19/05/14. Profile: Exact Software is an independent software vendor that focuses on ERP software and related applications for the SME and midmarket based on Microsoft technology. The company, which listed in 1999, has some 2,400 employees, subsidiaries in over 40 countries and serves customers in over 125 countries. Its main products are Exact Globe, Exact Synergie and Exact Online. Major competitors include Sage, Deltek and Epicor in the US and Sage, Microsoft Dynamics, Unit4 and Cegid in Europe. SWOT Analysis Strengths • Fast growing Cloud applications Weaknesses • Lack of scale in midmarket • High level of recurring revenues • Split in company between Cloud and ERP • Robust balance sheet (net cash) Opportunities • Grow in Cloud solutions Threats • High levels of competition • Expand internationally • Execution risk international strategy • Re-ignite midmarket segment • Loss of market share Benelux Recommendation: We have recently changed our rating to Hold because of the strong performance of the shares (from EUR 21 to EUR 27). The shares have slipped somewhat, to EUR 26.40, meaning that there is material upside relative to our price target. However, the 1Q14 performance in Business Solutions was not satisfying while the developments in Cloud in the US were also less than encouraging despite very good overall growth (mainly Benelux). This explains why we maintain the Hold rating. FINANCIAL CALENDAR (Source: Precise) PRICE (SHORT & LONG AVERAGE) Target Price: EUR 29.10 t i t re 28 01/08/14 Results 26 24 22 20 16 14 Mar 11 82 24/05/14 AGM 2013 23/05/14 Ex Dividend Date 2013 EXACT HOLDING NV SMALL & MID CAPS SELECTION Analyst(s) Martijn den Drijver 18 Source : Factset 2014H1 Jun 11 Sep 11 Dec 11 Mar 12 Jun 12 Sep 12 Dec 12 Mar 13 Jun 13 Sep 13 Dec 13 Mar 14 Jun 14 +312 0 5508636 SNS Securities [email protected] Italy SMALL & MID CAPS SELECTION EUR 0.81 Hold EXPRIVIA XPR.MI/XPR IM Market capitalisation: EUR 42m Software & Computer Services EUR Sales (m) EBITDA (m) EBITDA margin EBIT (m) EBIT margin Net profit (reported) (m) Net profit (adj.) (m) Cash Flow from Ops.bef. chg in NWC (m) Net debt (Cash) (m) Net Debt/Equity Net Debt/EBITDA Interest cover (EBITDA/Fin. interest) ROCE (adj.) ROCE (adj.)/WACC EV / CE EV / Sales EV / EBITDA EV / EBIT P/E (adj.) P/BV OpFCF yield Dividend yield EPS (adj.) EPS (adj.) growth BVPS DPS Abs. Performances(12m,6m,3m,1m): 12 month High/low: EUR1.00 / .64 12/12 132 12.4 9.4% 7.2 5.5% 2.2 2.2 7.6 44.0 0.6 3.5 4.1 6.0% 0.6 1.0 0.9 9.7 16.6 15.0 0.5 18.7% 5.0% 0.04 -36.6% 1.32 0.03 9.5% 12/13 12/14e 12/15e 131 152 160 13.1 18.8 17.8 10.0% 12.3% 11.1% 8.7 13.7 12.4 6.6% 9.0% 7.8% 2.4 5.4 4.5 2.4 5.4 4.5 7.3 10.9 10.2 37.4 34.0 32.3 0.5 0.4 0.4 2.9 1.8 1.8 4.9 7.5 8.1 7.5% 11.4% 10.2% 0.8 1.2 1.1 1.1 1.0 1.0 1.0 0.8 0.8 9.5 6.5 6.8 14.3 8.9 9.7 17.8 7.7 9.3 0.6 0.5 0.5 16.7% 7.9% 9.1% 0.0% 0.0% 5.0% 0.05 0.10 0.09 12.3% 123.1% -17.0% 1.37 1.47 1.52 0.00 0.00 0.04 -5.3% -17.0% -9.2% Avg. Daily nb traded shares:50,830 Profile: Exprivia is an Italian IT Group, created in 2005 with the merger between the listed Co AISoftware (a developer of innovative technologies in finance, medical imaging, and knowledge management) and Abaco (consulting on relational database and object-oriented SW which later evolved as a system integrator). Since then, Exprivia grew mainly through M&A at a CAGR of 17.4% to a EUR 132m revenues, 10% EBITDA margin in 2012. Based in Molfetta (Bari), Exprivia is now a group employing c 2,000 people, through 10 subsidiaries in Italy and 6 abroad, including Spain, Mexico, Guatemala, Peru, Brazil and China. The international activities accounted for c 11% of the consolidated revenues in FY 2013. Exprivia covers 6 main industries including Finance, Energy & Utilities, Industry & Aerospace, Telco and Media, Healthcare and Public Administrations. Exprivia serves 2,000 clients in the corporate segment, focussing on large and medium enterprises. Most of revenues are generated with consulting and system integration. The location of the company in the Puglia Region offers a competitive advantage with the access to skilled workforce and decent infrastructure at competitive cost, thus enabling a price leadership strategy. FY 2013 results were broadly in line with our expectations; we anticipated that the original 3year plan revenue target (EUR 140m w/o acquisitions) could not be reasonably met. Turnover was stable Y/Y with a positive sign in Q4. EBITDA margin hit again 10% in the full-year; however Q4 profitability was slightly down Y/Y. Net income was in line with our estimates. As expected, the company will not pay any dividend Outlook. EXP said it will update the market with a new industrial plan in the first half of the year. The mgmt will leverage on the international development, which we assume will keep a double-digit increase, and on the consolidation of auSystems (EUR 16m revenues). Following a 4.5% decline in 2013, the domestic market remains challenging. Gartner predicts a small growth in IT services in 2014, due to accelerate in the following 3 years. EXP could grow the Italian business mainly in virtue of new contracts in healthcare and with the finalization of some tasks acquired last year. Profitability should improve thanks to the positive impact of the reorganization of business and legal entities carried out in the past few months. SWOT Analysis Strengths • “Strategic” geographic location Weaknesses • Still unbalanced capital structure. • High quality and differentiated customer portfolio. • Refinancing issues • Price leadership • Working capital dynamics Opportunities • Further domestic expansion through acquisitions and partnership • International Expansion Threats • Longer-than-expected path to macro-economic recovery FINANCIAL CALENDAR (Source: Precise) • Digital Agenda • Continuing price pressure 01/08/14 Results Recommendation: The DCF valuation provides a FV in the range of EUR 0.9/1.0ps (g 1/2%, WACC 9/10%, terminal EBITDA mg 12.5%). EXP trades at double-digit discount to Italian peers on forward EV/EBIT and P/E, in line on EV/EBITDA. We confirm our Hold recommendation and EUR 0.93 target price after Neutral set of results, limited incremental information on the current trading conditions. Main shareholders: Abaco Spa 48.6%; Free float 42.6%; Merula Srl 5.0%; Data Management Spa 2.0%; Own Shares 1.8%; All share prices at 19/05/14. PRICE (SHORT & LONG AVERAGE) • Increasing competition titre 1.00 0.90 0.80 0.70 2014H1 0.60 Target Price: EUR 0.93 0.50 0.40 Mar 11 Source : Factset Jun 11 Sep 11 Dec 11 Mar 12 Jun 12 Sep 12 Dec 12 Mar 13 Jun 13 Sep 13 Dec 13 Mar 14 Jun 14 Analyst(s) Andrea Devita, CFA Banca Akros +39 02 4344 4031 [email protected] 83 Spain SMALL & MID CAPS SELECTION EUR 1.00 Buy EZENTIS EZEN.MC/EZE SM Market capitalisation: EUR 157m Materials, Construction & Infrastructure EUR Sales (m) EBITDA (m) EBITDA margin EBIT (m) EBIT margin Net profit (reported) (m) Net profit (adj.) (m) Cash Flow from Ops.bef. chg in NWC (m) Net debt (Cash) (m) Net Debt/Equity Net Debt/EBITDA Interest cover (EBITDA/Fin. interest) ROCE (adj.) ROCE (adj.)/WACC EV / CE EV / Sales EV / EBITDA EV / EBIT P/E (adj.) P/BV OpFCF yield Dividend yield EPS (adj.) EPS (adj.) growth BVPS DPS Abs. Performances(12m,6m,3m,1m): 12 month High/low: EUR1.87 / .46 12/12 182 12.2 6.7% 9.0 4.9% -19.4 -14.4 2.8 26.8 nm 2.2 1.6 36.5% 2.7 2.6 0.4 5.7 7.8 nm nm -4.3% 0.0% -0.09 +chg -0.06 0.00 79.9% 12/13 12/14e 12/15e 149 244 559 4.4 20.4 50.3 3.0% 8.3% 9.0% -7.4 10.2 35.6 nm 4.2% 6.4% -40.9 4.3 25.2 -8.2 4.3 25.2 -1.0 15.7 43.3 23.5 7.0 4.1 -2.3 0.1 0.0 5.3 0.3 0.1 0.6 5.6 25.4 -21.8% 12.7% 30.3% -1.7 1.1 2.5 7.4 2.4 1.6 1.8 0.7 0.3 61.0 8.2 3.3 nm 16.3 4.6 nm nm 9.3 nm 4.2 2.4 -4.4% 6.4% 21.9% 0.0% 0.0% 0.0% -0.05 0.02 0.11 +chg +chg nm -0.09 0.24 0.42 0.00 0.00 0.00 -33.2% -27.3% -12.4% Avg. Daily nb traded shares:1,722,971 Main shareholders: Free float 72.6%; M. García Durán/Others 22.1%; Merchbank 3.0%; PREMAAT 2.3%; All share prices at 15/05/14. FINANCIAL CALENDAR (Source: Precise) PRICE (SHORT & LONG AVERAGE) Profile: Ezentis is an Industrial Services company focused on engineering, installation and maintenance of telecommunications, energy and water distribution networks. Ezentis’ main clients are Telefónica, Edenor, Endesa, Light and Claro. Close to 90% of the sales proceed from Latin American countries. We estimate Ezentis carrying out new investments of up to EUR83m, which would allow the company to reach an EBITDA similar to that announced (EUR63m vs EUR 66m), thanks to organic growth (CAGR 2014-17 EBITDA +12%) and inorganic EBITDA representing around 52% of the total in 2017 (EUR32m). Regarding net profit, we estimate EUR30m, similar to the company’s forecasts. SWOT Analysis Strengths • High backlog Weaknesses • Exchange rate volatility • Strong relationship with clients (25 years) • Argentina exposure • Sound service quality • High dependance on few clients Opportunities • Heavy infrastructure investment expectedn in Latam Threats • New investments execution risk • New acquistions • High competition • Operational improvements thanks to innovation Recommendation: We re-initiate coverage of Ezentis with a valuation ranging between EUR1.41 – 1.24/share, depending on the final price (EUR1.1 - 0.77/share) at which the capital increase of EUR50m is realised at, as well as the following two for a total of EUR32m (EUR15m + EUR17m) - earmarked for new investments. Ezentis offers the opportunity to benefit from the strong development phase expected in telecommunication and electricity networks in LatAm via a completely restructured company, with a new executive team which has indepth knowledge of the activity and, moreover, excellent relationships with their main clients thanks to the high quality service provided. titre 2.0 Target Price: EUR 1.41 1.8 1.6 1.4 EZENTIS SMALL & MID CAPS SELECTION Analyst(s) 1.2 1.0 0.8 0.6 0.4 Mar 11 Source : Factset 84 Jun 11 Sep 11 Dec 11 Mar 12 Jun 12 Sep 12 Dec 12 Mar 13 Jun 13 Sep 13 Dec 13 Mar 14 Jun 14 Rafael Fernández de Heredia +34 91 436 78 08 BEKA Finance [email protected] Finland SMALL & MID CAPS SELECTION EUR 2.30 Reduce F-SECURE FSC1V.HE/FSC1V FH Market capitalisation: EUR 357m Software & Computer Services EUR Sales (m) EBITDA (m) EBITDA margin EBIT (m) EBIT margin Net profit (reported) (m) Net profit (adj.) (m) Cash Flow from Ops.bef. chg in NWC (m) Net debt (Cash) (m) Net Debt/Equity Net Debt/EBITDA Interest cover (EBITDA/Fin. interest) ROCE (adj.) ROCE (adj.)/WACC EV / CE EV / Sales EV / EBITDA EV / EBIT P/E (adj.) P/BV OpFCF yield Dividend yield EPS (adj.) EPS (adj.) growth BVPS DPS Abs. Performances(12m,6m,3m,1m): 12 month High/low: EUR2.54 / 1.68 12/12 157 33.7 21.4% 20.2 12.8% 14.6 14.6 28.1 -33.3 -0.5 -1.0 67.4 36.6% 4.8 5.1 1.3 6.1 10.3 16.4 3.7 6.1% 3.9% 0.09 -11.1% 0.42 0.06 25.0% 12/13 12/14e 12/15e 155 158 161 38.7 33.0 36.2 24.9% 21.0% 22.6% 27.2 22.5 26.7 17.5% 14.3% 16.6% 16.6 16.0 18.9 16.6 16.0 18.9 28.1 26.5 28.4 -47.9 -55.1 -59.6 -0.7 -0.7 -0.7 -1.2 -1.7 -1.6 55.2 nm nm 58.4% 49.1% 54.6% 7.7 6.5 7.2 7.0 8.9 8.2 1.6 1.9 1.8 6.3 9.1 8.2 8.9 13.4 11.1 17.5 22.3 18.9 4.0 4.5 4.1 7.0% 5.7% 5.8% 2.6% 3.5% 4.3% 0.11 0.10 0.12 13.4% -3.6% 18.2% 0.47 0.51 0.55 0.06 0.08 0.10 17.3% 5.5% 5.5% Avg. Daily nb traded shares:40,629 Main shareholders: Free float 60.0%; Siilasmaa Risto 39.7%; Mutual Pension Insurance Company Ilmarinen 8.6%; Finnish State Pension Fund 5.6%; All share prices at 19/05/14. FINANCIAL CALENDAR (Source: Precise) PRICE (SHORT & LONG AVERAGE) titre 2.8 Profile: F-Secure develops and sells security services to consumers and businesses. It is the world-leading provider of security services through telecom operators. The operator business (~60% of sales) has been the company's growth driver for several years. F-Secure's partner network consists of over 200 operators that serve over 250 million broadband customers in more than 40 countries. The operator business is based on the SaaS model and includes PC and mobile security services as well as several types of storage/sync and share services. The traditional channel (40% of sales) consists of license sales and sales to businesses. SWOT Analysis Strengths • A good sales channel thanks to a unique position as a partner to operators • Able to produce good profits even under difficult macroeconomic conditions • Good cash flow and profitability Opportunities • Increasing need for security in mobile handsets • Better use of market growth potential in the operator channel • Sync&share offering through operators Weaknesses • Weak outlook in pc based security market • Windows XP exit from the market • Growth requires sales and marketing outlays • Pricing pressures due to freely-available products (Windows 8) Threats • Increasing use of freely-available products weakening growth prospects • Fast growth may require more outlays in F-Secure's own distribution channel, resulting in a weak margin • Failure in new growth areas (storage/sync& share services • May clearly improve profitability should the pace of growth slacken Recommendation: F-Secure’s industry is undergoing a major upheaval as the conventional PC-based data security market has become saturated. A sales turnaround is still possible, but it would necessitate successful products in the storage, sync & share services as well as attractive profit distribution model offered to operators. The key in the successful launch of new services is ensuring a rapid rise in the number of subscribers, which calls for aggressive pricing. This, in turn, keeps top-line growth very moderate in the coming quarters. We estimate that the margin is likely to remain around 15%, because accelerating the growth pace requires marketing and R&D investments. Consequently, performance in the coming quarters is subject to considerable uncertainty. 2.6 Target Price: EUR 2.10 2.4 2.2 2.0 F-SECURE SMALL & MID CAPS SELECTION Analyst(s) 1.8 1.6 1.4 1.2 Mar 11 Source : Factset Jun 11 Sep 11 Dec 11 Mar 12 Jun 12 Sep 12 Dec 12 Mar 13 Jun 13 Sep 13 Dec 13 Mar 14 Jun 14 Kimmo Stenvall +358 10 252 4561 Pohjola [email protected] 85 Spain SMALL & MID CAPS SELECTION EUR 2.15 Hold FAES FARMA FAE.MC/FAE SM Market capitalisation: EUR 485m Healthcare EUR Sales (m) EBITDA (m) EBITDA margin EBIT (m) EBIT margin Net profit (reported) (m) Net profit (adj.) (m) Cash Flow from Ops.bef. chg in NWC (m) Net debt (Cash) (m) Net Debt/Equity Net Debt/EBITDA Interest cover (EBITDA/Fin. interest) ROCE (adj.) ROCE (adj.)/WACC EV / CE EV / Sales EV / EBITDA EV / EBIT P/E (adj.) P/BV OpFCF yield Dividend yield EPS (adj.) EPS (adj.) growth BVPS DPS Abs. Performances(12m,6m,3m,1m): 12 month High/low: EUR2.79 / 1.77 12/12 176 31.1 17.6% 21.4 12.1% 19.5 19.5 25.1 49.6 0.3 1.6 14.7 7.6% 0.9 1.6 1.7 9.4 13.7 16.0 1.7 7.3% 1.3% 0.10 37.6% 0.90 0.02 1.2% 12/13 12/14e 12/15e 180 190 203 36.3 41.3 45.2 20.1% 21.8% 22.3% 25.8 31.4 35.0 14.3% 16.5% 17.2% 22.6 24.8 27.3 22.6 24.8 27.3 31.8 36.4 39.0 30.4 12.9 -5.7 0.2 0.1 0.0 0.8 0.3 -0.1 25.0 25.6 29.5 9.6% 11.8% 13.2% 1.1 1.5 1.7 2.8 2.5 2.4 2.8 2.2 2.1 13.7 10.3 9.3 19.3 13.6 12.0 24.7 20.0 18.3 2.8 2.3 2.2 5.0% 6.2% 6.2% 0.0% 1.9% 1.9% 0.10 0.11 0.12 7.9% 4.1% 9.7% 0.90 0.92 1.00 0.00 0.04 0.04 -16.6% -13.4% -3.2% Avg. Daily nb traded shares:110,563 Profile: Faes Farma is an integrated Spanish company that specialises on the investigation, production and marketing of pharmaceutical products (own and third party products) as well as raw materials. Following the acquisition of Ingaso in 2007, the company diversified its activity incorporating an animal nutrition products line (specialised in piglets). Although the international marketing of bilastine (antihistaminic) has contributed to improve its consolidated operating results and to its geographic diversification, the company stilll concentrates much of its activity on the Iberian Peninsula (>70% consolidated net revenues at 2013e), a region affected by the austerity measures implemented in recent years and taking their toll on results. The company counts with has first class partners for its commercialization: Pfizer, Takeda, Merck, Menarini and Tahio among others, covering a total of 48 countries and expects its launch in 78 additional countries. The increasing competition in the anti-histamine market and the regulatory impact has reduced the management’s expected revenues. Considering the healthy financial situation (0.3x ND/EBITDA’13), we expect a corporate move to be announced, reinforcing growth in consolidated revenues. SWOT Analysis Strengths • Alternative partner for international pharmaceuticals Weaknesses • Pharmaceutical portfolio’s exposure to the RPS • New international launches of Bilastine • Dependence on the commercialisation of bilastine • Consistent dividend policy • High concentration in Spain • Lack of short term triggers in its R&D pipeline Opportunities • Operating leverage from new in-license agreements. • International expansion of the health and animal nutrition Threats • Regulatory instability at the national level, due to high public deficit and need to reduce costs • Those inherent to the industry Main shareholders: Free float 98.0%; Management 2.0%; • Internationalisation of bilastine (Japan) All share prices at 19/05/14. Recommendation: We rate Faes hold with a TP of EUR2.1 per share (DCF, wacc 8.7% & g: 1%). We expect the company to announce an acquisition in order to diversify its activity and improve visibility o Target Price: EUR 2.10 PRICE (SHORT & LONG AVERAGE) FINANCIAL CALENDAR titre 2.8 2.6 2.4 2.2 Ana Isabel González García CIIA 2.0 1.8 1.6 1.4 1.2 1.0 Mar 11 Source : Factset 86 FAES FARMA SMALL & MID CAPS SELECTION Analyst(s) Jun 11 Sep 11 Dec 11 Mar 12 Jun 12 Sep 12 Dec 12 Mar 13 Jun 13 Sep 13 Dec 13 Mar 14 Jun 14 +34 91 436 78 09 BEKA Finance [email protected] France SMALL & MID CAPS SELECTION EUR 56.46 Sell FAIVELEY FAIP.PA/LEY FP Market capitalisation: EUR 804m Industrial Engineering EUR Sales (m) EBITDA (m) EBITDA margin EBIT (m) EBIT margin Net profit (reported) (m) Net profit (adj.) (m) Cash Flow from Ops.bef. chg in NWC (m) Net debt (Cash) (m) Net Debt/Equity Net Debt/EBITDA Interest cover (EBITDA/Fin. interest) ROCE (adj.) ROCE (adj.)/WACC EV / CE EV / Sales EV / EBITDA EV / EBIT P/E (adj.) P/BV OpFCF yield Dividend yield EPS (adj.) EPS (adj.) growth BVPS DPS Abs. Performances(12m,6m,3m,1m): 12 month High/low: EUR63.49 / 44.97 03/12 901 122 13.5% 94.7 10.5% 47.4 47.4 69.3 331 0.7 2.7 8.0 6.8% 0.9 1.2 1.3 9.3 11.9 15.4 1.6 6.6% 1.6% 3.38 -35.6% 32.99 0.85 21.2% 03/13 988 136 13.8% 112 11.4% 59.3 59.3 91.5 207 0.4 1.5 10.0 8.7% 1.1 1.1 1.0 7.1 8.6 11.9 1.4 7.3% 1.7% 4.17 23.1% 36.08 0.95 -3.5% 03/14e 03/15e 982 977 129 129 13.2% 13.2% 112 111 11.4% 11.3% 50.5 62.5 50.5 62.5 74.5 86.3 176 109 0.3 0.2 1.4 0.8 14.4 18.4 8.5% 8.5% 1.1 1.0 1.2 1.2 1.1 1.0 8.1 7.8 9.3 9.0 14.8 12.9 1.4 1.3 6.0% 10.1% 1.8% 1.8% 3.55 4.39 -14.8% 23.7% 38.63 42.02 1.00 1.00 -3.9% -1.6% Avg. Daily nb traded shares:4,507 Main shareholders: Faiveley Family 52.6% (67.1%); Free float 44.8% (32.9%); Treasury shares 2.6% (0.0%); Profile: The global rolling stock industry is mainly controlled by three leading manufacturers: Bombardier, Alstom and Siemens. The industry is founded on an assembler business model and a network of subcontractors has been built up, many of which are specialised in niche markets. Faiveley has risen to the number two position worldwide behind German company Knorr-Bremse. With key expertise in airconditioning, brakes, electronics and transmission systems, Faiveley has raised barriers to entry, paving the way for its arrival on the North American rail freight market, which is currently its main driver for growth. Asia-Pacific’s share of Faiveley’s sales is set to rise to almost 20% in 2013 vs. 7% in 1996. This trend is tied to rail investment trends in China and could give the group 2-4pts of annual growth over the next two years, from which the negative contribution of the European markets will have to be deducted. SWOT Analysis STRENGTHS Faiveley operates in a near-global duopoly on each of its niche markets Flexible industrial model which generates cash thanks to the maintenance business and services with high margins Long term, Faiveley will be a true yield stock WEAKNESS Not many big clients Bombardier) or end clients. The industry depends to a significant extent on macroeconomic and political factors. Faiveley’s debt levels will stifle any opportunistic acquisitions of a significant size OPPORTUNITIES Reduction in debt which will give significant room for manœuvre in two to three years’ time THREATS Very promising growth in North America Growth in the rail sector depends to a large extent on Asia For shareholders: take some precautions to protect against the downturn in the railway sector cycle Reduction in investment in Spain, the UK, Germany, France and the US Recommendation: The Chairman has stepped down from his operating functions and the entire top management has been renewed over the past two years. With the consensus still aggressive, and at a time when China is experiencing recurring problems with its railway network, the “sustainable” three-years growth in Faiveley’s most dynamic portion of sales (+20% to +40% y-o-y in Asia) is not yet in the bag. We maintain our Sell recommendation (from Neutral – 30 January 2013). Our opinion is based on our own perception of the global recession in the railway market, and changes in the consensus on the past three years. All share prices at 19/05/14. Target Price: EUR 39.00 FINANCIAL CALENDAR (Source: Precise) PRICE (SHORT & LONG AVERAGE) (Siemens/Alstom/ titre 75 30/05/14 Results 70 65 60 55 50 2014 FAIVELEY SA SMALL & MID CAPS SELECTION Analyst(s) Christian Auzanneau 45 +33 4 78 92 01 85 CM - CIC Securities [email protected] 40 35 30 Mar 11 Jun 11 Sep 11 Dec 11 Mar 12 Jun 12 Sep 12 Dec 12 Mar 13 Jun 13 Sep 13 Dec 13 Mar 14 Jun 14 Source : Factset 87 Italy SMALL & MID CAPS SELECTION EUR 1.25 Buy FALCK RENEWABLES AA4.MI/FKR IM Market capitalisation: EUR 365m Utilities EUR Sales (m) EBITDA (m) EBITDA margin EBIT (m) EBIT margin Net profit (reported) (m) Net profit (adj.) (m) Cash Flow from Ops.bef. chg in NWC (m) Net debt (Cash) (m) Net Debt/Equity Net Debt/EBITDA Interest cover (EBITDA/Fin. interest) ROCE (adj.) ROCE (adj.)/WACC EV / CE EV / Sales EV / EBITDA EV / EBIT P/E (adj.) P/BV OpFCF yield Dividend yield EPS (adj.) EPS (adj.) growth BVPS DPS Abs. Performances(12m,6m,3m,1m): 12 month High/low: EUR1.49 / .79 12/12 277 158 57.0% -21.4 nm -91.7 -91.7 93.3 843 2.5 5.3 3.4 -1.7% -0.2 0.9 4.1 7.1 nm nm 0.8 11.4% 0.0% -0.27 -chg 1.18 0.00 43.5% 12/13 12/14e 12/15e 276 289 317 157 148 161 56.9% 51.3% 50.8% 79.3 74.2 93.0 28.7% 25.7% 29.4% 15.1 3.8 12.8 15.1 3.8 12.8 91.9 86.3 94.9 757 716 644 2.0 1.9 1.6 4.8 4.8 4.0 3.2 3.1 3.6 6.7% 6.6% 8.6% 0.8 0.8 nm 1.0 1.0 1.0 4.1 3.8 3.3 7.3 7.5 6.5 14.4 14.9 11.3 25.0 nm 28.5 1.0 1.0 1.0 16.4% -17.5% 20.1% 2.6% 0.4% 1.2% 0.05 0.01 0.04 +chg -75.1% nm 1.28 1.26 1.30 0.03 0.01 0.02 6.2% -9.5% -10.4% Avg. Daily nb traded shares:943,036 Main shareholders: Falck SpA 60.0%; Free Float 57.1%; Achille Colombo 2.9%; All share prices at 19/05/14. FINANCIAL CALENDAR (Source: Precise) PRICE (SHORT & LONG AVERAGE) titre 1.50 07/08/14 Results 1.40 2014H1 Profile: Falck Renewables operates in the production of energy from renewable sources through wind farms and waste-to-energy, biomass and photovoltaic plants. The specialisation in the renewable energy sector has allowed the company to gain experience and acquire know-how in the operation and maintenance (O&M) of proprietary and third party-owned renewable energy power plants. The company operates in Italy, the UK, France and Spain. SWOT Analysis Strengths • Young asset portfolio and geographical diversification Weaknesses • Exposure to GBP/EUR exchange rate fluctuations • Strong management team • Overhang risk related to Mr. Colombo’ stakes (on a total of roughly 3% share capital)£pv£ • High exposure in terms of revenues to the incentives (i.e. around 50%) • Low free float • No relevant short-term re-financial needs • Sound and visible growth over 2012-2017 (EBITDA CAGR around 3% based on our estimates) Opportunities • Potential positive outcome arising from the Sicilian dispute • Programmable source developments • Service sector developments Threats • Potential negative outcome arising from the Sicilian dispute • Changes in the regulatory frameworks • Additional windfall tax introduction • Development of the partnership with the infrastructure fund Copenhagen Infrastructure I K/S Recommendation: Falck Renewables has recently unveiled its 2013-2017 business plan. The current economic scenario, characterised by the decrease in demand, resulting in pressure on energy prices due to lower consumption, the grid management issues caused by increasing intermittent input, the sovereign debt crisis and the consequent negative outlook on incentives and the banks’ reduced willingness to finance industrial investments, led the company to rethink its business model and growth strategy. More in detail, Falck Renewables has identified in its portfolio the following issues that need to be readdressed: a) excessive focus on wind technology (around 92% of its installed capacity and 81% of its production in 2012); b) high exposure to wind unpredictability; c) the progressive decrease in wind quality of new sites (i.e. lower load factors). All these elements are pushing the company: 1) to increase the programmable source exposures; 2) to focus on technologies where profitability is less dependent on incentives; 3) to reduce out-sourcing services (greenfield development); 4) to progressively decrease debt leverage; 5) to widen the portfolio to get scale effects and direct control on plant performances (O&M). By leveraging on the management’s technical and development expertise acquired in the area of renewable energy, the company’s strategic objective is to continue to develop new initiatives. We reiterate our positive stance on the company. Target Price: EUR 1.90 1.30 1.20 FALCK RENEWABLES SMALL & MID CAPS SELECTION Analyst(s) 1.10 1.00 0.90 0.80 0.70 Mar 11 Source : Factset 88 Jun 11 Sep 11 Dec 11 Mar 12 Jun 12 Sep 12 Dec 12 Mar 13 Jun 13 Sep 13 Dec 13 Mar 14 Jun 14 Dario Michi +39 02 4344 4237 Banca Akros [email protected] Finland SMALL & MID CAPS SELECTION EUR 2.95 Accumulate FINNAIR FIA1S.HE/FIA1S FH Market capitalisation: EUR 378m Airlines EUR Sales (m) EBITDAR (m) EBITDA margin EBIT (m) EBIT margin Net profit (reported) (m) Net profit (adj.) (m) Cash Flow from Ops.bef. chg in NWC (m) Net debt (Cash) (m) Net Debt/Equity Net Debt/EBITDA Interest cover ROCE (adj.) ROCE (adj.)/WACC EV / CE EV / Sales AEV / EBITDAR EV / EBIT P/E (adj.) P/BV OpFCF yield Dividend yield EPS (adj.) EPS (adj.) growth BVPS DPS Abs. Performances(12m,6m,3m,1m): 12 month High/low: EUR3.23 / 2.39 12/12 2,449 252 6.8% 35.5 1.4% 11.8 11.8 143 125 0.2 0.8 13.3 2.8% 0.4 0.3 0.1 1.2 8.6 25.8 0.4 59.8% 4.2% 0.09 +chg 6.14 0.10 11.7% 12/13 12/14e 12/15e 2,400 1,137 1,780 214 239 263 5.4% 13.8% 10.0% 7.9 23.0 54.5 0.3% 2.0% 3.1% 27.0 12.6 24.8 27.0 12.6 24.8 149 147 148 160 35.0 100 0.2 0.1 0.2 1.2 0.2 0.6 nm 18.0 12.5 0.7% 2.3% 4.8% 0.1 0.3 0.7 0.4 0.5 0.5 0.2 0.4 0.3 1.9 1.7 1.8 50.9 17.7 8.7 13.1 29.9 15.2 0.5 0.6 0.6 31.1% 4.1% -13.1% 0.0% 0.0% 1.7% 0.21 0.10 0.19 128.7% -53.3% 96.2% 5.49 4.89 5.10 0.00 0.00 0.05 -0.3% 9.3% 5.4% Avg. Daily nb traded shares:22,584 Main shareholders: Free float 100.0%; Suomen valtio / Valtioneuvoston kanslia 55.8%; Skagen Rahastot 4.6%; Keva 4.5%; All share prices at 19/05/14. Profile: Finnair’s operations cover scheduled passenger traffic and leisure traffic, technical and ground handling operations, catering, travel agencies as well as travel information and reservation services. The company's strategy is to focus on European and Asian traffic: Helsinki's location makes the city optimal for transit traffic. The company's strategic objective is double Asian revenues by 2020 from the 2010 level. Finnair’s competition strategy is to focus on high-quality service, so the company does not directly compete with budget airlines. SWOT Analysis Strengths • Helsinki's location enabling direct flights to Asia provides competitive advantage • Young and cost-efficient fleet Weaknesses • Very capital-intensive cost structure Opportunities • Asia's robust economic development offers growth potential • European-wide sector consolidation Threats • Pricing pressure from budget airlines • Several labour organisations within the company reduce business flexibility • High oil price weighing on profitability • Fairly good financing position for implementing future fleet investments Recommendation: Finnair’s traffic figures have remained fairly good but cargo and leisure flights are suffering from low demand. In addition, the weakening Japanese yen has had a clearly negative impact on sales and earnings numbers during the last 12 months. While some cost savings are already underway, Finnair is currently in talks with the cabin crew over yet tighter savings, which largely define whether the company can rise into the black this year. Finnair has a healthy financial position and the reform of its widebody fleet will begin next year once the first Airbus 350 planes arrive in H2 2015. We think the share’s downside risk on the current price is small, while even remotely positive news from the sector could push the share up. Our target price is EUR 3.30 and our recommendation is Accumulate. FINANCIAL CALENDAR (Source: Precise) PRICE (SHORT & LONG AVERAGE) titre 4.0 Target Price: EUR 3.30 22/05/14 Capital Markets Day 3.5 3.0 FINNAIR SMALL & MID CAPS SELECTION Analyst(s) 2.5 2.0 1.5 Mar 11 Jun 11 Sep 11 Dec 11 Mar 12 Jun 12 Sep 12 Dec 12 Mar 13 Jun 13 Sep 13 Dec 13 Mar 14 Jun 14 Jari Raisanen +358 10 252 4504 Pohjola [email protected] Source : Factset 89 Greece SMALL & MID CAPS SELECTION EUR 4.75 Buy FOURLIS HOLDINGS FRLr.AT/FOYRK GA Market capitalisation: EUR 242m General Retailers EUR Sales (m) EBITDA (m) EBITDA margin EBIT (m) EBIT margin Net profit (reported) (m) Net profit (adj.) (m) Cash Flow from Ops.bef. chg in NWC (m) Net debt (Cash) (m) Net Debt/Equity Net Debt/EBITDA Interest cover (EBITDA/Fin. interest) ROCE (adj.) ROCE (adj.)/WACC EV / CE EV / Sales EV / EBITDA EV / EBIT P/E (adj.) P/BV OpFCF yield Dividend yield EPS (adj.) EPS (adj.) growth BVPS DPS Abs. Performances(12m,6m,3m,1m): 12 month High/low: EUR5.90 / 2.26 12/12 420 20.1 4.8% 2.8 0.7% -11.3 -8.9 4.1 138 0.8 6.9 1.4 0.8% 0.1 0.8 0.5 11.5 82.8 nm 0.6 12.2% 0.0% -0.18 -chg 3.47 0.00 61.6% 12/13 12/14e 12/15e 403 413 434 25.4 27.7 33.0 6.3% 6.7% 7.6% 10.6 13.9 20.4 2.6% 3.4% 4.7% -8.3 0.2 4.9 -7.0 0.2 4.9 7.6 14.0 17.5 129 127 122 0.8 0.7 0.7 5.1 4.6 3.7 1.6 2.0 2.4 3.0% 4.1% 6.0% 0.3 0.5 0.7 1.3 1.4 1.4 0.8 0.9 0.8 13.0 13.0 10.8 31.1 26.0 17.4 nm nm 49.4 1.2 1.4 1.4 5.2% 2.2% 2.1% 0.0% 0.0% 0.0% -0.14 0.00 0.10 +chg +chg nm 3.32 3.38 3.48 0.00 0.00 0.00 38.9% -4.6% -17.7% Avg. Daily nb traded shares:117,642 Main shareholders: Free float 69.3%; Dafni Fourli 20.6%; Mitica 5.1%; Fidelity 5.0%; All share prices at 19/05/14. Profile: Fourlis has evolved from a domestic wholesale group to a retailer with presence in both Greece and abroad. The company operates 7 IKEA franchise stores in Greece (5 stores plus 4 pick-up points), Cyprus (1 store) and Bulgaria (1 store), being the only listed IKEA franchisee. Apart from IKEA, the group also holds the franchise of Intersport, already operating 90 stores in Greece (41), Romania (25), Turkey (17), Bulgaria (4) and Cyprus (3). SWOT Analysis Strengths • Strong brand portfolio (IKEA, Intersport) Weaknesses • Directly affected by consumer spending trends£cr£ • Market leadership in the Greek home furnishing market • Highly dependent from the Greek market • Satisfactory geographical diversification • Overdependence on IKEA and its rollout plans • Good management track record • Unattractive gearng ratios currently Opportunities • Opening of new IKEA stores in Greece and abroad Threats • Further slowdown in consumer spending and pricing pressures from local consumer environment deterioration • Continuation of economic stagnation in Greece • Acceleration of Intersport expansion both in Greece and abroad • Signifincant earnings potential in a 'normalized' economic environment in Greece • Real estate portfolio could be used for liquidity enhancement • Political and macro instability in Turkey Recommendation: We have set our target price at EUR 5.40/share with a ‘Buy’ rating. Fourlis is a highly geared ‘Grecovery’ play given that Greece’s home furnishing market currently accounts for 0.4% of GDP compared to an average 1% in EU countries. In a ‘normalized’ economic environment, Fourlis’s EBITDA is expected to grow by 17% over 2013-2018 reaching EUR 55m (vs. EUR 25m in FY13) driven by a strong rebound in the profitability of Greek operations and the solid performance of its international activities. FINANCIAL CALENDAR (Source: Precise) PRICE (SHORT & LONG AVERAGE) Target Price: EUR 5.40 t i t re 6 27/05/14 Results 5 FOURLIS HOLDINGS SMALL & MID CAPS SELECTION Analyst(s) 4 3 2 1 0 Mar 11 Source : Factset 90 2014Q1 Jun 11 Sep 11 Dec 11 Mar 12 Jun 12 Sep 12 Dec 12 Mar 13 Jun 13 Sep 13 Dec 13 Mar 14 Jun 14 Dimitris Birbos Natalia Svyrou-Svyriadi +30 210 81 73 392 +30 210 81 73 384 Investment Bank of Greece [email protected] [email protected] France SMALL & MID CAPS SELECTION EUR 6.96 Hold GAMELOFT GLFT.PA/GFT FP Market capitalisation: EUR 585m Software & Computer Services EUR Sales (m) EBITDA (m) EBITDA margin EBIT (m) EBIT margin Net profit (reported) (m) Net profit (adj.) (m) Cash Flow from Ops.bef. chg in NWC (m) Net debt (Cash) (m) Net Debt/Equity Net Debt/EBITDA Interest cover (EBITDA/Fin. interest) ROCE (adj.) ROCE (adj.)/WACC EV / CE EV / Sales EV / EBITDA EV / EBIT P/E (adj.) P/BV OpFCF yield Dividend yield EPS (adj.) EPS (adj.) growth BVPS DPS Abs. Performances(12m,6m,3m,1m): 12 month High/low: EUR8.32 / 5.23 12/12 208 31.2 15.0% 14.9 7.1% 9.3 9.3 29.7 -55.6 -0.4 -1.8 nm 23.8% 2.2 6.8 1.9 12.4 26.1 nm 3.4 1.6% 0.0% 0.10 -50.7% 1.56 0.00 25.6% 12/13 12/14e 12/15e 233 267 308 37.2 48.7 57.8 15.9% 18.3% 18.8% 23.6 34.1 42.4 10.1% 12.8% 13.8% 7.5 24.2 30.1 7.5 24.2 30.1 26.7 38.8 45.9 -60.3 -76.9 -94.3 -0.4 -0.5 -0.5 -1.6 -1.6 -1.6 nm nm nm 30.4% 38.0% 40.5% 2.8 3.5 3.7 10.2 7.6 6.4 2.7 1.9 1.6 17.0 10.5 8.6 26.8 15.1 11.7 nm 26.0 20.9 5.1 3.6 3.1 0.3% 2.8% 3.0% 0.0% 0.0% 0.0% 0.08 0.27 0.33 -18.9% nm 24.5% 1.62 1.91 2.27 0.00 0.00 0.00 -15.3% -11.9% -0.6% Avg. Daily nb traded shares:149,508 Main shareholders: Free float 88.0% (78.6%); Guillemot brothers 12.0% (21.4%); All share prices at 19/05/14. Profile: Gameloft is one of the largest players in video games for mobile phones and tablets; the group is offering its downloadable games on all digital platforms (smartphones, tablets, Internet boxes, smart TVs). 2013 revenues: 1) 66% on smartphones and tablets (AppStore, Android Market Place, Amazon, Windows Phone); 2) 32% on feature phones (Java-Brew); 3) 2% for large screens (smart TVs and set top boxes). SWOT Analysis Strengths • Global network (200 carriers, 80 countries) Weaknesses • Size (compared to EA Mobile) • Complete in-house low cost production: 27 studios in 12 countries • Coverage of 350 feature phones in 13 languages and 3,000 smartphones • High quality games (best-ranking in the sector for 4 years) • Unable to produce "hits" (games in global top ten for months) • Difficulties to monetize the games in free-to-play model Opportunities • High level of growth for smartphones and tablets (Apple, Android, WP) • Cannibalisation of hand-held consoles by smartphones and tablets • Low cost smartphone adoption in emerging markets Threats • Toward competition with major publishers through mobile/console convergence Recommendation: The group is experiencing very fast growth (+16% organic in 2013, +19%e in 2014) thanks to its pure play positioning on games for mobile and tablets. The 2013 results confirmed its ability to improve its operating margin, thanks to the stabilisation of the R&D headcount, and despite some forex headwinds at the end of the year. Q1 revenues were reassuring on the group’s strategy to improve the monetization capabilities of its games, which should be confirmed with new game releases in Q2. However, the fall of USD and EM currencies vs EUR could weigh on the margin improvement in 2014. We believe that at 14x EBIT 13e the strong growth and leverage prospects are fairly valued, given the risks. Hold. Target Price: EUR 7.00 FINANCIAL CALENDAR (Source: Precise) PRICE (SHORT & LONG AVERAGE) titre 8.5 8.0 GAMELOFT SMALL & MID CAPS SELECTION Analyst(s) 7.5 7.0 6.5 6.0 5.5 5.0 Eric Ravary 4.5 +33 1 45 96 79 53 CM - CIC Securities [email protected] 4.0 3.5 3.0 Mar 11 Jun 11 Sep 11 Dec 11 Mar 12 Jun 12 Sep 12 Dec 12 Mar 13 Jun 13 Sep 13 Dec 13 Mar 14 Jun 14 Source : Factset 91 Italy SMALL & MID CAPS SELECTION EUR 4.76 Buy GAS PLUS GSP.MI/GSP IM Market capitalisation: EUR 214m Oil & Gas Producers EUR Sales (m) EBITDA (m) EBITDA margin EBIT (m) EBIT margin Net profit (reported) (m) Net profit (adj.) (m) Cash Flow from Ops.bef. chg in NWC (m) Net debt (Cash) (m) Net Debt/Equity Net Debt/EBITDA Interest cover (EBITDA/Fin. interest) ROCE (adj.) ROCE (adj.)/WACC EV / CE EV / Sales EV / EBITDA EV / EBIT P/E (adj.) P/BV OpFCF yield Dividend yield EPS (adj.) EPS (adj.) growth BVPS DPS Abs. Performances(12m,6m,3m,1m): 12 month High/low: EUR5.03 / 4.35 12/12 267 73.1 27.3% 43.4 16.2% 16.4 16.4 45.8 150 0.7 2.1 4.8 7.5% 0.9 0.6 1.4 5.1 8.6 13.6 1.1 10.9% 4.4% 0.36 +chg 4.56 0.22 0.2% 12/13 194 60.5 31.2% 35.3 18.2% 11.8 11.8 36.7 102 0.5 1.7 4.3 6.5% 0.8 0.6 1.6 5.2 9.0 18.1 1.0 41.3% 3.3% 0.26 -28.1% 4.60 0.16 0.2% 12/14e 12/15e 209 216 62.9 67.7 30.0% 31.3% 33.0 33.5 15.8% 15.5% 12.7 15.2 12.7 15.2 42.3 49.1 82.3 73.3 0.4 0.3 1.3 1.1 5.4 8.7 6.1% 6.1% 0.8 0.8 0.5 0.5 1.4 1.3 4.7 4.2 9.0 8.6 16.9 14.0 1.0 1.0 9.5% 6.3% 3.6% 4.3% 0.28 0.34 7.5% 20.2% 4.73 4.90 0.17 0.20 -2.1% -0.3% Avg. Daily nb traded shares:1,598 Main shareholders: Us.Fin. Srl 73.9%; Findim 15.5%; Free Float 7.6%; Own Shares 3.0%; All share prices at 19/05/14. FINANCIAL CALENDAR (Source: Precise) PRICE (SHORT & LONG AVERAGE) titre 8 05/08/14 Results 7 6 5 2014H1 Profile: due to the growth that began after the liberalization process in the Italian energy market in the early 2000, Gas Plus, as integrated operator (it covers the entire chain of natural gas management process), is one of the most important players among the new ones; in particular, it is focused on exploration and production (E&P), on gas supply and sales both to wholesale (S&S) and to the end customer (Retail) and on municipal gas distribution (Network). In each segment, the company has gained a solid know-how and this has given it a strong presence over the market in the last few years. SWOT Analysis Strengths • Vertical integration of the gas activities£pv£ Gas Plus covers the entire natural gas management process • High skills and know-how of the management Weaknesses • Exposure to the fluctuations in gas prices and to the Italian gas market competition • Limited free-float • Stable and predictable cash flows from regulated activities • High degree of competition in the gas distribution tenders • Exposure to the Robin Tax Opportunities • Padana Energia is due to boost production and margins in the coming years in Italy • Further development of international activities Threats • A drop in hydrocarbon prices • Development of the storage business in Italy • Possible delays to the start-up of the ongoing projects (Sinarca and Romania) • The Italian Government has set in the National Strategic Energy Plan an important role for the National gas production£pv£ Recommendation: Gas Plus has recently provided an update on its strategic guidelines: E&P - Gas Plus aims to increase production from nearly 226m cm recorded in 2013 to 410m cm in 2016, through the development of the Italian gas fields: Mezzocolle and Longanesi should be the largest contributors to the expected growth. We estimate 2P reserves at ca. 4.0bn cm as at the end of 2016 (they were roughly 4.9bn cm as at the end of 2013). This estimate doesn’t take into account any new discovery and it is only based on the difference between the current 2P reserves level and the expected production in the coming years; Regulated activities. The Italian Electricity and Gas Authority (AEEG) has recently approved the new regulatory framework for the gas distribution activity. The new allowed return is 6.9% vs. 7.6%. We estimate a sensitivity of around EUR 40/50k of EBITDA for each 10bps change. Captive client sale prices - Gas Delibera. AEEG has recently approved a Delibera to set the rules for the sale price for captive clients in the gas sector. According to our estimates, 2014 selling price should be lower by around 15% vs. 2013 while EBITDA should be down by roughly 40%. In any case, the impact we are factoring in terms of lower EBITDA for the commercial gas divisions is less than EUR 3m in 2014 vs. 2013. Romania. ExxonMobil and OMV Petrom acquired 85% stake in the 15 Midia block deep water late in 2012. The consideration was roughly USD 100m. Gas Plus owns a 15% stake in the block portion and refused the offer for its stake. This means that the company’s interest in the area may be worth at least ca. USD 20m. Target Price: EUR 6.00 4 3 2 Mar 11 Source : Factset Jun 11 Sep 11 Dec 11 Mar 12 Jun 12 Sep 12 Dec 12 Mar 13 Jun 13 Sep 13 Dec 13 Mar 14 Jun 14 GAS PLUS SMALL & MID CAPS SELECTION Analyst(s) Dario Michi 92 • Regulatory risk on the distribution and storage activities +39 02 4344 4237 Banca Akros [email protected] Italy SMALL & MID CAPS SELECTION EUR 2.81 Hold GEOX GEO.MI/GEO IM Market capitalisation: EUR 729m Personal Goods EUR Sales (m) EBITDA (m) EBITDA margin EBIT (m) EBIT margin Net profit (reported) (m) Net profit (adj.) (m) Cash Flow from Ops.bef. chg in NWC (m) Net debt (Cash) (m) Net Debt/Equity Net Debt/EBITDA Interest cover (EBITDA/Fin. interest) ROCE (adj.) ROCE (adj.)/WACC EV / CE EV / Sales EV / EBITDA EV / EBIT P/E (adj.) P/BV OpFCF yield Dividend yield EPS (adj.) EPS (adj.) growth BVPS DPS Abs. Performances(12m,6m,3m,1m): 12 month High/low: EUR3.49 / 1.86 12/12 808 86.0 10.6% 47.0 5.8% 10.0 23.9 51.6 -54.1 -0.1 -0.6 38.2 9.8% 0.8 1.7 0.7 6.5 12.0 23.6 1.4 4.5% 3.2% 0.09 -52.2% 1.56 0.07 28.0% 12/13 12/14e 12/15e 754 792 851 10.7 37.8 61.1 1.4% 4.8% 7.2% -34.6 -3.2 19.1 nm nm 2.2% -29.7 -9.7 10.1 -29.7 -9.7 10.1 15.6 31.3 52.1 28.2 6.5 13.1 0.1 0.0 0.0 2.6 0.2 0.2 2.8 9.4 16.5 -6.9% -0.7% 4.0% -0.6 -0.1 0.3 2.3 2.6 2.5 1.0 1.0 1.0 73.1 21.3 13.3 nm nm 42.6 nm nm nm 1.9 2.1 2.0 -6.6% 2.9% -1.0% 0.0% 0.0% 0.0% -0.11 -0.04 0.04 -chg +chg +chg 1.37 1.33 1.37 0.00 0.00 0.00 38.5% -8.9% -7.7% Avg. Daily nb traded shares:493,317 Main shareholders: Mario Moretti Polegato 71.0%; Free float 26.8%; Columbia Wanger Asset Management 2.2%; All share prices at 19/05/14. FINANCIAL CALENDAR (Source: Precise) PRICE (SHORT & LONG AVERAGE) Profile: Geox is among the Italian leaders in the footwear sector and one of the world leaders in the brown shoes segment. It designs, produces and distributes shoes for around 87% of its total sales and apparel for the remaining 13% (in FY 13). The entire production is outsourced, with fixed costs totalling 20/23% of total sales. The company was founded in 1995 by Mr Moretti Polegato, (Geox’ chairman), an entrepreneur who worked in the wine sector. It was he who launched and patented the system to create the first rubber “breathable” sole for shoes. The second step took place in 1999 with the creation of breathable garments, especially jackets. In 2000, the company started to go international and in 2001 it extended the patented technology for rubber soles to leather soles. In 2004 it was listed on the Milan Stock Exchange. The offer ranges from classical to casual, fashion and, lastly, sports footwear (the launch of shoes especially dedicated for sports took place at the beginning of 2008) in addition to apparel and covers the entire family segment: products specifically for men, women and children, making Geox a real family brand. Mr Moretti Polegato, through his holding Lir, has bought Diadora. Geox posted 32% of total sales in Italy; 44% in Europe (ex Italy), 7% in North America, 17% in the Rest of the World in FY 13. Geox distribution mix was as follows in FY 13: wholesale 43%, DOS 38%, Franchisers 19%. Geox shops totalled 1,299 (o/w 450 DOS) –year end 2013. SWOT Analysis Strengths • Geox is being turned-around Weaknesses • Consumer preferences could weaken/change • Geox’s offer ranges from fashion to classic to sport • “Ex-growth” company • Collections are not trend setters • Late in developing in growing countries (emerging and new emerging markets). • Shift from wholesale to retail£cr£ Opportunities • Management reshuffling Threats • The turnaround could take longer to bear fruits • Flexible production, 100% outsourced • Pressure from competitors • New patented product launches • Geox’s market is fragmented • Supply chain reshaping - Never out of stock project • Pricing policy could reveal inadequate Recommendation: Geox presented its new 2014/2016 business plan in Milan in Geox’s show room on November 15th. The plan was rich in details and in numbers: objectives to reach are clear and were well explained by the new strategic moves and organizational changes. Overall sales CAGR target during the business plan should be in the range of 9%, while EBITDA CAGR should be 62%; this should be reached through a first phase (2013 until H1 14) of product re-focusing (complexity reduction – giveup the kids apparel and total look production i.e.), cost cutting, business securing in the core markets, efficiency improvements and investments and NWC control; and through a second phase (from H2 14) of sustainable growth, development in core markets and profitability improvement, expansion in new markets and web channel maximization. titre Our impression is that the targets proposed by the company are reachable but strongly demanding; however, they are pursued by a very committed management team. Trust in the new management capability to turn the company around, is a pre-requisite to consider Geox as an investment opportunity. 5.5 5.0 4.5 4.0 Target Price: EUR 2.50 3.5 3.0 Analyst(s) 2.5 2.0 1.5 Mar 11 Jun 11 Sep 11 Dec 11 Mar 12 Jun 12 Sep 12 Dec 12 Mar 13 Jun 13 Sep 13 Dec 13 Mar 14 Jun 14 Giada Cabrino, CIIA Banca Akros +39 02 4344 4092 [email protected] Source : Factset 93 Germany SMALL & MID CAPS SELECTION EUR 47.94 Hold GERRESHEIMER AG GXI.DE/GXI GR Market capitalisation: EUR 1505m Healthcare EUR Sales (m) EBITDA (m) EBITDA margin EBIT (m) EBIT margin Net profit (reported) (m) Net profit (adj.) (m) Cash Flow from Ops.bef. chg in NWC (m) Net debt (Cash) (m) Net Debt/Equity Net Debt/EBITDA Interest cover (EBITDA/Fin. interest) ROCE (adj.) ROCE (adj.)/WACC EV / CE EV / Sales EV / EBITDA EV / EBIT P/E (adj.) P/BV OpFCF yield Dividend yield EPS (adj.) EPS (adj.) growth BVPS DPS Abs. Performances(12m,6m,3m,1m): 12 month High/low: EUR53.75 / 41.80 11/12 1,219 231 19.0% 126 10.3% 60.2 80.2 160 377 0.6 1.6 7.1 7.3% 0.9 1.5 1.6 8.4 15.5 15.4 2.3 4.9% 1.6% 2.55 4.5% 17.04 0.65 2.3% 11/13 11/14e 11/15e 1,266 1,327 1,415 241 259 276 19.1% 19.5% 19.5% 133 147 163 10.5% 11.1% 11.5% 62.2 70.1 79.6 96.7 84.0 91.5 165 189 202 435 402 367 0.8 0.6 0.5 1.8 1.6 1.3 7.1 7.2 7.5 6.9% 7.4% 8.0% 0.9 0.9 1.7 1.7 1.6 1.9 1.8 1.6 9.9 9.0 8.4 18.0 15.8 14.2 16.1 17.9 16.4 3.1 2.7 2.5 1.8% 4.0% 4.1% 1.5% 1.5% 1.5% 3.08 2.68 2.91 20.6% -13.1% 8.9% 16.11 17.64 19.48 0.70 0.70 0.73 -0.3% -1.8% 0.9% Avg. Daily nb traded shares:45,652 Profile: Gerresheimer (GXI) has established itself as a global glass and plastic packaging specialist with a strong focus on the pharmaceutical industry (c. 80% of sales). Its glass business holds leading positions in the US and the European market. Additionally, GXI is a European leader in health care plastic packaging solutions (from primary plastic packaging to more sophisticated drug delivery systems such as inhaler, insulin pens, etc.). GXI’s main markets are characterized by high regulatory and technical requirements in combination with the need for cost effective, high volume production. Customers contract long-term supply agreements, and GXI can typically pass on raw material prices increase to customer via price escalation clauses. SWOT Analysis Strengths • Global one-stop shop for pharma packaging Weaknesses • Non-patentable manufacturing process • Leading market positions in Europe and NA in Tubular Glass & Moulded Glass, in Europe in Plastic System, in NA in •LSR Diversified by product portfolio, geography and customers (biggest client <5% of sales) • Capital intense business model (70% CE/Sales) Opportunities • Exposure to growth market (RTF syringes 14% p.a. growth, insulin pens 8% p.a., emerging markets double•digit-growth Underlying rates) market growth, acquisitions and new product launches should ensure high-single-digit sales growth • Increasing sales share of Medical Devices vs. primary pharmaceutical packaging should help margins Threats • Limited pricing power and pricing pressure from competition in emerging countries • Rising labour, energy and raw material costs Main shareholders: Free float 100.0%; • Historically low FCF generation and flat margin development • Political uncertainty in emerging markets • Substitution of glass packaging by plastic packaging All share prices at 19/05/14. Recommendation: We rate Gerresheimer ‘Hold’ with a target price of EUR 45. We believe the positives of the GXI investment case is priced in. The current level of valuation should leave little upside potential. FINANCIAL CALENDAR (Source: Precise) PRICE (SHORT & LONG AVERAGE) titre 55 50 Target Price: EUR 45.00 45 40 GERRESHEIMER AG SMALL & MID CAPS SELECTION Analyst(s) 35 30 25 Mrz 11 Source : Factset 94 Jun 11 Sep 11 Dez 11 Mrz 12 Jun 12 Sep 12 Dez 12 Mrz 13 Jun 13 Sep 13 Dez 13 Mrz 14 Jun 14 Konrad Lieder +49 69 5899 7436 Equinet Bank [email protected] Belgium SMALL & MID CAPS SELECTION EUR 37.31 Hold Gimv GIMV.BR/GIMB BB Market capitalisation: EUR 922m Financial Services PROFIT & LOSS (EURm) Revenues Non Recurrent Items Net Profit (reported) BALANCE SHEET (EURm) Shareholders Equity Minorities equity Net Debt NAV Constituents & Total NAV (EURm) Consumer 2020 Health & Care Smart Industries Sustainable Cities Third Party Funds Other assets Net cash/(debt) position Total Net Asset Value Discount/(Premium) to NAV Listed shareholdings on NAV OTHER ITEMS (EURm) Total Market Cap Debt / Equity Payout Ratio P/BV Dividend Yield (Gross) PER SHARE DATA (EUR) EPS (reported) NAVPS BVPS DPS 2010 30.9 104.2 135.2 2011 36.9 -58.8 -21.9 2012 28.7 4.0 32.7 2013e 1,112.0 20.6 -185.8 1,022.1 10.8 -183.4 1,020.7 8.9 -195.3 177.5 72.0 237.4 113.4 184.0 30.0 197.5 1,011.8 -7.7% 18.0% 219.3 75.5 247.8 143.4 208.5 37.6 57.7 989.8 -6.8% 13.1% SWOT Analysis 905.6 185.8 1,091.4 -9.8% 11.2% 168.7 73.9 238.9 93.7 176.9 93.2 166.0 1,011.3 -12.3% 19.0% 985.0 -16.7% 42.0% 0.9 5.8% 886.5 -17.9% nm 0.9 6.4% 934.3 -19.1% 179.5% 0.9 6.6% 917.8 5.833 47.092 47.980 2.450 -0.946 43.634 44.101 2.450 1.365 42.223 42.593 2.450 Opportunities • Large growth potential in Europe and improving European M&A market • Specific activities or certain countries are approached through specialised funds with experienced partners • Fragmented private equity market offers consolidation possibilities 6.6% 40.033 2.450 Source: Company, Bank Degroof estimates Main shareholders: VPM 27% FINANCIAL CALENDAR (Source: Precise) PRICE (SHORT & LONG AVERAGE) titre 48 46 22/05/14 Results 2014 22/05/14 Results 2014 22/05/14 Analyst Meeting 2014 44 42 Profile: Gimv is an independent investment company that is specialised in private equity (PE) and venture capital (VC), focusing mainly on the European market. The company pursues active participation and an enterprise-driven approach, oriented towards value creation. This way, Gimv helps companies increase turnover and profitability. Over the past decades, Gimv has formed partnerships with top companies, helping them to realise their strategic plans. Today, Gimv continues to invest in small and medium-sized enterprises with an attractive track record, potentially strong growth perspectives and a strong market position. As such, Gimv gives investors the opportunity to participate in non-listed companies. Strengths • Over 3 decades of experience in PE and VC with historical IRR of >11% • Strong net cash position: ample financial means for new acquisitions • Stable dividend policy with optional stock dividend and high dividend yield Weaknesses • Limited visibility on the underlying operations of the private equity portfolio • Cash drag on return. Proceeds from cash have a negative impact on ROE. • Young vintage portfolio, which hampers potential for divestments • Limited international scope: still mainly Belgium and neighbouring countries Threats • Some participations are very exposed to economic cycle in Europe. • Uncertainty about future tax legislation for investment companies in Belgium • Vulnerable to changes in stock market sentiment and impact holding company discount to NAV volatility Recommendation: Gimv boasts a historical IRR of >11% and although past performance is no guide to the future, it underlines management competence. Moreover, Gimv valuates its portfolio conservatively, which results in consistent exits above “opening equity value” (in recent years on average >45% above the valuation at the start of the fin. year in which the asset has been divested). Therefore we are ready to accept a low discount to NAV. Expect investments to outpace divestments in the course of FY14/15 (1-Apr till 31Mar). This will limit the uplift on NAV as long as the macro environment does not show a clear improvement, needed by Gimv’s underlying operating companies to support valuations. We therefore maintain our Hold rating and confirm our EUR 38.5 target price. At a gross dividend yield of 6.5% at unchanged DPS of EUR 2.45, the present stock price level could tempt yield seeking investors, though. Target Price: EUR 38.50 40 38 36 34 32 Mar 11 Source : Factset Jun 11 Sep 11 Dec 11 Mar 12 Jun 12 Sep 12 Dec 12 Mar 13 Jun 13 Sep 13 Dec 13 Mar 14 Jun 14 GIMV SMALL & MID CAPS SELECTION Analyst(s) Hans D'Haese +32 (0) 2 287 9223 Bank Degroof [email protected] 95 Germany SMALL & MID CAPS SELECTION EUR 75.55 Hold GRENKELEASING AG GKLG.DE/GLJ GR Market capitalisation: EUR 1111m Financial Services EUR 12/12 Total Revenue (m) 185 Pre-Provision Profit (PPP) (m) 103 Loan Impairment Charge (m) -43.4 Operating profit (OP) (m) 59.8 Earnings before tax (m) 59.7 Net profit (reported) (m) 42.5 Net profit (adj.) (m) 42.5 Shareholders equity (m) 351 Tier 1 Ratio 0.0% Cost/Income ratio 44.1% ROE (adj.) 12.7% NPL ratio (gross) 9.3% NPL coverage 49.0% LIC/Avg. RWA high P/Pre-Provision Profit per Share 6.7 P/E (adj.) 16.3 P/BV 2.0 P/NAV 2.0 Dividend yield 1.6% PPPPS 7.54 EPS (adj.) 3.10 EPS (adj.) growth 8.2% BVPS 25.65 NAVPS 25.65 DPS 0.80 Abs. Performances(12m,6m,3m,1m): 25.7% 12 month High/low: EUR81.60 / 59.29 Main shareholders: Free float 57.4%; Grenke Family 42.6%; 12/13 12/14e 12/15e 214 242 273 114 132 150 -49.8 -55.0 -60.0 64.7 77.0 89.9 64.3 76.4 89.1 47.0 55.8 65.1 47.0 55.8 65.1 439 483 535 0.0% 0.0% 0.0% 46.5% 45.5% 45.0% 11.9% 12.1% 12.8% 8.2% 7.5% 7.0% 49.0% 49.0% 49.0% high high high 8.6 8.4 7.4 21.1 19.9 17.1 2.3 2.3 2.1 2.3 2.3 2.1 1.3% 1.5% 1.6% 7.86 8.98 10.20 3.23 3.79 4.43 4.1% 17.5% 16.7% 30.19 32.86 36.39 30.19 32.86 36.39 1.00 1.10 1.20 7.9% -0.7% 2.4% Avg. Daily nb traded shares:5,490,000 Profile: Grenkeleasing has become the leading small-ticket IT financing specialist in Germany and Switzerland since its foundation in 1978. Grenkeleasing offers its services with the help of around 7,400 German and 4,500 international non-exclusive sales partners. Currently it is offering its services in more than 20 countries. It has started operations in Brazil, its first overseas country, in 2012. In 2013 66% of Grenke’s total new business (EUR 1.2bn, +16% yoy) was generated in the international offices. With an equity ratio of 17% Grenkeleasing is well capitalized. Its CIR of 47% (2013) is well below the competitors’ level. Last but not least Grenke has broadened its funding base since 2009 with the acquisition of Hesse Newman Bank (now operating under the brand Grenke Bank) and the issuance of corporate bonds. For 2014 we expect strong earnings growth (+19% yoy) due to good interest income growth resulting from the good portfolio growth in recent quarters, which should more than offset the cost growth related to the ongoing international expansion. SWOT Analysis Strengths • Good asset quality Weaknesses • International expansion may trigger another capital increase • Scalable business model • Very good management track record Opportunities • International expansion outside of Europe continues Threats • Euro crisis comes back • Competitive market environment deteriorates again All share prices at 19/05/14. Recommendation: As we do not see any share price triggers and as we see the shares as fairly valued at the current share price level we stick to our Hold recommendation with a target price of EUR 70.00. FINANCIAL CALENDAR (Source: Precise) PRICE (SHORT & LONG AVERAGE) Target Price: EUR 70.00 titre 85 02/07/14 Trading Update 80 2014Q2 75 70 65 GRENKELEASING AG SMALL & MID CAPS SELECTION Analyst(s) 60 55 50 45 40 Philipp Häßler, CFA 35 30 Mar 11 Source : Factset 96 Jun 11 Sep 11 Dec 11 Mar 12 Jun 12 Sep 12 Dec 12 Mar 13 Jun 13 Sep 13 Dec 13 Mar 14 Jun 14 +49 69 58997 414 Equinet Bank [email protected] Greece SMALL & MID CAPS SELECTION EUR 7.60 Buy HELLENIC EXCHANGES EXCr.AT/EXAE GA Market capitalisation: EUR 497m Financial Services EUR Sales (m) EBITDA (m) EBITDA margin EBIT (m) EBIT margin Net profit (reported) (m) Net profit (adj.) (m) Cash Flow from Ops.bef. chg in NWC (m) Net debt (Cash) (m) Net Debt/Equity Net Debt/EBITDA Interest cover (EBITDA/Fin. interest) ROCE (adj.) ROCE (adj.)/WACC EV / CE EV / Sales EV / EBITDA EV / EBIT P/E (adj.) P/BV OpFCF yield Dividend yield EPS (adj.) EPS (adj.) growth BVPS DPS Abs. Performances(12m,6m,3m,1m): 12 month High/low: EUR9.50 / 5.31 12/12 33.0 11.6 35.0% 9.8 29.5% 11.8 11.9 6.5 -114 -0.8 -9.9 nm 18.9% 1.5 4.1 4.9 14.1 16.7 23.9 1.9 1.2% 2.1% 0.18 -39.7% 2.33 0.09 10.3% 12/13 12/14e 12/15e 81.5 56.4 63.1 60.5 35.1 40.9 74.3% 62.2% 64.8% 59.1 33.2 39.0 72.5% 58.9% 61.8% 32.3 29.2 34.0 18.2 29.2 34.0 50.2 31.1 35.9 -163 -133 -122 -0.9 -0.8 -0.8 -2.7 -3.8 -3.0 nm nm nm 126% 79.4% 99.4% 10.1 7.6 9.5 10.1 10.8 12.0 4.3 6.3 5.8 5.8 10.2 9.0 6.0 10.7 9.4 28.7 17.0 14.6 2.9 3.1 3.3 9.9% 5.9% 7.3% 0.0% 2.9% 3.4% 0.28 0.45 0.52 53.1% 60.6% 16.3% 2.77 2.49 2.29 0.00 0.22 0.26 2.4% -1.3% -12.6% Avg. Daily nb traded shares:266,433 Main shareholders: Free float 100.0%; Profile: Hellenic Exchanges (HELEX) is the operator of the Greek cash, derivatives and bond markets. It is also the organisation responsible for the clearing and settlement of the ATHEX transactions and administration of the Dematerialized Securities System. Since 2003, HELEX is a fully privatised group. In 2013, nearly 25% of the group’s sales derived from trading and clearing of transactions in the stock exchange and the derivatives market, while 52% of total revenues resulted from share capital increases and CCH's delisting. The company has a very high operating leverage that results in a rather volatile earnings stream. SWOT Analysis Strengths • Sustainable cash flow stream • Generous dividend policy Weaknesses • Financial performance is highly dependent on market conditions in ATHEX • More expensive pricing structure compared to other bourses • Thin derivatives market • Debt-free balance sheet • Scarcity of new listings Opportunities • Introduction of new products and services Threats • Vulnerable to Greece’s economic outlook • ATHEX demotion to emerging markets by MSCI to support trading activity • Reduced country-specific risks to raise investor appetite for Greek equities • MiFID paved the way for the entry of new competitors • High operating leverage • The potential delisting of any of the key names would harm ATHEX's attractiveness Recommendation: We have set our target price at EUR 10.00/share assigning a ‘Buy’ recommendation on the stock. We remain bullish on Hellenic Exchanges as we view that there is significant room for further improvement in the average daily transaction value (ADT) after the reclassification of ATHEX to emerging markets by MSCI and the positive developments from the macro front that are expected to lead to a strong earnings momentum (26% compound EPS growth over 2013-2018) and a generous dividend policy (>6% dividend yield for 2013-2018). All share prices at 19/05/14. FINANCIAL CALENDAR (Source: Precise) PRICE (SHORT & LONG AVERAGE) t i t re 10 9 30/06/14 AGM 2013 17/06/14 AGM 2013 Target Price: EUR 10.00 8 7 6 5 4 27/05/14 Results 2014Q1 26/05/14 Results 2014Q1 3 2 1 Mar 11 Jun 11 Sep 11 Dec 11 Mar 12 Jun 12 Sep 12 Dec 12 Mar 13 Jun 13 Sep 13 Dec 13 Mar 14 Jun 14 HELLENIC EXCHANGES SMALL & MID CAPS SELECTION Analyst(s) Investment Bank of Greece Dimitris Birbos +30 210 81 73 392 [email protected] Source : Factset 97 Italy SMALL & MID CAPS SELECTION EUR 2.03 Accumulate HERA HRA.MI/HER IM Market capitalisation: EUR 2857m Utilities EUR Sales (m) EBITDA (m) EBITDA margin EBIT (m) EBIT margin Net profit (reported) (m) Net profit (adj.) (m) Cash Flow from Ops.bef. chg in NWC (m) Net debt (Cash) (m) Net Debt/Equity Net Debt/EBITDA Interest cover (EBITDA/Fin. interest) ROCE (adj.) ROCE (adj.)/WACC EV / CE EV / Sales EV / EBITDA EV / EBIT P/E (adj.) P/BV OpFCF yield Dividend yield EPS (adj.) EPS (adj.) growth BVPS DPS Abs. Performances(12m,6m,3m,1m): 12 month High/low: EUR2.17 / 1.36 12/12 4,493 662 14.7% 335 7.5% 112 112 451 2,217 1.2 3.3 4.9 7.8% 1.2 0.8 0.8 5.2 10.2 12.0 0.8 -3.6% 7.4% 0.10 7.1% 1.57 0.09 26.7% 12/13 12/14e 12/15e 4,580 4,370 4,341 831 850 874 18.1% 19.4% 20.1% 416 473 476 9.1% 10.8% 11.0% 165 171 167 165 171 167 941 558 576 2,595 2,719 2,833 1.1 1.2 1.2 3.1 3.2 3.2 5.4 4.4 4.3 8.0% 8.8% 8.6% 1.2 1.3 1.3 0.9 1.0 1.0 1.0 1.2 1.3 5.8 6.4 6.4 11.5 11.5 11.7 14.1 16.8 17.1 1.1 1.3 1.3 4.7% 0.4% 0.8% 4.4% 4.4% 4.4% 0.12 0.12 0.12 16.4% 3.4% -2.0% 1.53 1.56 1.59 0.09 0.09 0.09 27.2% 8.3% -5.4% Avg. Daily nb traded shares:2,002,413 Main shareholders: Free Float 48.2%; Romagna Provinces 21.3%; Bologna Provinces 20.5%; Modena Procinces 13.8%; All share prices at 19/05/14. FINANCIAL CALENDAR (Source: Precise) PRICE (SHORT & LONG AVERAGE) titre 2.2 2.0 1.8 1.6 05/06/14 Dividend Payment 2013 02/06/14 Ex Dividend Date 2013 Profile: HERA is active in a wide range of services, including Gas and Electricity (nowadays, mainly downstream), Waste Management, Integrated Water Management and Other Activities (District Heating, Public Lighting, etc.). In 2013, EBITDA was well diversified and around 60% came from regulated activities, with Energy representing approx. 23% of the total, Networks 47%, Waste 29% and Other Activities 1%. Business diversification represents a natural hedge against profitability drops in some specific sectors and smoothes the effects of seasonal factors in each sector. SWOT Analysis Strengths • Sound, stable and safe growth • Stable customer base (churn rate is very low, approximately 1.5%, in the gas business) • Well proportioned and diversified business mix • Growth in profitability is coupled with a dividend yield of around 7% Opportunities • The sound financial structure is giving the company additional fire power for M&A • The consolidation of local utilities in Italy • The progressive start-up of new plants/projects should boost margins • The Fondo Strategico Italiano entrance in Hera Weaknesses • Upstream capacity in power generation below volumes sold • Procurement of gas concentrated on few suppliers • Uncertainty on the water business, due to the lack of regulatory framework Threats • Changes in the regulatory framework • The possibility that a merger could be closed at unfavourable conditions • A sharp increase in interest rates, which could reduce the appeal of the entire utilities sector Hera has recently unveiled its new business plan covering 2012-2017. The business plan includes AcegasAPS, Energonut, AMGA and AIMAG contributions. The first two companies are already part of the group while AMGA (EBITDA 25m circa) is consolidated since January 2014. AIMAG (EBITDA 44m circa) should be merged in 2014 and thus it should be consolidated since January 2015. 2017 financial targets: revenues of around EUR 5.6bn (EUR 4.6bn in 2013); EBITDA EUR 951m (EUR 831m in 2013); EBIT EUR 500m (EUR 416m) and a net financial position of roughly EUR 2.75bn, nearly 2.9x EBITDA (3.15x in 2013). DPS policy: EUR 0.09 per share granted as a floor (yield around 4.2%). The BP, will leverage on: Service. Further efficiencies as a result of operating activities and improvements in service levels. Business mix. Maintaining a balanced service portfolio between regulated and free market businesses. Sale of energy. Increase in the sale of energy, increasing the number of customers and the use of online channels. Upstream. Updating the position of the group in upstream energy. Network services infrastructures. Development of networks following a smart area/city approach. Waste management. Further development of waste collection and plants with the improvement of infrastructures dedicated to the recovery of materials and energy. Renewables. Further development of energy production (electrical and thermal) from renewable sources especially in relation to the waste/biomass chain. Merger. Exploitation of the options for growth, both organic and through acquisitions, consistent with local area strategies and the core businesses . Target Price: EUR 2.35 1.4 1.2 Analyst(s) 1.0 0.8 Mar 11 Source : Factset 98 Jun 11 Sep 11 Dec 11 Mar 12 Jun 12 Sep 12 Dec 12 Mar 13 Jun 13 Sep 13 Dec 13 Mar 14 Jun 14 Dario Michi Banca Akros +39 02 4344 4237 [email protected] Netherlands SMALL & MID CAPS SELECTION EUR 44.59 Hold HES BEHEER HESA.AS/HES NA Market capitalisation: EUR 404m Industrial Transportation EUR Sales (m) EBITDA (m) EBITDA margin EBIT (m) EBIT margin Net profit (reported) (m) Net profit (adj.) (m) Cash Flow from Ops.bef. chg in NWC (m) Net debt (Cash) (m) Net Debt/Equity Net Debt/EBITDA Interest cover (EBITDA/Fin. interest) ROCE (adj.) ROCE (adj.)/WACC EV / CE EV / Sales EV / EBITDA EV / EBIT P/E (adj.) P/BV OpFCF yield Dividend yield EPS (adj.) EPS (adj.) growth BVPS DPS Abs. Performances(12m,6m,3m,1m): 12 month High/low: EUR50.12 / 37.85 12/12 87.5 23.7 27.1% 15.6 17.8% 25.6 25.6 32.5 50.1 0.4 2.1 10.2 14.5% 1.8 3.4 3.8 14.0 21.3 14.2 3.0 2.7% 1.8% 2.92 5.0% 13.94 0.76 8.9% 12/13 97.1 24.4 25.2% 14.5 14.9% 24.3 24.3 33.9 75.0 0.5 3.1 6.4 8.8% 1.1 1.7 2.6 10.5 17.7 16.8 2.8 5.5% 1.0% 2.68 -8.1% 15.85 0.43 -8.9% 12/14e 12/15e 99.4 109 29.4 33.2 29.6% 30.4% 18.0 19.2 18.1% 17.6% 28.2 30.4 28.2 30.4 32.3 36.8 92.3 144 0.5 0.8 3.1 4.3 5.2 5.2 8.8% 7.3% 1.1 0.9 1.4 1.3 2.7 2.9 9.0 9.5 14.7 16.5 14.1 13.1 2.3 2.1 -4.3% -9.4% 0.0% 3.4% 3.12 3.36 16.2% 7.9% 18.97 20.82 0.00 1.51 -1.2% -0.6% Avg. Daily nb traded shares:0,587 Main shareholders: Free float 30.6%; Westerduin 21.3%; Strating/Gestion 11.9%; PPF 9.9%; Plimsoll 9.5%; Menor Investments 6.5%; Parkland 5.2%; Onderdijk 5.1%; All share prices at 19/05/14. Profile: HES Beheer is a Euronext listed Netherlands based holding company that owns (wholly or via jointventures and minority stakes) companies that provide logistical services in ports. The core activity of the company is stevedoring dry and liquid bulk goods destined for industrial end-users as well as the storage of dry and liquid bulk. End clients are energy companies, steel companies and oil refiners and traders as the most important dry bulk is cokes and coal while the key liquid bulk is oil (in its various, distilled, forms). SWOT Analysis Strengths • Excellent position in market (location) Weaknesses • Not direct control of certain opco's\ • Experienced management team • Convoluted shareholder structure of affiliates • Robust financial position Opportunities • Grow in Liquid bulk market Threats • Product substitution (renewables versus coal) • Expand internationally • Change of production location steel factories to Asia • Increase efficiency existing operations Recommendation: Now that Hestya is formally launching the offer of EUR 45 per share for all outstanding shares of HES, the chance is high that most shareholders will eventually opt to accept this offer. If they do not accept the offer and Hesty obtains over 80% of the shares (58% is already committed), Hestya may opt for a legal merger, leaving them with a stake in a non-listed entity which is not very appealing either. Because of the above, we rate the shares with a rating in line with the offer even though we realize that, with ATIC on board now, the fair value should be a little higher. FINANCIAL CALENDAR (Source: Precise) PRICE (SHORT & LONG AVERAGE) t i t re Target Price: EUR 45.00 50 25/07/14 Results 48 2014H1 46 44 42 28/05/14 Dividend Payment 2013 23/05/14 Ex Dividend Date 2013 21/05/14 AGM 2013 40 38 36 34 32 30 Mar 11 Jun 11 Sep 11 Dec 11 Mar 12 Jun 12 Sep 12 Dec 12 Mar 13 Jun 13 Sep 13 Dec 13 Mar 14 HES BEHEER SMALL & MID CAPS SELECTION Analyst(s) Martijn den Drijver +312 0 5508636 SNS Securities [email protected] Jun 14 Source : Factset 99 Germany SMALL & MID CAPS SELECTION EUR 17.50 Reduce HHLA HHFGn.DE/HHFA GY Market capitalisation: EUR 1226m Industrial Transportation EUR Sales (m) EBITDA (m) EBITDA margin EBIT (m) EBIT margin Net profit (reported) (m) Net profit (adj.) (m) Cash Flow from Ops.bef. chg in NWC (m) Net debt (Cash) (m) Net Debt/Equity Net Debt/EBITDA Interest cover (EBITDA/Fin. interest) ROCE (adj.) ROCE (adj.)/WACC EV / CE EV / Sales EV / EBITDA EV / EBIT P/E (adj.) P/BV OpFCF yield Dividend yield EPS (adj.) EPS (adj.) growth BVPS DPS Abs. Performances(12m,6m,3m,1m): 12 month High/low: EUR20.30 / 16.29 12/12 1,101 290 26.4% 173 15.7% 66.6 66.6 199 189 0.4 0.6 11.7 10.5% 1.2 1.6 1.6 6.2 10.5 18.7 2.3 5.2% 3.6% 0.95 -20.8% 7.69 0.65 -6.3% 12/13 12/14e 12/15e 1,127 1,150 1,188 263 261 277 23.3% 22.7% 23.3% 144 142 155 12.8% 12.3% 13.1% 48.3 49.8 58.5 48.3 49.8 58.5 206 172 187 146 150 141 0.3 0.3 0.2 0.6 0.6 0.5 7.3 7.8 9.4 8.9% 8.6% 9.2% 1.0 1.0 1.1 1.5 1.5 1.5 1.6 1.5 1.5 6.7 6.6 6.3 12.1 12.2 11.2 25.8 24.6 21.0 2.2 2.1 2.0 7.3% 2.3% 3.6% 2.6% 2.6% 2.9% 0.69 0.71 0.83 -27.6% 3.2% 17.3% 8.18 8.44 8.82 0.45 0.45 0.50 -2.6% -10.2% 2.8% Avg. Daily nb traded shares:67,315 Profile: HHLA is one of the leading port logistics companies in the European North Range, i.e. the ports between Hamburg and Le Havre. The geographical focus of its commercial activities is on the Port of Hamburg and its hinterland. The Class A shares listed on the stock exchange belong to the sub-group Port Logistics and only entitle shareholders to participate in the result and net assets of these operations. The sub-group Port Logistics is made up of the Container, Intermodal and Logistics segments. SWOT Analysis Strengths • With a market share of about 20% HHLA is a leading player in the European North Range • Infrastructure investment with growing cash flows Weaknesses • HHLA depends on the framework set by the state regarding the infrastructure (e.g. channel improvement of Elbe River and the hinterland infrastructure •the The company is majority state owned • Unique network between overseas ports and European hinterland • Specialised inland terminals for rail traffic • Limited cost flexibility due to capital-intensive business model • High dependence on Hamburg location Opportunities • HHLA is in a good position to benefit from growth in global trade • Hamburg has distance advantages in the natural catchment area as an easterly hub for transhipments to Europe •Eastern The river Elbe dredging might start in 2014 Threats • Hamburg competes with other ports of the North Range. As there is excess capacity in the market, a price war could be ruledtoout •not Exposure Odessa and Russia • Freight volume concentrates at major international handling sites like these of HHLA in Hamburg • Worsening of the peak load situation at the Hamburg container terminals due to increasing ship sizes • The dredging of the river Elbe might be postponed again Main shareholders: City of Hamburg 68.4%; Free float 31.6%; All share prices at 19/05/14. FINANCIAL CALENDAR (Source: Precise) PRICE (SHORT & LONG AVERAGE) titre 34 32 14/08/14 Results 2014Q2 14/08/14 Results 2014Q2 Recommendation: The reported Q1 2014 results beat our expectations in sales driven by good volume growth of 2.4% (equinet forecast 2.0%) and by very high storage fees. Consequently, EBITDA and EBIT came in slightly better than expected. However, net profit and EPS were burdened by the devaluation of the Ukrainian local currency and came in below expectations. Overall, Q1 2014 was a good quarter and HHLA confirmed the full year guidance. We adjust our forecasts slightly. We maintain our price target of EUR16 per share and reiterate our Reduce recommendation. Target Price: EUR 16.00 30 28 26 24 22 20/06/14 Ex Dividend Date 2013 20/06/14 Dividend Payment 2013 19/06/14 AGM 2013 20 18 16 Mrz 11 Source : Factset 100 Jun 11 Sep 11 Dez 11 Mrz 12 Jun 12 Sep 12 Dez 12 Mrz 13 Jun 13 Sep 13 Dez 13 Mrz 14 Jun 14 HHLA SMALL & MID CAPS SELECTION Analyst(s) Jochen Rothenbacher, CEFA +49 69 58997 415 Equinet Bank [email protected] Finland SMALL & MID CAPS SELECTION EUR 3.48 Hold HKSCAN HKSAV.HE/HKSAV FH Market capitalisation: EUR 188m Food & Beverage EUR Sales (m) EBITDA (m) EBITDA margin EBIT (m) EBIT margin Net profit (reported) (m) Net profit (adj.) (m) Cash Flow from Ops.bef. chg in NWC (m) Net debt (Cash) (m) Net Debt/Equity Net Debt/EBITDA Interest cover (EBITDA/Fin. interest) ROCE (adj.) ROCE (adj.)/WACC EV / CE EV / Sales EV / EBITDA EV / EBIT P/E (adj.) P/BV OpFCF yield Dividend yield EPS (adj.) EPS (adj.) growth BVPS DPS Abs. Performances(12m,6m,3m,1m): 12 month High/low: EUR4.34 / 3.30 12/12 2,503 129 5.1% 43.0 1.7% 16.4 16.4 104 441 1.0 3.4 4.5 4.1% 0.6 0.7 0.2 4.1 12.2 12.0 0.5 21.0% 2.8% 0.30 62.8% 7.85 0.10 -9.4% 12/13 12/14e 12/15e 2,113 2,065 2,112 83.3 52.1 75.9 3.9% 2.5% 3.6% 11.7 1.1 25.4 0.6% 0.1% 1.2% -10.1 77.7 24.7 -10.1 77.7 24.7 62.7 130 76.7 336 54.0 89.0 0.8 0.1 0.2 4.0 1.0 1.2 4.0 nm nm 1.5% 0.2% 5.0% 0.2 0.0 0.7 0.6 0.2 0.2 0.2 0.0 0.0 4.3 1.2 1.3 30.8 56.9 3.8 nm 2.4 7.6 0.5 0.4 0.4 44.5% 153% 13.8% 2.9% 31.6% 5.7% -0.19 1.44 0.46 -chg +chg -68.2% 7.41 8.75 8.11 0.10 1.10 0.20 0.3% -7.9% -10.3% Avg. Daily nb traded shares:65,013 Main shareholders: Free float 52.6%; LSO Osuuskunta 34.9%; Sveriges Djurbönder ek.för 12.5%; Varma Mutual Pension Insurance Co 6.8%; Profile: A supplier of meat and meat products, HKScan makes 46% of its sales in Sweden, 38% in Finland, 11% in Denmark and the rest in the Baltic countries by selling products to customers in the retail, industrial and HoReCa sectors and export markets. SWOT Analysis Strengths • Market leader in Sweden and the Baltic countries • Good poultry business in Finland and the Baltic countries Weaknesses • Weak bargaining power – the Finnish and Swedish retail sectors are the most heavily concentrated in the world • Slaughter overcapacity in Sweden • Strong brands • Two share series, a cooperation of Finnish contract producers holds the voting ones Opportunities • “Normalisation” of profitability after the raw material spike • Ongoing streamlining measures Threats • Further diminishing availability of domestic meat raw material in Sweden • Weakening loyalty to domestic meat products in general • Redirecting the Danish poultry business’ focus from frozen to fresh products • Goodwill impairment • Private label taking more market share Recommendation: The share will be overshadowed by the profit warning risk in the coming quarters. On the other hand, the markedly strengthening balance sheet following the sale of the Sokolów stake will in the future enable generous dividend payments, which in our view will support the share price. All share prices at 19/05/14. Target Price: EUR 4.00 FINANCIAL CALENDAR (Source: Precise) PRICE (SHORT & LONG AVERAGE) titre 6.5 HKSCAN SMALL & MID CAPS SELECTION Analyst(s) 6.0 5.5 5.0 4.5 Niclas Catani 4.0 +358 10 252 8780 Pohjola [email protected] 3.5 3.0 Mar 11 Jun 11 Sep 11 Dec 11 Mar 12 Jun 12 Sep 12 Dec 12 Mar 13 Jun 13 Sep 13 Dec 13 Mar 14 Jun 14 Source : Factset 101 Italy SMALL & MID CAPS SELECTION EUR 1.19 Accumulate IGD IGD.MI/IGD IM Market capitalisation: EUR 413m Real Estate EUR 12/12 118 86 69.6% (32) (48) 0 24 35.85 1,090 1,845 1,359 0.06 0.07 1.82 (55.4%) 2.49 7.3% 8.6% 15.9 14 high 1,090 54.6% 35.1% 12/13 12/14e 12/15e 116 115 119 EBITDA (m) 83 82 87 EBITDA margin 68.1% 68.6% 69.4% Portfolio Result (m) (35) (1) (2) Net Financial Result (47) (48) (50) Net Profit (reported)(m) 0 0 0 Net Profit (adj.)(m) 23 30 33 Funds From Operations 33.84 31.74 35.48 Net Debt (m) 1,086 1,079 1,129 Portfolio Value (m) 1,838 1,851 1,920 Enterprise Value (m) 1,388 1,494 1,544 EPS (adj.) 0.05 0.07 0.16 DPS 0.07 0.04 0.05 IFRS NAVPS 1.77 1.82 1.86 Premium/(discount) (51.2%) (34.7%) (36.2%) EPRA NAVPS 2.45 0.00 0.00 Earnings adj. yield 4.5% 5.9% 13.1% Dividend yield 5.5% 3.6% 4.1% EV/EBITDA 16.7 18.1 17.8 P/E (adj.) 16 17 8 Int. cover(EBITDA/Fin.int) high high high Net debt/(cash) (m) 1,086 1,079 1,129 Net Debt/Total Assets 54.8% 54.1% 54.6% Abs. Performances(12m,6m,3m,1m): 35.3% 8.4% -6.3% 12 month High/low: EUR1.36 / .72 Avg. Daily nb traded shares:837,313 Main shareholders: Free float 44.9%; Coop Adriatica 41.5%; Unicoop Tirreno 13.6%; Gross Rental Income (m) All share prices at 19/05/14. FINANCIAL CALENDAR (Source: Precise) PRICE (SHORT & LONG AVERAGE) titre 2.0 07/08/14 Results 1.8 1.6 1.4 1.2 1.0 0.8 2014H1 Profile: IGD is one of the main players in the retail segment of the Italian real estate market. Founded by Coop Adriatica and Unicoop Tirreno, which are part of Coop group, the market leader in the Italian food retailing sector, IGD business model is mainly focused on the acquisition, leasing and management of shopping centres, hypermarkets and shopping malls in the domestic market, which account for around 90% of total turnover. SWOT Analysis Strengths • IGD’s main shareholders are part of the market leader in the Italian food retailing sector • Hypermarkets and supermarkets are leased under longterm rental agreements Weaknesses • No reversionary potential for hypermarket and supermarkets • Romanian portfolio Opportunities • Property acquisition by marginal players Threats • High loan-to-value • SIIQ law improvements • Increase in interest rates • Third parties’ property contribution into IGD • Weak macroeconomic environment in Italy Recommendation: at the end of 2013 IGD portfolio was worth EUR 1,891.3m (90% Italy,10% Romania). Italian properties account for EUR 1,718m (including plot of lands and assets held for sale) and are primarily located in the north of the country: Hypermarkets are the stable component of IGD’s portfolio. They are leased on a long-term basis to Coop Adriatic and Unicoop Tirreno. The occupancy rate is 100%, with an average yield of 6.63% (market value EUR 544.4m). Shopping malls are the dynamic portion of IGD's portfolio. At the end of 2013, the occupancy rate was 96.2%, with an average yield of 6.52% (market value EUR 971.5m). The Romanian portfolio is worth EUR 170.0m and has a 6.44% yield with an occupancy of 84.5%. IGD NNAV at the end of 2013 was EUR 2.22/sh compared to EUR 2.31/sh at the end of 2012; the company paid a EUR 0.07/sh dividend payable in cash or in new shares. The main concern on IGD is the LTV at 57.4% which is sizeably higher than the industry average; the average cost of debt is 3.94%. At the beginning of May Quantum fund bought 3.15% of the company by IGD itself which sold to the fund all of its treasury shares (10,976,592); the fund bought another 1.8%,6,423,494, from Unicoop Tirreno (the present second largest shareholder of the company). As a consequence Quantum Strategic Partners owns now 17,400,086 shares or 5% of the company. Valuation: we have valued IGD by using a DCF model with a 6.71% WACC (5.0% cost of debt and 8.9% cost of equity) and a 2% perpetual growth. We confirm our target price and our recommendation on the stock. 0.6 0.4 Mar 11 Source : Factset Target Price: EUR 1.40 Jun 11 Sep 11 Dec 11 Mar 12 Jun 12 Sep 12 Dec 12 Mar 13 Jun 13 Sep 13 Dec 13 Mar 14 Jun 14 Analyst(s) Francesco Sala 102 Banca Akros +39 02 4344 4240 [email protected] Italy SMALL & MID CAPS SELECTION EUR 31.45 Hold IMA IMAI.MI/IMA IM Market capitalisation: EUR 1158m Industrial Engineering EUR Sales (m) EBITDA (m) EBITDA margin EBIT (m) EBIT margin Net profit (reported) (m) Net profit (adj.) (m) Cash Flow from Ops.bef. chg in NWC (m) Net debt (Cash) (m) Net Debt/Equity Net Debt/EBITDA Interest cover (EBITDA/Fin. interest) ROCE (adj.) ROCE (adj.)/WACC EV / CE EV / Sales EV / EBITDA EV / EBIT P/E (adj.) P/BV OpFCF yield Dividend yield EPS (adj.) EPS (adj.) growth BVPS DPS Abs. Performances(12m,6m,3m,1m): 12 month High/low: EUR39.22 / 16.20 12/12 734 101 13.8% 75.0 10.2% 56.2 56.2 93.5 131 0.8 1.3 nm 16.1% 1.9 2.1 0.9 6.4 8.6 11.1 3.5 18.9% 6.9% 1.30 69.1% 4.15 1.00 60.5% 12/13 12/14e 12/15e 761 848 886 112 126 133 14.7% 14.9% 15.0% 94.1 99.7 106 12.4% 11.8% 11.9% 57.4 59.9 63.5 62.0 64.7 68.3 92.2 104 109 131 80.5 0.3 0.6 0.3 0.0 1.2 0.6 0.0 nm high high 16.1% 18.4% 20.6% 1.9 2.2 2.8 3.2 3.5 3.4 1.5 1.5 1.3 10.3 9.7 8.7 12.2 12.3 10.9 18.5 20.5 19.3 5.0 4.9 3.9 3.6% 7.1% 8.1% 4.0% 4.0% 4.0% 1.51 1.53 1.63 16.6% 1.6% 6.3% 5.55 6.46 7.98 1.25 1.25 1.25 15.3% -9.8% -12.6% Avg. Daily nb traded shares:129,185 Main shareholders: SO.FI.MA 67.6%; Free float 30.4%; COFIVA 2.0%; All share prices at 19/05/14. FINANCIAL CALENDAR (Source: Precise) PRICE (SHORT & LONG AVERAGE) titre 40 08/08/14 Results 35 30 2014Q2 29/05/14 Dividend Payment 2013 26/05/14 Ex Dividend Date 2013 Profile: IMA is a major producer of packaging and processing machines for the pharmaceutical industry (62% sales) and world leader in the manufacture of automatic machines for packaging of tea bags, foods and others (38% sales). In the pharma sector its machines cover the entire production line of those industries ranging from the solid dose, blistering, filling, cartooning and end of line. IMA operates through 22 production plants in Italy, Germany, UK, USA, India and China. IMA has an extensive sales network comprising 16 branches in Western Europe, USA, Asia, and over 50 agencies covering more than 70 countries. Major strengths of the group are 1) international diversification (92% of turnover realised abroad); 2) low fixed costs base as a result of a high degree of outsourcing (around 80% of mechanical components); 3) product innovation, with continuous introduction on the market of new models. SWOT Analysis Strengths • Market leader in niche sectors Weaknesses • Heavily depending on pharma sector top line growth • Cost flexibility: 80% of COGS subcontracted out • Potential slowdown in the order intake and consequent decrease in the growth expectation for 2014-2015 • Potential difficulties to integrate new acquisitions • High customer loyalty • High barriers to market entry Opportunities • Growth opportunities in the emerging markets (especially in China with last local acquisition) • Interesting synergies with new acquired companies in food packaging sector • Potential acquisitions in both sectors 10 Mar 11 Target Price: EUR 33.50 Analyst(s) 15 Jun 11 Sep 11 Dec 11 Mar 12 Jun 12 Sep 12 Dec 12 Mar 13 Jun 13 Sep 13 Dec 13 Mar 14 Jun 14 • Increase in raw material costs Q1 14 sales increased by +32%: this result was achieved thanks to the positive trend of all group's divisions and to the positive contribution of ILAPAK group, which has been consolidate from August 2013. EBITDA margin improved from 6.2% in Q1 13 to 9.3% in Q1 14: the growth of operating margins was due to higher sold volumes and a better product mix. IMA’s order book at the end of March 2014 was EUR 506.4m, decidedly higher that EUR 446.1m at the end of March 2013 (+13.5%). FY 14 guidance confirmed – the management confirmed that they are confident that the group will meet FY 14 guidance previously announced: sales around EUR 850m and EBITDA around EUR 127m. Based on the foregoing results and indications, we maintain our FY 14 estimates, which are substantially in line with the company’s guidance. Recommendation: we maintain our Hold recommendation and, based on our DCF model (1.8% perpetual growth rates and WACC of 7.4%), we confirm our target price of EUR 33.50 per share. 25 20 Threats • Potential weakness in a global economy Paola Saglietti Banca Akros +39 02 4344 4287 [email protected] Source : Factset 103 Portugal SMALL & MID CAPS SELECTION EUR 1.67 Reduce IMPRESA IMPA.LS/IPR PL Market capitalisation: EUR 281m Media EUR Sales (m) EBITDA (m) EBITDA margin EBIT (m) EBIT margin Net profit (reported) (m) Net profit (adj.) (m) Cash Flow from Ops.bef. chg in NWC (m) Net debt (Cash) (m) Net Debt/Equity Net Debt/EBITDA Interest cover (EBITDA/Fin. interest) ROCE (adj.) ROCE (adj.)/WACC EV / CE EV / Sales EV / EBITDA EV / EBIT P/E (adj.) P/BV OpFCF yield Dividend yield EPS (adj.) EPS (adj.) growth BVPS DPS Abs. Performances(12m,6m,3m,1m): 12 month High/low: EUR1.97 / .60 12/12 229 19.5 8.5% 9.6 4.2% -4.9 -4.9 5.0 219 1.8 11.2 1.4 2.1% 0.2 0.8 1.1 13.0 26.3 nm 0.4 27.7% 0.0% -0.03 +chg 0.71 0.00 174.3% 12/13e 12/14e 12/15e 229 240 251 31.9 39.5 44.1 13.9% 16.5% 17.5% 27.4 34.8 39.2 11.9% 14.5% 15.6% 11.3 17.3 20.6 11.3 17.3 20.6 15.8 21.9 25.3 202 186 167 1.5 1.3 1.0 6.3 4.7 3.8 2.7 3.4 3.9 6.0% 7.6% 8.6% 0.6 0.8 0.9 1.1 1.4 1.3 1.6 1.9 1.7 11.5 11.4 9.7 13.4 12.9 10.9 16.2 16.3 13.6 1.4 1.9 1.7 9.3% 5.4% 6.9% 0.0% 0.0% 0.0% 0.07 0.10 0.12 +chg 52.7% 19.2% 0.78 0.88 1.00 0.00 0.00 0.00 83.8% 12.3% -11.9% Avg. Daily nb traded shares:44,540 Profile: Impresa is a leading media company in Portugal and focuses mainly on two areas: i) Television with SIC, one of the 4 FTA channels (two private and two state owned), as well as a further 5 channels on cable and ii) publishing (newspapers and magazines, with one of the largest portfolios in Portugal). Furthermore, the company develops a multimedia segment focusing on internet contents (sites, tourism and leisure platforms and games digital distribution). Total revenues increased by 8% in 1Q14 to EUR 55.8m and operating costs increased by 4.4%; the EBITDA recorded a 56.2% increase from EUR 3.6m in 1Q13 to EUR 5.6m in 1Q14 and the net profit reached EUR 1.2m, a significant improvement compared with the net loss of EUR 0.9m registered in 1Q13. The increase in revenues was supported by the television segment (+14.1% YoY) while the publishing area contribution dropped 9.5% YoY. Consolidated adverting revenues increased by 2.6%, with Impresa outperforming the market due to the good audience levels, particularly in prime time. As of March Imp returned to the main Portuguese index, the PSI 20. SWOT Analysis Strengths • Diversified portfolio Weaknesses • Dependence on the economic and advertising cycle • Strong position in FTA • High competition in the publishing segment • Leader in “premium time” audiences • High leverage • Good performance in cable TV • There is no dividend payment Opportunities • Improvement in the advertising market Threats • Strong competition • Reinforcement of audience share • Economic environment • Taking advertising and audience from smaller players or players exiting the market • Slower than expected recovery environment Main shareholders: Impreger 50.3%; Free float 33.3%; Madre 4.9%; BPI 3.2%; All share prices at 19/05/14. • Future decision’s about RTP (return to privatization or concession idea) FINANCIAL CALENDAR (Source: Precise) PRICE (SHORT & LONG AVERAGE) titre 2.0 Recommendation: Our recommendation is reduce with a fair-value of EUR 1.35. Target Price: EUR 1.35 1.8 1.6 1.4 1.2 IMPRESA SMALL & MID CAPS SELECTION Analyst(s) 1.0 0.8 0.6 0.4 0.2 mar 11 Source : Factset 104 jun 11 set 11 dez 11 mar 12 jun 12 set 12 dez 12 mar 13 jun 13 set 13 dez 13 mar 14 jun 14 Helena Barbosa +351 21 389 6831 Caixa-Banco de Investimento [email protected] Netherlands SMALL & MID CAPS SELECTION EUR 1.19 Hold IMTECH IMUN.AS/IM NA Market capitalisation: EUR 537m Support Services EUR Sales (m) EBITDA (m) EBITDA margin EBIT (m) EBIT margin Net profit (reported) (m) Net profit (adj.) (m) Cash Flow from Ops.bef. chg in NWC (m) Net debt (Cash) (m) Net Debt/Equity Net Debt/EBITDA Interest cover (EBITDA/Fin. interest) ROCE (adj.) ROCE (adj.)/WACC EV / CE EV / Sales EV / EBITDA EV / EBIT P/E (adj.) P/BV OpFCF yield Dividend yield EPS (adj.) EPS (adj.) growth BVPS DPS Abs. Performances(12m,6m,3m,1m): 12 month High/low: EUR3.71 / 1.19 12/12 5,433 -51.7 nm -159 nm -226 -109 -172 798 1.4 -15.4 nm -6.9% -0.6 0.9 0.3 nm nm nm 1.2 -7.5% 0.0% -1.18 -chg 5.90 0.00 -66.1% 12/13 12/14e 12/15e 4,945 5,057 5,212 -49.2 125 197 nm 2.5% 3.8% -175 64.3 137 nm 1.3% 2.6% -701 -81.0 35.8 -237 -56.0 58.8 -426 59.7 94.3 750 794 745 2.4 3.4 3.3 -15.3 6.4 3.8 nm 0.9 2.1 -8.9% 3.4% 7.5% -0.8 0.3 0.7 1.5 1.0 1.0 0.4 0.3 0.2 nm 10.6 6.5 nm 20.5 9.3 nm nm 9.1 3.2 2.4 2.4 -36.1% 7.9% 16.3% 0.0% 0.0% 0.0% -0.53 -0.12 0.13 +chg +chg +chg 0.68 0.50 0.49 0.00 0.00 0.00 -43.9% -40.8% -20.0% Avg. Daily nb traded shares:16,222,850 Profile: : Imtech is a European technical service provider in the field of electrical engineering, information and communication technology and mechanical engineering. Its activities are distributed over a number of market segments: buildings, industry, maritime, infra and telecom. The company targets top 3 positions in each market segment. Imtech’s ambitious growth strategy has come to a complete stop after irregularities in Poland and Germany surfaced. More operational problems followed. Top management has been replaced. The company has come in financial stress leading to a large rights issue and still not all pain has disappeared. SWOT Analysis Strengths • Leading positions in Benelux, Germany and maritime market • Solution provider instead of capacity provider • Imtech’s business model is strong in most markets Opportunities • Technical services becomes a larger part of total construction values • Energy efficiency is becoming more important • Rebuilding the organization Weaknesses • Business controls were not in order, leading to irregularities in Germany and Poland • Margins are vulnerable for market overcapacity, like is the case in the Benelux currently • Highly project based work which could impact operating margins if pre-calculations are incorrect Threats • Reputational risk • Construction companies increasingly entering the technical services market • Availability of high skilled personnel Main shareholders: Free float 86.5%; ING 5.1%; Bestinver 5.0%; DNB 3.4%; All share prices at 19/05/14. FINANCIAL CALENDAR (Source: Precise) PRICE (SHORT & LONG AVERAGE) Recommendation: Last year’s rights issue has not taken away worries with investors. A new very expensive financial rescue package was agreed with banks earlier this year, but this is also not enough. The ICT division will be divested, which could fetch ~EUR 300m. We expect other measures like new divestments and a new equity issue. This would be at the cost of valuation ratios. As Imtech is already not cheap compared to competition, this does not improve the investment case. Of course there is recovery potential in margins in the longer term, but we believe that these do not outweigh the short term risks. Hold. t i t re 11 10 Target Price: EUR 1.90 9 8 7 6 IMTECH SMALL & MID CAPS SELECTION Analyst(s) 5 4 3 2 1 Mar 11 Source : Factset Jun 11 Sep 11 Dec 11 Mar 12 Jun 12 Sep 12 Dec 12 Mar 13 Jun 13 Sep 13 Dec 13 Mar 14 Jun 14 Edwin de Jong +312 0 5508569 SNS Securities [email protected] 105 Italy SMALL & MID CAPS SELECTION EUR 9.90 Hold INDESIT IND.MI/IND IM Market capitalisation: EUR 1130m Household Goods EUR Sales (m) EBITDA (m) EBITDA margin EBIT (m) EBIT margin Net profit (reported) (m) Net profit (adj.) (m) Cash Flow from Ops.bef. chg in NWC (m) Net debt (Cash) (m) Net Debt/Equity Net Debt/EBITDA Interest cover (EBITDA/Fin. interest) ROCE (adj.) ROCE (adj.)/WACC EV / CE EV / Sales EV / EBITDA EV / EBIT P/E (adj.) P/BV OpFCF yield Dividend yield EPS (adj.) EPS (adj.) growth BVPS DPS Abs. Performances(12m,6m,3m,1m): 12 month High/low: EUR11.26 / 5.28 12/12 2,886 243 8.4% 133 4.6% 62.3 62.3 172 256 0.4 1.1 8.0 7.0% 0.9 1.0 0.3 4.1 7.5 10.6 1.0 6.5% 3.5% 0.55 5.6% 5.57 0.20 55.5% 12/13 12/14e 12/15e 2,671 2,805 2,911 178 223 255 6.7% 8.0% 8.7% 68.1 114 146 2.5% 4.1% 5.0% 3.3 46.2 66.5 3.3 46.2 66.5 114 155 175 325 290 210 0.7 0.6 0.4 1.8 1.3 0.8 3.5 5.9 6.9 4.9% 7.1% 8.8% 0.6 0.9 1.1 1.6 1.6 1.5 0.6 0.6 0.6 9.5 7.7 6.5 24.8 15.1 11.3 nm 24.5 17.0 2.4 2.2 2.0 -1.2% 3.2% 7.1% 0.0% 0.0% 0.0% 0.03 0.40 0.58 -94.9% nm 44.2% 4.07 4.48 5.08 0.00 0.00 0.00 13.8% -1.2% -5.5% Avg. Daily nb traded shares:330,268 Main shareholders: Merloni Family 60.5%; Free float 40.5%; Profile: Indesit is the third largest white goods producer in Europe with around 15.5% market share. This compares with 16.6% and 16.2% for Bosch-Siemens and Electrolux respectively. Today Indesit is market leader in Italy, Russia and the UK with market shares in the 30% region. This is also the result of the acquisition of Stinol (CSI) in 2000 and GDA (Hotpoint - UK) in 2002. Indesit’s profitability has been achieved by creating a common manufacturing platform for each of the product line (washing machines, dishwashers and fridges) and through a focused marketing approach based on only two European brands: Hotpoint (builtin) and Indesit (free standing). SWOT Analysis Strengths • Market leader in key markets like UK, Italy and Russia with shares around 30%£pv£ • Very streamlined brand portfolio Weaknesses • Low market share in the built-in segment, the most profitable segment: 15% vs. 30% of Bosch • Very High product innovation Opportunities • Potential acquisitions to enter in new markets such as Asia for example • Demand recovery Threats • Persistent price pressure • Weak consumer spending and low visibility Recommendation: Indesit reported Q1 2014 sales at EUR 560.1m down -6.6% Y/Y vs. our forecasts of EUR 565.4m. Q1 2014 volumes were down around 4.6%, price/mix was +1.7% (a touch higher than our estimates). Overall Q1 2014 demand in Greater Europe was up 1.9% (in Q4 2013 down -1.2%). Q1 2014 EBITDA reached EUR 38.8 m (-6.1% Y/Y) and was better than our forecast: with implied Q1 2014 EBITDA margin at 6.9% (flat vs. Q1 2013). Q1 2014 EBIT was of EUR 13.5m (-3.0% Y/Y) vs. our estimates of EUR 11.2m: Q1 2014 EBIT margin was at 2.4% some 40bps above our estimates, and 10bps higher than Q1 2013. All share prices at 19/05/14. FINANCIAL CALENDAR (Source: Precise) PRICE (SHORT & LONG AVERAGE) titre 12 11 30/07/14 Results 2014H1 30/07/14 Results 2014H1 10 9 8 Q1 2014 numbers were decent considering the tough scenario and fx in Eastern Europe. Given the recent newsflow on Indesit implying increasing uncertainty on the probability (and timing) of corporate actions, our Target Price is of EUR 10.60 per share and it is based on a Fair Value of around EUR 8.80 per share (DCFbased) to which we apply now a 20% M&A premium for possible corporate actions. 7 Target Price: EUR 10.60 6 5 4 3 2 Mar 11 Source : Factset 106 Jun 11 Sep 11 Dec 11 Mar 12 Jun 12 Sep 12 Dec 12 Mar 13 Jun 13 Sep 13 Dec 13 Mar 14 Jun 14 Analyst(s) Claudio Giacomiello, CFA Banca Akros +39 02 4344 4269 [email protected] France SMALL & MID CAPS SELECTION EUR 31.02 Reduce INTERPARFUMS IPAR.PA/ITP FP Market capitalisation: EUR 689m Personal Goods EUR Sales (m) EBITDA (m) EBITDA margin EBIT (m) EBIT margin Net profit (reported) (m) Net profit (adj.) (m) Cash Flow from Ops.bef. chg in NWC (m) Net debt (Cash) (m) Net Debt/Equity Net Debt/EBITDA Interest cover (EBITDA/Fin. interest) ROCE (adj.) ROCE (adj.)/WACC EV / CE EV / Sales EV / EBITDA EV / EBIT P/E (adj.) P/BV OpFCF yield Dividend yield EPS (adj.) EPS (adj.) growth BVPS DPS Abs. Performances(12m,6m,3m,1m): 12 month High/low: EUR34.50 / 21.15 12/12 445 223 50.0% 213 47.8% 136 137 224 -208 -0.6 -0.9 nm 20.0% 2.1 1.3 0.6 1.1 1.2 3.1 1.2 44.9% 5.1% 6.79 nm 17.06 1.08 42.6% 12/13 350 58.3 16.7% 52.2 14.9% 34.8 34.8 -56.4 -222 -0.6 -3.8 nm 27.9% 2.9 3.9 1.4 8.1 9.1 19.9 2.0 5.4% 1.6% 1.57 -76.9% 16.00 0.49 -0.4% 12/14e 12/15e 301 332 45.1 49.5 14.9% 14.9% 38.1 42.5 12.6% 12.8% 27.1 30.0 27.1 30.0 37.8 36.9 -234 -251 -0.6 -0.6 -5.2 -5.1 nm nm 19.2% 21.1% 2.0 2.2 3.5 3.3 1.5 1.3 10.1 8.9 12.0 10.3 25.4 22.9 1.9 1.8 3.5% 4.0% 1.3% 1.3% 1.22 1.35 -22.2% 10.8% 16.68 17.53 0.39 0.40 -3.1% -4.0% Avg. Daily nb traded shares:5,485 Main shareholders: Inter Parfums Holding 73.2% (84.4%); Free float 26.6% (15.6%); Treasury stock 0.2% (0.0%); Profile: Interparfums designs, manufactures and distributes luxury fragrances, mainly under license (Mont Blanc, Jimmy Choo, Lagerfeld, Repetto), and is a brand owner since 2007 (Lanvin). The company is positioned on a competitive fragrance market and is undeniably a brand with a strong growth story despite the recent loss of the Burberry license, with a flair for renewing its portfolio with long-standing brands and generating outperformance. This lies in the quality of its teams headed by Philippe Bénacin, its operating performance and long-term vision. The growth trajectory is set to continue in 2014 with the launch of a new masculine fragrance by Montblanc and a duo by Lagerfeld. This is a Fabless business model as it is economical in tangible investments, mainly investing in plastic moulds and display stands. The most significant investments are intangible (upfront costs can reach EUR20m). Two concerns: the operating cycle as this is long and costly in WCR, and the overall level of sales and marketing expenditure. A launch requires up to 50% of annual sales being invested in S&M in the first few years. Launches in 2014 are set to weigh on results and bring total advertising spend to more than 20% of the group’s sales. SWOT Analysis Strengths • Asset light business model • Dedicated pure player, expert of the Fragrance business Weaknesses • Small size vs largest retailers >> difficulties to impose innovations • Non-proprietary brands : the Burberry drama • Well diversified portfolio of Licenses • Not present in cosmetics • Low exposure to Forex relatively to peers in the Luxury business Opportunities • Obtain new licenses with low entry costs Threats • Mature and deflationary European market • Emergence of a middle class in new territories • Low culture of Fragrance in Asia • Low entry barriers • Over competition • Prohibitions of certain components All share prices at 19/05/14. FINANCIAL CALENDAR (Source: Precise) PRICE (SHORT & LONG AVERAGE) titre 35 Recommendation: Recent rally on the stock is excessive. Multiples are set to stretch significantly and cash generation to go down. Despite the company’s fundamental quality, we opt for a Reduce recommendation. Target Price: EUR 29.50 30 25 20 15 10 Mar 11 Jun 11 Sep 11 Dec 11 Mar 12 Jun 12 Sep 12 Dec 12 Mar 13 Jun 13 Sep 13 Dec 13 Mar 14 Jun 14 INTERPARFUMS SMALL & MID CAPS SELECTION Analyst(s) CM - CIC Securities Arnaud Cadart [email protected] +33 1 45 96 77 41 Source : Factset 107 Italy SMALL & MID CAPS SELECTION EUR 9.79 Accumulate INTERPUMP ITPG.MI/IP IM Market capitalisation: EUR 1066m Industrial Engineering EUR Sales (m) EBITDA (m) EBITDA margin EBIT (m) EBIT margin Net profit (reported) (m) Net profit (adj.) (m) Cash Flow from Ops.bef. chg in NWC (m) Net debt (Cash) (m) Net Debt/Equity Net Debt/EBITDA Interest cover (EBITDA/Fin. interest) ROCE (adj.) ROCE (adj.)/WACC EV / CE EV / Sales EV / EBITDA EV / EBIT P/E (adj.) P/BV OpFCF yield Dividend yield EPS (adj.) EPS (adj.) growth BVPS DPS Abs. Performances(12m,6m,3m,1m): 12 month High/low: EUR11.23 / 6.39 12/12 527 106 20.1% 84.0 15.9% 52.3 52.3 75.0 74.5 0.2 0.7 13.2 10.1% 1.1 1.3 1.3 6.6 8.4 14.3 1.6 7.3% 2.9% 0.41 12.1% 3.59 0.17 47.1% 12/13 12/14e 12/15e 557 657 682 105 125 133 18.9% 19.0% 19.5% 79.3 96.1 104 14.3% 14.6% 15.3% 43.2 56.0 61.3 43.2 56.0 61.3 69.9 85.5 91.2 88.7 89.2 48.5 0.2 0.2 0.1 0.8 0.7 0.4 12.7 15.1 16.1 8.5% 9.5% 10.3% 1.2 1.3 1.4 1.7 1.8 1.7 1.9 1.8 1.6 9.8 9.3 8.4 13.0 12.0 10.7 26.0 22.5 20.6 2.2 2.3 2.1 3.3% 2.0% 5.5% 1.8% 1.9% 2.0% 0.34 0.43 0.48 -17.3% 29.6% 9.5% 3.92 4.25 4.63 0.18 0.19 0.20 17.5% -1.6% -5.4% Avg. Daily nb traded shares:697,802 Main shareholders: Free Float 63.3%; IPG Holding 26.3%; Harris Associates LP 10.4%; All share prices at 19/05/14. FINANCIAL CALENDAR (Source: Precise) PRICE (SHORT & LONG AVERAGE) titre 11 10 22/05/14 Dividend Payment 2013 19/05/14 Ex Dividend Date 2013 9 8 7 Profile: Interpump Group (IPG) operates in the mechanical component industry. It is present in two different niches: Water jetting sector (51.1% of total sales and 65% of the group’s EBITDA) - the group is the world leader with 50% market share; this division realizes high and very high-pressure pumps and pumping systems that are used in a wide range of industrial sectors for the conveyance of fluids. Hydraulic sector (48.9% of total sales and 35% of the group’s EBITDA) - in this segment IPG is the world leader with more than 50% market share in the power take-offs (devices designed to transmit the engine power of an industrial vehicle to other hydraulic components, and are installed on the vehicles' gearbox) and one of the top producers of the hydraulic cylinders. SWOT Analysis Strengths • Market leader in niche sectors Weaknesses • Few target companies to acquire • Strong geographic differentiation • Potential acquisitions realized at an unfair value (with dilution effects on EPS) • High entry barriers to defend the high profitability Opportunities • External growth through acquisitions in hydraulic sector • Strong growth opportunities in the emerging markets (China, India and Brazil) and in new applications in the water jetting sector Threats • A macroeconomic downturn in the developed markets in general affects the company's overall business • USD exposure Q1 14 results - good improvement in profitability: Q1 14 results confirmed positive sales and profitability trend started in H2 13. Q1 14 sales up by 21.1% at EUR 160.2m and Q1 14 EBITDA grew by 25.9%. the larger order portfolio in the Water Jetting Sector at 31 March 2014 offset the decrease in sales in the first quarter of 2014 (+15%), whereas order portfolio in the Hydraulic Sector increased by 30% on a like-for-like basis and with unchanged exchange rate. Therefore, the current visibility and the good sales performance recorded in April allowed the management to confirm FY 14 guidance announced in February: FY 14 sales guidance of EUR 660m (+/- 10m), FY 14 EBITDA at EUR 126m (+/- 4m) and FY 14 NFP at EUR 100m (+/10m). Growth strategy: two divisions with different growth speeds: the continuous and constant organic growth of the Water Jetting division, which is characterised by very high margins (EBITDA margin around 24-25%), means the group can sustain the opportunities of external growth in the Hydraulic sector, in which the current strong re-organisation plan should allow Interpump to return to the historical profitability shortly (EBITDA margin around 20% vs current 17%). Recommendation: we maintain our positive stance on the stock and, consequently, we confirm our Accumulate recommendation and target price of EUR 11.80 per share (WACC 7.35% and 2.0% perpetual growth rate). Target Price: EUR 11.80 6 5 4 3 Mar 11 Source : Factset Jun 11 Sep 11 Dec 11 Mar 12 Jun 12 Sep 12 Dec 12 Mar 13 Jun 13 Sep 13 Dec 13 Mar 14 Jun 14 INTERPUMP SMALL & MID CAPS SELECTION Analyst(s) Paola Saglietti 108 +39 02 4344 4287 Banca Akros [email protected] Belgium SMALL & MID CAPS SELECTION EUR 22.32 Hold INTERVEST OFFICES & WAREHOUSES PRIF.BR/INTO BB Market capitalisation: EUR 328m Real Estate EUR 12/12 41 36 85.0% (15) (14) 7 24 24.10 300 581 585 1.71 1.76 19.34 4.0% 19.73 8.5% 8.7% 16.2 12 3.2 300 50.4% 15.6% Gross Rental Income (m) EBITDA (m) EBITDA margin Portfolio Result (m) Net Financial Result Net Profit (reported)(m) Net Profit (adj.)(m) Funds From Operations Net Debt (m) Portfolio Value (m) Enterprise Value (m) EPS (adj.) DPS IFRS NAVPS Premium/(discount) EPRA NAVPS Earnings adj. yield Dividend yield EV/EBITDA P/E (adj.) Int. cover(EBITDA/Fin.int) Net debt/(cash) (m) Net Debt/Total Assets 12/13 40 36 86.9% 8 (9) 35 25 25.00 282 581 563 1.74 1.53 19.86 (1.9%) 20.20 7.8% 6.9% 15.8 11 3.2 282 47.9% 14.1% Abs. Performances(12m,6m,3m,1m): 12 month High/low: EUR22.99 / 17.60 Main shareholders: Nieuwe Steen Investments Group 54.0%; Free float 46.0%; 12/14e 12/15e 39 39 35 35 86.4% 86.3% (3) (3) (11) (10) 20 22 23 24 23.27 24.47 280 274 576 571 608 602 1.60 1.67 1.40 1.46 19.40 19.49 15.1% 14.5% 19.39 19.49 7.2% 7.5% 6.3% 6.6% 17.6 17.4 14 13 3.1 3.4 280 274 46.7% 47.4% 8.5% 0.5% Avg. Daily nb traded shares:3,709 Profile: Offices & Warehouses (IO&W) has a real estate portfolio with a fair value of EUR 579.2m, representing a GLA of 596,714 sqm and consisting for 58% of offices and for 42% of logistics real estate. Its 16 office buildings are located in the periphery of Brussels (38%), on the axis Brussels-Antwerp A1/E19 (50%) and in Antwerp (12%). Its 21 logistics sites are located on the axes Antwerp-Malines A1/E19 - A12 (44%) and Antwerp-Liege A13/E313 – E34 – E314 (48%), and in the periphery of Brussels (8%). The portfolio had a high gross yield of 7.3% and, when fully let, 8.5% at 31 December 2013. The spot occupancy rate at 31 March 2014 stood at 85%. IO&W is listed on NYSE Euronext Brussels (under its legal name Intervest Offices) and is included in the EPRA index. Nieuwe Steen Investments is the reference shareholder with a 54% stake. SWOT Analysis Strengths • High gross portfolio yield of 7.3% (excl. Vacancy) Weaknesses • Portfolio vacancy of 15% • 38% share in Belgian logistics, which has an excellent location, high yield, low maintenance costs and high ratio •land/buildings Office portfolio vacancy in Brussels periphery at 11% vs market at 18% • Facility management with turn-key interior design projects offers competitive advantages in the office Opportunities segment • Improving occupancy + attracting tenants through facility management • Expanding the portfolio share of logistics • Some tenant concentration with important renewals coming up • Relative high cyclical sensitivity • Reconversion offices into residential / other • Decreasing occupier demand offices (mobility) • Low free float & liquidity, but active OTC market Threats • Important lease contracts with top tenants expiring in 2015/2016 • Deterioration of Brussels' office market • Lifecycle of offices - a hike in interest rates All share prices at 19/05/14. Recommendation: In the past months, Intervest Offices & Warehouses’ share performed very strong with a year-to-date share price performance of 16.0% and a total return (including the EUR 1.53 dividend) of 23.8%. In the same period, the LT interest rates declined by c. 40bps whereas the market risk premium also declined by c. 50bps. The fair value (DCF) of IO&W currently stands at EUR 24.2 per share. FINANCIAL CALENDAR (Source: Precise) PRICE (SHORT & LONG AVERAGE) titre 24 02/06/14 Dividend Payment 23 22 2013 1Q14 net current profit declined by 6.1% to EUR 5.9m which is consistent with our full year investment scenario where we expect the net current profit to decline by 4.1%. The fair value (DCF) of IO&W currently stands at EUR 24.2 per share. 21 Target Price: EUR 24.00 20 19 18 17 Mar 11 Source : Factset Jun 11 Sep 11 Dec 11 Mar 12 Jun 12 Sep 12 Dec 12 Mar 13 Jun 13 Sep 13 Dec 13 Mar 14 Jun 14 Analyst(s) Dirk Peeters Bank Degroof +32 2 287 97 16 [email protected] 109 Greece SMALL & MID CAPS SELECTION EUR 1.85 Accumulate INTRALOT INLr.AT/INLOT GA Market capitalisation: EUR 294m Hotels, Travel & Tourism EUR Sales (m) EBITDA (m) EBITDA margin EBIT (m) EBIT margin Net profit (reported) (m) Net profit (adj.) (m) Cash Flow from Ops.bef. chg in NWC (m) Net debt (Cash) (m) Net Debt/Equity Net Debt/EBITDA Interest cover (EBITDA/Fin. interest) ROCE (adj.) ROCE (adj.)/WACC EV / CE EV / Sales EV / EBITDA EV / EBIT P/E (adj.) P/BV OpFCF yield Dividend yield EPS (adj.) EPS (adj.) growth BVPS DPS Abs. Performances(12m,6m,3m,1m): 12 month High/low: EUR2.47 / 1.31 12/12 1,374 178 12.9% 80.0 5.8% 6.1 16.5 139 386 1.0 2.2 8.5 9.0% 0.9 1.5 0.7 5.7 12.7 18.4 1.0 3.3% 0.1% 0.10 -30.1% 1.91 0.00 -20.9% 12/13 12/14e 12/15e 1,539 1,621 1,679 195 203 215 12.7% 12.5% 12.8% 100 118 136 6.5% 7.3% 8.1% -4.6 11.6 22.2 -4.6 11.6 22.2 109 129 142 405 373 339 1.2 0.9 0.7 2.1 1.8 1.6 6.0 4.4 5.0 12.0% 13.4% 15.3% 1.3 1.3 1.5 1.7 1.5 1.4 0.7 0.6 0.6 5.5 4.9 4.5 10.6 8.5 7.1 nm 25.3 13.3 1.1 0.9 0.8 7.9% 15.6% 18.9% 0.0% 0.4% 0.8% -0.03 0.07 0.14 -chg +chg 90.9% 1.68 2.17 2.44 0.00 0.01 0.01 -1.1% -13.1% -14.0% Avg. Daily nb traded shares:344,972 Main shareholders: Free float 71.0%; Kokkalis S. 20.0%; Dimitriadis K 9.0%; All share prices at 19/05/14. Profile: Intralot is the leading supplier of integrated gaming systems and services with active presence in more than 30 countries. During 2006-2011, Intralot has developed a balanced portfolio of operations which includes assets in developed markets as well as ‘greenfield’ projects in emerging markets with great upside potential. In the last two years, the management has decided to change its strategy from pure growth through the acquisition of new contracts to investing in jurisdictions already being present, also focusing on the new investment opportunities arisen in the home country. SWOT Analysis Strengths • Strong position in the global gaming industry Weaknesses • Weak cash flow generation • Balanced portfolio of operations with presence in developed and emerging markets • Well-protected from Greece's economic downturn • Exposure to currency and regulatory risks Opportunities • New games in Greece (VLTs, licensing of online games) £cr£ • Further international expansion as the global gaming market expands • Unattractive gearing ratios • International expansion has slowed-down currently on the back of scarce resources Threats • Emerging or developing market status in the countries that Intralot is expanding • Termination or renegotiation of the contracts with OPAP • Lower margins of existing contracts due to increased competition • Failure to renew existing contracts Recommendation: We have set our target price at EUR 2.50/share assigning a ‘Accumulate’ rating on the stock. On our estimates, the stock trades 25x its FY14 net profits and 13x its FY15 net profits, at a premium over its closest peer GTech. In relation to EV/EBITDA, Intralot trades at a discount of 14% compared to GTech. Positive developments in relation to the business opportunities in Greece that can improve the midterm outlook for the group, as well as the continuation of the positive earnings performance of foreign operations in the coming quarters, will support a better valuation going forward. FINANCIAL CALENDAR (Source: Precise) PRICE (SHORT & LONG AVERAGE) t i t re 2.4 Target Price: EUR 2.50 2.2 2.0 1.8 INTRALOT SMALL & MID CAPS SELECTION Analyst(s) 1.6 1.4 1.2 1.0 0.8 0.6 Mar 11 Source : Factset 110 Jun 11 Sep 11 Dec 11 Mar 12 Jun 12 Sep 12 Dec 12 Mar 13 Jun 13 Sep 13 Dec 13 Mar 14 Jun 14 Dimitris Birbos +30 210 81 73 392 Investment Bank of Greece [email protected] Italy SMALL & MID CAPS SELECTION EUR 1.06 Buy IREN IREE.MI/IRE IM Market capitalisation: EUR 1259m Utilities EUR Sales (m) EBITDA (m) EBITDA margin EBIT (m) EBIT margin Net profit (reported) (m) Net profit (adj.) (m) Cash Flow from Ops.bef. chg in NWC (m) Net debt (Cash) (m) Net Debt/Equity Net Debt/EBITDA Interest cover (EBITDA/Fin. interest) ROCE (adj.) ROCE (adj.)/WACC EV / CE EV / Sales EV / EBITDA EV / EBIT P/E (adj.) P/BV OpFCF yield Dividend yield EPS (adj.) EPS (adj.) growth BVPS DPS Abs. Performances(12m,6m,3m,1m): 12 month High/low: EUR1.34 / .77 12/12 4,328 630 14.5% 341 7.9% 153 153 451 2,555 1.3 4.1 6.1 7.7% 1.0 0.8 0.8 5.8 10.8 3.6 0.9 -0.2% 11.3% 0.13 32.2% 0.51 0.05 21.7% 12/13 12/14e 12/15e 3,448 3,433 3,453 646 659 679 18.7% 19.2% 19.7% 313 333 352 9.1% 9.7% 10.2% 80.6 120 126 80.6 120 126 425 458 466 2,525 2,330 2,263 1.3 1.1 1.1 3.9 3.5 3.3 7.2 5.8 5.6 6.5% 7.1% 7.5% 0.8 0.9 0.9 0.9 0.8 0.8 1.2 1.1 1.1 6.4 5.9 5.6 13.2 11.7 10.9 16.3 10.5 10.0 2.5 4.5 8.6 11.3% 14.1% 18.3% 4.9% 5.3% 5.6% 0.07 0.10 0.11 -47.2% 49.2% 5.2% 0.45 0.24 0.12 0.05 0.06 0.06 -1.4% -11.3% -15.5% Avg. Daily nb traded shares:3,398,687 Main shareholders: Finanziaria Sviluppo Utilities (FSU) 33.3%; Free Float 32.4%; Reggio Emilia Council 7.8%; Parma Council 6.1%; All share prices at 19/05/14. FINANCIAL CALENDAR (Source: Precise) PRICE (SHORT & LONG AVERAGE) titre 1.4 1.2 1.0 0.8 0.6 Profile: IREN was set up on 1st July 2010 through the merger of Enia and Iride. IREN operates in the following sectors: electricity, gas, district heating, integrated water service and environment, and it also provides other public utility services (telecommunications, public lighting, traffic light services, facility management). A diversified business model characterized by a good balance of profits between free activities (39%) and regulated activities (61%), which guarantees solidity, development prospects and reduced risk levels. SWOT Analysis Strengths • Solid position in the north-west of Italy Weaknesses • Small and young know-how in waste segment • High degree of vertical integration • Sound future growth (mainly in the upstream) • Historically disappointing on execution-timing of projects (e.g. OLT and Torino Nord) • Strict decision-making processes • LNG presence with the construction of the third Italian LNG terminal Opportunities • The start-up of plants/projects should boost margins in the coming years • The progressive liberalisation of the electricity market in Italy • Chance to consolidate small local entities in the Piedmont and Liguria area • Gioia Tauro LNG terminal • Uncertainty on the water business, after the referenda results Threats • Execution risk or delay in the realisation of current projects£pv£ • A sharp increase in interest rates, which could reduce the appeal of the whole utilities sector • Reductions in electricity prices, particularly in the green certificate tariff, which would reduce expected returns on projects •new Changes in the regulatory framework Recommendation: Iren has recently confirmed its strategic objectives included in the 2012-2015 business plan. The key pillars are: growth in the core business areas and in the reference territories; opportunistic external growth approach; asset disposals e debt reduction; low capex and operative efficiencies. The growth expected is mainly coming from the entry in operation of the main projects: PAI (WTE Parma), Turin North (co-generation plant); from the consolidation of Turbigo and Tusciano plants (ex Edipower) and from the benefits related to the OLT LNG terminal (cheap gas). EBITDA. Iren points to an EBITDA target of EUR 670m in 2015 (it was roughly EUR 650m in 2013), with a CAGR of nearly 3%. The EBITDA breakdown remains almost unchanged in terms of regulated (57%) and not regulated activities (43%). Main keys by division. Generation and district heating: completion of Turin North, saturation of DH networks in Turin and Parma; generation plant optimisation; integration of Turbigo and Tusciano plants; market: consolidation and increase in customer base, taking advantage of the present flexible short/long term conditions; networks: exploitation of the full benefits of the OLT LNG terminal, bid for tenders in reference areas; water: consolidation and development in reference areas by taking into account the new regulatory framework; waste: completion of Parma WTE, new financial partnership with F2I, new TMB (biological treatment) plant construction in Reggio Emilia. Target Price: EUR 1.50 0.4 0.2 Mar 11 Source : Factset Jun 11 Sep 11 Dec 11 Mar 12 Jun 12 Sep 12 Dec 12 Mar 13 Jun 13 Sep 13 Dec 13 Mar 14 Jun 14 Analyst(s) Dario Michi Banca Akros +39 02 4344 4237 [email protected] 111 Italy SMALL & MID CAPS SELECTION EUR 7.40 Hold ITALCEMENTI ITAI.MI/IT IM Market capitalisation: EUR 1640m Materials, Construction & Infrastructure EUR Sales (m) EBITDA (m) EBITDA margin EBIT (m) EBIT margin Net profit (reported) (m) Net profit (adj.) (m) Cash Flow from Ops.bef. chg in NWC (m) Net debt (Cash) (m) Net Debt/Equity Net Debt/EBITDA Interest cover (EBITDA/Fin. interest) ROCE (adj.) ROCE (adj.)/WACC EV / CE EV / Sales EV / EBITDA EV / EBIT P/E (adj.) P/BV OpFCF yield Dividend yield EPS (adj.) EPS (adj.) growth BVPS DPS Abs. Performances(12m,6m,3m,1m): 12 month High/low: EUR9.73 / 4.88 12/12 4,480 615 13.7% -151 nm -396 -396 403 1,998 0.5 3.2 7.3 12/13 4,235 618 14.6% 159 3.8% -165 -165 370 1,939 0.5 3.1 5.0 0.6 0.9 6.5 nm nm 0.4 -6.0% 1.4% -1.40 -chg 10.50 0.06 42.4% 12/14e 4,440 689 15.5% 234 5.3% 24.1 24.1 565 1,986 0.5 2.9 8.0 12/15e 4,687 819 17.5% 359 7.7% 102 102 659 1,922 0.5 2.3 10.1 0.7 0.8 0.8 1.0 1.1 1.0 6.9 7.0 5.8 26.9 20.6 13.3 nm nm 17.8 0.7 0.7 0.7 0.7% 7.0% 10.7% 0.8% 2.1% 2.5% -0.58 0.10 0.42 +chg +chg nm 9.22 10.63 10.89 0.06 0.16 0.19 16.9% -7.3% -17.4% Avg. Daily nb traded shares:183,005 Profile: Italcementi is one of the main European cement maker operating in over 20 countries. In 2013 the group is recorded around 65% of its revenues and 40% of its EBITDA in mature countries (essentially Western Europe and the USA), with the remainder being booked in developing countries such as Egypt, Morocco and India. “150 project”- the company announced a major reorganisation process at the beginning of March; the reorganisation includes: Bid on Ciments Francais – the company will launch a public tender offer on Ciments Francais minorities at a price of EUR 78/sh (cum dividend). The offer is aimed at delisting Ciments Francais. The offer is expected to be completed at the beginning of July. Conversion of ITC sav – the company approved a mandatory conversion of Italcementi saving shares based on a conversion ratio of EUR 0.65 ordinary shares for each saving shares. EUR 450m capital increase – the company announced a EUR 450m. This sum is basically equal to the cost of the bid on Ciments Francais 2014 outlook –the company said it expected the on-going rationalization of overheads and structural costs should generate a small improvement in EBIT compared with 2013. Lafarge/Holcim merger effects - the management said that the company was not going to invest sizeably in the potential disposal plan of the two companies SWOT Analysis Strengths • Good geographic diversification • Strong presence in developing countries Weaknesses • Mature countries' cement consumption still weak (particularly in Italy) • Italian market still fragmented Opportunities • A recovery in volumes in Italy in 2014 Threats • The Italian market could take much time to recover • Recovery in the Egyptian market • The Egyptian market could be negatively affected by the uncertain political situation Main shareholders: Italmobiliare 60.3%; Free float 37.5%; First eagle 2.2%; All share prices at 19/05/14. FINANCIAL CALENDAR (Source: Precise) PRICE (SHORT & LONG AVERAGE) titre 10 30/07/14 Results 9 8 7 6 2014H1 05/06/14 Dividend Payment 2013 05/06/14 Dividend Payment 2013 02/06/14 Ex Dividend Date 2013 02/06/14 Ex Dividend Date 2013 5 4 3 Mar 11 Source : Factset 112 Jun 11 Sep 11 Dec 11 Mar 12 Jun 12 Sep 12 Dec 12 Mar 13 Jun 13 Sep 13 Dec 13 Mar 14 Jun 14 Recommendation: we do not believe a sizeable improvement in the Italian market could be achieved before 2015 since volumes are still down y/y in the first months of 2014. We confirm our rating and target on the stock. Target Price: EUR 8.80 ITALCEMENTI SMALL & MID CAPS SELECTION Analyst(s) Francesco Sala +39 02 4344 4240 Banca Akros [email protected] Germany SMALL & MID CAPS SELECTION EUR 12.39 Buy JENOPTIK JENG.DE/JEN GR Market capitalisation: EUR 709m Electronic & Electrical Equipment EUR Sales (m) EBITDA (m) EBITDA margin EBIT (m) EBIT margin Net profit (reported) (m) Net profit (adj.) (m) Cash Flow from Ops.bef. chg in NWC (m) Net debt (Cash) (m) Net Debt/Equity Net Debt/EBITDA Interest cover (EBITDA/Fin. interest) ROCE (adj.) ROCE (adj.)/WACC EV / CE EV / Sales EV / EBITDA EV / EBIT P/E (adj.) P/BV OpFCF yield Dividend yield EPS (adj.) EPS (adj.) growth BVPS DPS Abs. Performances(12m,6m,3m,1m): 12 month High/low: EUR13.84 / 8.82 12/12 585 77.7 13.3% 54.8 9.4% 50.2 50.2 75.6 73.8 0.2 1.0 8.9 13.4% 1.8 1.1 0.8 6.3 8.9 9.3 1.3 7.0% 2.4% 0.80 36.2% 5.77 0.18 35.8% 12/13 12/14e 12/15e 600 651 713 74.8 83.5 95.0 12.5% 12.8% 13.3% 52.7 61.8 72.5 8.8% 9.5% 10.2% 47.2 49.5 59.6 47.2 49.5 59.6 49.5 71.2 82.0 43.3 44.7 31.1 0.1 0.1 0.1 0.6 0.5 0.3 13.6 14.8 19.7 11.9% 11.2% 12.2% 1.6 1.5 1.6 1.7 1.5 1.4 1.2 1.1 1.0 9.9 8.9 7.7 14.0 12.0 10.1 15.9 14.3 11.9 1.9 1.8 1.6 4.5% 1.4% 3.6% 1.6% 1.7% 1.9% 0.78 0.86 1.04 -2.6% 11.5% 20.4% 6.41 7.07 7.91 0.20 0.20 0.23 -2.6% -1.7% 4.8% Avg. Daily nb traded shares:76,092 Profile: Jenoptik AG is engaged in the manufacture of laser solutions, optical systems. It operates three segments. The Lasers & Optical Systems segment comprises the activities relating to high power diode lasers, laser systems and laser machines and optical systems, high-precision optics and opto-mechanical systems based on glass or polymers in which the company holds leading positions. The Metrology segment focuses in technologies for measuring forms, dimensions, surfaces, speeds and distances. The Defense and Civil Systems segment focuses on the areas of military and civil vehicle, rail and aircraft equipment, drive and stabilization technology as well as energy systems. SWOT Analysis Strengths • Market leading player in high-end niche markets Weaknesses • Defence business with relatively low margins • Strong R&D network • Solid equity ratio • High complexity of the comapny, large number of products • More than 60% of revenues still in Europe • Massive tax loss carry forwards • Significant working capital ratio above 30% Opportunities • Structural growth of the Photonics market Threats • Cyclicality of the semit and industrial sectors • Strengthening of international distribution • Defence project delays • Offering of systems comes more into focus • Technolog adoption, timing and change risks • Improvements of after-market revenues • R&D costs may rise structurally over time Main shareholders: 0 0.0%; Free float 75.0%; ECE 14.0%; bm-t 11.0%; All share prices at 19/05/14. FINANCIAL CALENDAR (Source: Precise) PRICE (SHORT & LONG AVERAGE) Recommendation: We have recently initiated the coverage of Jenoptik AG with a ‘Buy’ rating and a PT of EUR 15 based on a blend of Sum-of-the-parts and DCF valuation. Jenoptik holds leading positions in attractive high-tech niche markets and should benefit largely from underlying megatrends in the Photonics industry in which the company generates 70% of revenues, we reckon. A strong balance sheet and good chances for over-proportionate earnings growth should render the investment attractive. titre 15 14 13 12 11 13/06/14 Ex Dividend Date 2013 13/06/14 Dividend Payment 2013 Target Price: EUR 15.00 10 9 8 7 6 5 4 Mrz 11 Source : Factset Jun 11 Sep 11 Dez 11 Mrz 12 Jun 12 Sep 12 Dez 12 Mrz 13 Jun 13 Sep 13 Dez 13 Mrz 14 Jun 14 JENOPTIK SMALL & MID CAPS SELECTION Analyst(s) Adrian Pehl, CFA +49 69 58997 438 Equinet Bank [email protected] 113 Germany SMALL & MID CAPS SELECTION EUR 12.80 Buy Joyou Ag JY8G DE/JY8 GR Market capitalisation: EUR 307m Materials, Construction & Infrastructure EUR Sales (m) EBITDA (m) EBITDA margin EBIT (m) EBIT margin Net profit (reported) (m) Net profit (adj.) (m) Cash Flow from Ops.bef. chg in NWC (m) Net debt (Cash) (m) Net Debt/Equity Net Debt/EBITDA Interest cover (EBITDA/Fin. interest) ROCE (adj.) ROCE (adj.)/WACC EV / CE EV / Sales EV / EBITDA EV / EBIT P/E (adj.) P/BV OpFCF yield Dividend yield EPS (adj.) EPS (adj.) growth BVPS DPS Abs. Performances(12m,6m,3m,1m): 12 month High/low: EUR15.20 / 10.06 12/12 330 49.8 15.1% 45.3 13.7% 38.5 39.7 33.1 3.8 0.0 0.1 39.1 11.2% 1.2 0.7 0.7 4.5 5.0 5.6 0.7 -5.4% 0.0% 1.66 3.0% 14.23 0.00 8.1% 12/13 358 57.0 15.9% 50.8 14.2% 39.7 33.2 32.4 0.8 0.0 0.0 5.0 11.7% 1.2 0.9 0.9 5.4 6.1 9.2 0.9 2.8% 0.0% 1.39 -16.2% 15.03 0.00 -6.4% 12/14e 12/15e 386 417 61.8 67.0 16.0% 16.0% 53.2 57.3 13.8% 13.7% 24.0 36.5 36.5 40.7 46.4 51.8 22.8 18.1 0.1 0.0 0.4 0.3 7.4 8.4 10.4% 10.2% 1.1 1.1 0.9 0.8 0.9 0.8 5.3 4.9 6.2 5.7 8.4 7.5 0.8 0.7 -7.2% 1.6% 0.0% 2.0% 1.52 1.70 9.8% 11.4% 16.55 18.25 0.00 0.25 -6.8% 2.2% Avg. Daily nb traded shares:0,750 Main shareholders: Grohe (Lixil) 72.3%; Free float 27.7%; All share prices at 19/05/14. FINANCIAL CALENDAR (Source: Precise) PRICE (SHORT & LONG AVERAGE) Profile: Joyou is a Chinese small cap listed in the Prime Standard of the German Frankfurt stock exchange. Its operations and headquarter are based in China. Counting c. 3,400 employees the company achieved EUR 358m in sales in 2013, thereof EUR 298m from China and EUR 32m from international markets. Joyou designs, produces and sells faucets and other sanitary ware products. The main product groups sold are own brand bathroom faucets (36% of group sales in FY 2013), shower products (18%), kitchen products (12%), ceramic and bathtubs (11%), and more commodity like other faucets, sanitary hardware and semifinished products (11% of sales). SWOT Analysis Strengths • Strong market position in China with largest retail store network (>4200 stores) for bathroom solution products • Solid balance sheet with c. 70% equity ratio and almost zero net financial debt • Modern, low cost production sites in China Weaknesses • Freefloat Mcap at only EUR 85m. Low liquidity of the shares. • China Country Risk (despite the company now having a Japanese majority shareholder) • FCF should remain negative FCF as Joyou should continue to investment into growth. No dividend Opportunities • High-single digit market growth driven by urbanization, income and household growth in China • Growth in international market supported by the strategic cooperation with majority shareholder (>72%) Grohe/Lixil • Special situation – Potential takeover offer by Majority shareholder Lixil (>72%) Threats • Lixil may not file a profit transfer and domination agreement • Share price discount for foreign listed Chinese small caps may remain high or even increase • Concerns over potential Chinese real estate bubble Recommendation: We rate Joyou ‘Buy’ with a target price of EUR 21.9. On November 6, Lixil (>72% shareholder) published a voluntary takeover offer for Joyou at EUR 12.16 per share. Management rejected the offer as it was too low. Whereas downside should be very limited by the strategic buyer Lixil and the sound underlying fundamentals (we derive a standalone DCF based value of EUR 18 per share), we see a good chance for offer / compensation to minority shareholders at a substantial premium to the current share price. 1/ Industry logic of the Grohe acquisition also applies to Joyou, 2/ Lixil paid 11.8x EV/EBITDA for Grohe implying EUR 27.9 per share for Joyou, 3/ Just months before Lixil acquired Grohe, Joyou management transferred its 36.5% stake in Joyou for 12.5% in Grohe implying EUR 25.9 per share. titre 16 15/08/14 Results 15 Target Price: EUR 21.90 2014Q2 14 18/06/14 AGM 13 12 10 9 8 7 Mrz 11 Source : Factset 114 2013 Analyst(s) Konrad Lieder 11 Jun 11 Sep 11 Dez 11 Mrz 12 Jun 12 Sep 12 Dez 12 Mrz 13 Jun 13 Sep 13 Dez 13 Mrz 14 Jun 14 Equinet Bank +49 69 5899 7436 [email protected] Belgium SMALL & MID CAPS SELECTION EUR 24.33 Reduce KBC ANCORA KBCA.BR/KBCA BB Market capitalisation: EUR 1905m Financial Services PROFIT & LOSS (EURm) Revenues Non Recurrent Items Net Profit (reported) BALANCE SHEET (EURm) Shareholders Equity Minorities equity Net Debt NAV Constituents & Total NAV (EURm) KBC Other assets Net cash/(debt) position Total Net Asset Value Discount/(Premium) to NAV Listed shareholdings on NAV OTHER ITEMS (EURm) Total Market Cap Debt / Equity Payout Ratio P/BV Dividend Yield (Gross) PER SHARE DATA (EUR) EPS (reported) NAVPS BVPS DPS 2012 0.8 0.0 -30.4 2013 82.2 0.0 50.8 2014e 15.8 35.9 25.0 2015e 155.0 0.0 137.9 1,961.8 0.0 -623.9 2,012.6 0.0 -573.1 2,037.6 0.0 -390.0 2,175.5 0.0 -390.0 1,370.1 0.0 -623.9 746.3 28.1% 183.6% 2,351.8 0.0 -573.1 1,778.7 34.0% 132.2% 3,399.9 0.0 -390.0 3,009.9 26.7% 113.0% 3,399.9 0.0 -390.0 3,009.9 26.7% 113.0% 536.4 -31.8% 0.0% 0.3 0.0% 1,174.5 -28.5% 0.0% 0.6 0.0% 1,905.1 -19.1% 0.0% 0.9 0.0% 1,905.1 -17.9% 0.0% 0.9 0.0% -0.389 9.531 25.054 0.000 0.649 22.716 25.703 0.000 0.319 38.440 26.022 0.000 1.761 38.440 27.783 0.000 Profile: KBC Ancora (KBCA) is a single asset holding company which invests in the KBC Group. In FY06/07 and FY07/08 leverage was added to acquire additional KBC shares. KBCA is the result of a long litigation between Cera (former owner of Cera Bank and ABB Insurance, that merged with Kredietbank to form KBC) and its cooperative shareholders. Since the merger of the former KBC with its parent mono holding company Almanij, KBC Ancora’s sole significant asset is a stake in KBC. KBCA currently holds 77,516,380 KBC shares (or 0.99 KBC per KBCA share) and a net debt of c. EUR 394m (EUR 5.08 per KBCA share). SWOT Analysis Strengths • Attractive bancassurance model (cross-selling and improved efficiency) • Well capitalised with FY13 pro-forma fully loaded B3 common equity ratio of 12.5% • Strong FY13 Net Stable Funding Ratio at 111% and Liquidity Coverage Ratio at 131% • Strong market positions in Belgium and Czech R. Weaknesses • Single asset company invested in KBC Opportunities • Very well run and profitable underlying operations in Belgium • Operating leverage improvements in both Belgium and Czech Republic • Losses on legacy assets (CDO, ABS) may prove lower than anticipated Threats • Further negative impact from lower stock markets and increased provisions • Highly competitive domestic Belgian market for some products (E.g. Mortgages) • Further losses on CDOs and ABSs FINANCIAL CALENDAR (Source: Precise) PRICE (SHORT & LONG AVERAGE) titre 35 30 25 20 15 10 5 0 Mar 11 Jun 11 Sep 11 Dec 11 Mar 12 Jun 12 Sep 12 Dec 12 Mar 13 • Exposure to Ireland (real estate) • Higher capital requirements & regulation Source: Company, Bank Degroof estimates Source : Factset • International markets expected to be loss making until end 2015 • Exposed to Hungary Jun 13 Sep 13 Dec 13 Mar 14 Jun 14 Recommendation: The NAV is calculated as 0.99 times the share price of KBC minus net debt of EUR 5.08 per share. Based on KBC’s closing price (EUR 44.96) at May 14, 2014 KBC Ancora’s NAV stood at EUR 39.42 per share. With KBC Ancora’s closing price at EUR 26.34, this implies a 33.2% discount to NAV. Lack of any dividend payment by KBC in FY13, KBC Ancora expected to realize c. EUR 10m interest charges in 2H13/14E and operating costs in line with last year. This should leave a full year net profit forecast of c. EUR 25m. KBC Ancora will not pay a dividend for the current accounting year. No change to guidance was made in the 3Q13/14 trading update. With a target NAV of EUR 22.9 (based on KBC target price of EUR 36) and an applied target discount to NAV of 25% (lowered from 1 year average of 31% to reflect the lower net debt) our target price of EUR 23 is maintained as well as our Reduce recommendation. Target Price: EUR 23.00 KBC ANCORA SMALL & MID CAPS SELECTION Analyst(s) Dirk Peeters +32 2 287 97 16 Bank Degroof [email protected] 115 Netherlands SMALL & MID CAPS SELECTION EUR 25.36 Buy KENDRION SVEL.AS/KENDR NA Market capitalisation: EUR 329m General Industrials EUR Sales (m) EBITDA (m) EBITDA margin EBIT (m) EBIT margin Net profit (reported) (m) Net profit (adj.) (m) Cash Flow from Ops.bef. chg in NWC (m) Net debt (Cash) (m) Net Debt/Equity Net Debt/EBITDA Interest cover (EBITDA/Fin. interest) ROCE (adj.) ROCE (adj.)/WACC EV / CE EV / Sales EV / EBITDA EV / EBIT P/E (adj.) P/BV OpFCF yield Dividend yield EPS (adj.) EPS (adj.) growth BVPS DPS Abs. Performances(12m,6m,3m,1m): 12 month High/low: EUR25.79 / 19.70 12/12 285 32.4 11.4% 19.7 6.9% 17.9 16.2 19.9 21.3 0.2 0.7 6.6 8.8% 1.0 1.2 0.7 6.4 10.5 11.4 1.8 2.5% 3.6% 1.41 -19.6% 8.79 0.58 25.2% 12/13 12/14e 12/15e 354 447 478 36.9 52.2 60.1 10.4% 11.7% 12.6% 20.9 32.7 40.0 5.9% 7.3% 8.4% 16.7 21.2 26.6 19.7 24.2 29.6 29.1 41.6 47.7 49.0 74.1 53.6 0.4 0.5 0.3 1.3 1.4 0.9 7.1 8.4 10.9 6.5% 10.5% 12.9% 0.7 1.1 1.5 1.7 1.6 1.0 0.9 0.8 9.7 7.7 6.4 17.1 12.3 9.6 15.1 13.6 11.1 2.3 2.3 2.0 4.3% 8.3% 9.2% 2.3% 2.9% 3.5% 1.58 1.86 2.28 12.4% 17.7% 22.6% 10.31 11.25 12.56 0.58 0.75 0.90 10.7% 5.7% 2.3% Avg. Daily nb traded shares:10,209 Main shareholders: Free float 51.6%; Delta Lloyd 15.0%; Project Holland 6.8%; Janivo 6.0%; Invesco 6.0%; T Rowe Price 5.0%; Menor 5.0%; Caldenborgh 5.0%; Darlin 4.7%; All share prices at 19/05/14. Profile: Kendrion develops, manufactures and markets electromagnetic systems and components, which are used in lifts, door-locking systems, industrial robots, electrical switchbox systems, diesel engines, airconditioning installations and motor cooling systems. Automotive business represents c. 2/3 of the group, Industrial 1/3. In a very local and highly fragmented market, Kendrion has a leading position in Europe (Germany > 60% of revenues). Management targets organic sales growth of at least 10% annually and an EBIT margin of more than 10%. SWOT Analysis Strengths • Strong leading market positions in Europe Weaknesses • High exposure to German industry (machine building & automotive) • Relatively large clients (largest accounts for 9% of total revenue) • Global presence • Strong R&D competences • Deep relationship with customers Opportunities • Consolidator in a fragmented market • High demand for solenoids driven by safety, comfort and automation • Further geographic expansion Threats • Backward integration of Original Equipment Manufacturers • Shortage of experienced engineers in Germany Recommendation: Kendrion rides the global trend of electromagnetic switches and drives replacing mechanical and hydraulic systems. We expect that Kendrion will continue to gain market share in the growing market for electromagnetic components, by adding new applications and entering new market segments. Supported by a cyclical recovery, trend exposure and operational excellence underpin a solid appreciation of the stock over the medium term. Target Price: EUR 27.00 FINANCIAL CALENDAR (Source: Precise) PRICE (SHORT & LONG AVERAGE) titre 28 26 24 Gert Steens Johan van den Hooven 22 20 18 16 14 Mar 11 Source : Factset 116 KENDRION SMALL & MID CAPS SELECTION Analyst(s) Jun 11 Sep 11 Dec 11 Mar 12 Jun 12 Sep 12 Dec 12 Mar 13 Jun 13 Sep 13 Dec 13 Mar 14 Jun 14 +312 0 5508639 +312 0 5508518 SNS Securities [email protected] [email protected] Belgium SMALL & MID CAPS SELECTION EUR 138.90 Hold KINEPOLIS KIPO.BR/KIN BB Market capitalisation: EUR 728m Media EUR Sales (m) EBITDA (m) EBITDA margin EBIT (m) EBIT margin Net profit (reported) (m) Net profit (adj.) (m) Cash Flow from Ops.bef. chg in NWC (m) Net debt (Cash) (m) Net Debt/Equity Net Debt/EBITDA Interest cover (EBITDA/Fin. interest) ROCE (adj.) ROCE (adj.)/WACC EV / CE EV / Sales EV / EBITDA EV / EBIT P/E (adj.) P/BV OpFCF yield Dividend yield EPS (adj.) EPS (adj.) growth BVPS DPS Abs. Performances(12m,6m,3m,1m): 12 month High/low: EUR145.00 / 95.52 12/12 255 72.3 28.4% 51.7 20.3% 35.7 37.4 56.3 90.6 0.8 1.3 14.5 19.6% 2.4 2.7 2.1 7.5 10.6 12.5 4.2 10.3% 3.2% 6.55 18.5% 19.60 2.60 41.1% 12/13 246 75.1 30.5% 55.1 22.4% 37.5 37.4 57.6 88.5 0.8 1.2 14.9 20.5% 2.5 3.6 2.8 9.3 12.6 16.9 5.8 7.0% 2.3% 6.83 4.2% 19.81 3.19 28.4% 12/14e 12/15e 255 265 73.6 75.7 28.8% 28.5% 55.0 57.2 21.5% 21.6% 36.1 37.4 36.1 37.4 54.7 55.9 97.4 104 1.1 1.3 1.3 1.4 16.2 15.2 21.1% 22.4% 2.5 2.7 4.4 4.5 3.2 3.1 11.2 11.0 15.0 14.5 20.9 20.2 8.0 9.0 5.5% 5.5% 2.3% 2.4% 6.63 6.88 -2.8% 3.7% 17.31 15.44 3.17 3.29 17.1% 2.0% Avg. Daily nb traded shares:1,993 Main shareholders: Free float 48.4%; Kinohold Bis & Joost Bert 45.5%; Treasury shares 5.4%; Profile: The Kinepolis Group is Belgian market leader and a European reference player in the operation of movie theatres and related activities. The company operates 23 cinema complexes with 317 screens across 5 European countries. 60% of revenue is generated in Belgium, 26% in France, 12% in Spain and 2% in Poland and Switzerland. The most important revenue drivers for Kinepolis are ticket sales (55% of total revenues), followed by in-theatre sales (22%), B2B (14%), which is screen advertisement, the organisation of events and sale of vouchers, and finally the letting of commercial locations and restaurants in and around the movie theatre (4%) and Brightfish. Kinepolis is the owner of more than 90% of the real estate property. The group was born out of the merger of two family companies (Bert and Claeys) which began working together in the early 1970s. The company has been listed on the Belgian stock market since 1998 and in Sept. 2006 the family Claeys exited by placing its 23% participation in the market with institutional investors. SWOT Analysis Strengths • Cinema is a non-cyclical business Weaknesses • Mature market environment • Highest margins in the industry • Dependence on movie offer and weather • Quality theatres in good locations • Structural declining visitor numbers • Owns all of its complexes - Strong management Opportunities • Unlocking value from real estate portfolio Threats • Competition from home cinema and piracy • Self-learning organisation • 3D may lose some of its popularity • Personalised direct marketing • Exposure to weak Spanish market (+ impact Spanish VAT increase) • Active movie offering - B2B and alternative content M. Joost Bert 0.8%; All share prices at 19/05/14. Recommendation: We expect Kinepolis to generate EUR 50m to EUR 60m of free cash flow per year in 2013-2016. This implies that Kinepolis is trading at an expected FCF yield of >9%. FINANCIAL CALENDAR (Source: Precise) PRICE (SHORT & LONG AVERAGE) titre 160 140 02/06/2014 Dividend Payment 2013 28/05/2014 Ex Dividend Date 2013 In 1Q14 Kinepolis welcomed 4.8m visitors, an increase of 11.2% compared to 1Q13. The rise was driven by the good international and local film offer and by the mild winter weather. All revenue lines, except Brightfish, were up whereas EBITDA and EBITDA per share improved. We do not exclude that a third share buy-back will be announced shortly. Shares will split 5 to 1 effective July 1, 2014. Target Price: EUR 130.00 120 100 80 Analyst(s) 60 40 Mar 11 Jun 11 Sep 11 Dec 11 Mar 12 Jun 12 Sep 12 Dec 12 Mar 13 Jun 13 Sep 13 Dec 13 Mar 14 Jun 14 Dirk Peeters Bank Degroof +32 2 287 97 16 [email protected] Source : Factset 117 France SMALL & MID CAPS SELECTION EUR 27.27 Hold KORIAN-MEDICA KORI.PA/KORI FP Market capitalisation: EUR 2137m Healthcare EUR Sales (m) EBITDA (m) EBITDA margin EBIT (m) EBIT margin Net profit (reported) (m) Net profit (adj.) (m) Cash Flow from Ops.bef. chg in NWC (m) Net debt (Cash) (m) Net Debt/Equity Net Debt/EBITDA Interest cover (EBITDA/Fin. interest) ROCE (adj.) ROCE (adj.)/WACC EV / CE EV / Sales EV / EBITDA EV / EBIT P/E (adj.) P/BV OpFCF yield Dividend yield EPS (adj.) EPS (adj.) growth BVPS DPS Abs. Performances(12m,6m,3m,1m): 12 month High/low: EUR28.76 / 16.04 12/12 1,108 137 12.4% 92.3 8.3% 23.2 23.2 58.8 567 0.8 4.1 4.0 3.5% 0.6 0.7 1.0 8.0 11.8 19.5 0.7 17.4% 2.2% 0.68 2.8% 20.42 0.60 58.1% 12/13e 12/14e 12/15e 1,371 2,244 2,612 182 321 363 13.3% 14.3% 13.9% 121 219 258 8.8% 9.7% 9.9% 28.8 67.8 111 28.8 67.8 111 93.2 173 219 761 1,391 1,375 1.0 0.9 0.8 4.2 4.3 3.8 4.0 5.1 5.3 4.1% 4.0% 4.8% 0.6 0.6 0.8 0.9 1.2 1.1 1.1 1.6 1.4 8.5 11.3 9.9 12.8 16.6 13.9 24.3 31.5 19.3 1.0 1.4 1.3 3.6% 7.5% 5.3% 2.2% 2.2% 2.2% 0.85 0.87 1.41 24.2% 2.3% 63.5% 20.67 20.18 20.99 0.60 0.60 0.60 12.0% 5.2% 1.0% Avg. Daily nb traded shares:52,400 Profile: Korian-Médica resulted from the merger of privately-held group Suren and listed company Medidep, before the merger with Médica, in 2014. The group specialises in the provision of permanent assistance for geriatric patients, and temporary assistance including follow-up and psychiatric assistance after surgery. It is one of the two leading players in the permanent dependence segment in Europe and the temporary dependence segment (with Générale de Santé), ahead of non-listed DVD. The group recently extended its geographic footprint to include Italy (acquisition of Segesa) and Germany (acquisition of Phoenix, followed by Curanumin in March 2013) where consolidation of the private commercial sector provides a major opportunity given its level of fragmentation. There are also opportunities in the private not-for-profit sector whose investment capacities are limited given the requirements to upgrade the equipment and bring it into line with quality standards. SWOT Analysis Strengths • Sharp increase in demand for care of the over 85-age group in all European countries • Limited offer in qualitative and quantitative terms • Close contact with authorities which provide authorisation to practise in Germany Opportunities • Capacity for sector consolidation in Germany Weaknesses • Merger Korian-Medica and synergies production • High debt following the acquisitions in Italy and Germany and merger Korian-M‚dica • Slow improvement in margins over very short term ? Threats • Exposure to rumours of mistreatment • Transfer of activity from private not-for-profit sector towards private commercial sector Main shareholders: Free float 40.3% (10.9%); Predica 20.4%; Batipart 16.0%; Recommendation: The releveraging of Korian until mid-2013 gave the company enough cash to accelerate its growth. This releveraging reduced Korian’s discount vs. Orpéa and Medica, which peaked in 2010. COVEA 12.7%; Malakoff M‚d‚ric 6.4%; ACM Vie 4.2%; All share prices at 19/05/14. FINANCIAL CALENDAR (Source: Precise) PRICE (SHORT & LONG AVERAGE) titre 30 16/07/14 Trading Update 28 26 24 22 2014Q2 The expected improvement in margins (quarter-on-quarter optimisation of occupancy rates and structural costs) within a buoyant sector (insufficient capacity, doubling in the population of over 85s, excellent cash position of senior citizens) are the main drivers behind the recent re-rating. We now estimate that upside potential is not sufficient enough to support this positive stance. The new Korian-Médica has to provide the market with some good news concerning synergies, cost-cutting and margin improvement in Germany to push valuation multiples up, after the strong performance (x2.5) of the past 2 years. Hold. 20 Target Price: EUR 26.00 18 16 14 12 10 Mar 11 Source : Factset Jun 11 Sep 11 Dec 11 Mar 12 Jun 12 Sep 12 Dec 12 Mar 13 Jun 13 Sep 13 Dec 13 Mar 14 Jun 14 KORIAN-MEDICA SMALL & MID CAPS SELECTION Analyst(s) Christian Auzanneau 118 +33 4 78 92 01 85 CM - CIC Securities [email protected] Spain SMALL & MID CAPS SELECTION EUR 9.87 Hold LABORATORIOS ROVI ROVI.MC/ROVI SM Market capitalisation: EUR 494m Healthcare EUR Sales (m) EBITDA (m) EBITDA margin EBIT (m) EBIT margin Net profit (reported) (m) Net profit (adj.) (m) Cash Flow from Ops.bef. chg in NWC (m) Net debt (Cash) (m) Net Debt/Equity Net Debt/EBITDA Interest cover (EBITDA/Fin. interest) ROCE (adj.) ROCE (adj.)/WACC EV / CE EV / Sales EV / EBITDA EV / EBIT P/E (adj.) P/BV OpFCF yield Dividend yield EPS (adj.) EPS (adj.) growth BVPS DPS Abs. Performances(12m,6m,3m,1m): 12 month High/low: EUR10.05 / 6.62 12/12 203 27.0 13.3% 21.7 10.7% 19.5 19.5 24.8 -7.3 -0.1 -0.3 32.2 17.0% 1.8 1.7 1.1 8.3 10.3 13.6 2.1 3.3% 2.6% 0.39 8.4% 2.53 0.14 47.3% 12/13 12/14e 12/15e 219 240 264 32.4 34.7 41.3 14.8% 14.5% 15.6% 25.5 25.2 31.3 11.6% 10.5% 11.9% 23.0 22.9 28.9 23.0 22.9 28.9 30.0 32.4 38.8 -11.0 -10.2 -24.3 -0.1 -0.1 -0.1 -0.3 -0.3 -0.6 27.5 30.8 54.6 17.5% 16.1% 19.5% 2.1 1.9 2.3 3.2 2.9 2.8 2.1 1.9 1.7 14.3 13.2 10.8 18.2 18.2 14.2 21.7 21.6 17.1 3.5 3.1 2.7 1.0% 2.5% 4.9% 1.6% 1.6% 2.1% 0.46 0.46 0.58 18.0% -0.7% 26.3% 2.89 3.18 3.59 0.16 0.16 0.20 5.4% 3.2% 3.1% Avg. Daily nb traded shares:19,096 Main shareholders: Founding Family 66.8%; Free float 20.0%; Bestinver 5.1%; Iondumenta Puery 5.0%; Norges Bank 3.0%; All share prices at 19/05/14. FINANCIAL CALENDAR (Source: Precise) PRICE (SHORT & LONG AVERAGE) Profile: Rovi is an integrated and specialised pharmaceutical laboratory engaging in research, development, manufacturing, and marketing of small molecules and biological medical specialties and contrast agents, also providing services such as manufacturing (filling) of injectables for other companies in the sector. The laboratory’s long track record and its prestigious reputation position it as a strategic partner in domestic grounds for international pharmaceuticals. The strategic agreement signed with MSD (2010) has been essential in accelerating the operating leverage process in the main divisions. MSD’s agreement has enabled to intensify the expansion of Rovi’s specialised pharmaceuticals division, through the incorporation of new products to its portfolio, as well as the toll-manufacturing business line (CAGR’13-18e 8.3% and 4% respectively), enhancing the improvement of operating margins (+20bp.in 2015e), while aiming to reduce its dependence from its biological drug bemiparine, indicated for the treatment of venous thrombocytopenia in medical and surgical patients (30% of Group revenues in 2013). The laboratory counts with a high patent protected portfolio (75% of the specialised pharmaceuticals), that includes compounds such as Corlentor (Ivrabadine); EXXIV, Thymanax, Absorcol and Vitoryn which stem from the MSD’s agreement among others, and will commercialise Novartis’ indacaterol as from mid 2014. SWOT Analysis Strengths • Nationwide leader in syringe and vial bottling services. • Product portfolio diversification • High visibility • Sound balance sheet Opportunities • Operational leverage strategy (MSD) • Strategic national partner of international peers Weaknesses • Highly regulated sector • Operational leverage of its toll-manufacturing division • Leveraging in its R&D pipeline: ISM platform • Oral anticoagulants competition in the long term • Dependence on bemiparine. • Pricing pressure under new SRP • Weak R&D performance Threats • Regulatory reforms • Generics competition • Bemiparin's raw material price increase Recommendation: We value the company via DCF method reaching a fair value of EUR10.10/share (wacc: 8.4% and g:1%) excluding its R&D pipeline (ISM investigation line with risperidone) and including the first 4 in-license agreement options from MSD (atorvastatine’s combination, odanacatib and Janumet). The company should launch Bemiparine in China before the year end. Target Price: EUR 10.10 titre 11 10 9 Analyst(s) 8 7 Ana Isabel González García CIIA 6 BEKA Finance +34 91 436 78 09 [email protected] 5 4 Mar 11 Jun 11 Sep 11 Dec 11 Mar 12 Jun 12 Sep 12 Dec 12 Mar 13 Jun 13 Sep 13 Dec 13 Mar 14 Jun 14 Source : Factset 119 Finland SMALL & MID CAPS SELECTION EUR 14.20 Buy LASSILA & TIKANOJA LAT1V.HE/LAT1V FH Market capitalisation: EUR 551m Support Services EUR Sales (m) EBITDA (m) EBITDA margin EBIT (m) EBIT margin Net profit (reported) (m) Net profit (adj.) (m) Cash Flow from Ops.bef. chg in NWC (m) Net debt (Cash) (m) Net Debt/Equity Net Debt/EBITDA Interest cover (EBITDA/Fin. interest) ROCE (adj.) ROCE (adj.)/WACC EV / CE EV / Sales EV / EBITDA EV / EBIT P/E (adj.) P/BV OpFCF yield Dividend yield EPS (adj.) EPS (adj.) growth BVPS DPS Abs. Performances(12m,6m,3m,1m): 12 month High/low: EUR15.52 / 12.71 12/12 674 92.0 13.6% 48.4 7.2% 36.4 36.4 80.0 82.3 0.4 0.9 27.0 10.8% 1.6 1.6 0.8 5.8 11.0 12.4 1.9 5.9% 5.2% 0.94 -29.8% 6.01 0.60 1.7% 12/13 12/14e 12/15e 668 665 686 106 110 114 15.8% 16.5% 16.7% 51.7 55.1 59.6 7.7% 8.3% 8.7% 37.2 39.8 42.3 37.2 39.8 42.3 91.2 94.3 97.1 60.0 36.6 24.1 0.3 0.2 0.1 0.6 0.3 0.2 37.3 30.4 28.6 13.5% 14.2% 15.0% 2.0 2.1 2.2 2.2 2.0 1.9 1.0 0.9 0.8 6.2 5.4 5.0 12.6 10.7 9.6 15.9 13.9 13.0 2.8 2.4 2.2 13.0% 7.9% 8.9% 3.5% 4.2% 4.2% 0.96 1.02 1.09 2.1% 7.0% 6.3% 5.45 5.98 6.47 0.50 0.60 0.60 -6.0% -5.6% -0.3% Avg. Daily nb traded shares:37,028 Main shareholders: Free float 100.0%; Evald ja Hilda Nissin Säätiö 6.2%; Mandatum Henkivakuutusosakeyhtiö 5.8%; Nordea-rahastot 4.3%; All share prices at 19/05/14. FINANCIAL CALENDAR (Source: Precise) PRICE (SHORT & LONG AVERAGE) Profile: Lassila & Tikanoja specialises in environmental management and property and plant support services, and supplies wood-based biofuels, recovered fuels and recycled raw materials. L&T operates in Finland, Sweden, Latvia and Russia. SWOT Analysis Strengths • Solid foothold in the Finnish waste management and recycling segments • Efficient facilities • Strong barriers to entry Weaknesses • Multifaceted business portfolio • Legislative factors significantly affect its business prospects • Margin improvement in the core businesses is very difficult Opportunities • Use of renewable energy sources represents a politically attractive goal to support • Higher waste taxes in Finland Threats • Renewable fuels getting less support in the politically uncertain atmosphere • Tightening competition further depressing margins • Could still streamline the business portfolio by selling assets • Earnings sensitive to diesel prices Recommendation: The outlook for Environmental Services, Lassila & Tikanoja’s most important business division, is enhancing, supported by growing demand for waste management and rising capacity utilisation in the industry. In Facility Services and in Industrial Services, the earnings improvement path has been quite slow in recent quarters. The recent market turbulence has favoured companies and sectors characterised by steady cash flow and high cash flow yield, which has also raised the average valuation of L&T’s peer group. We continue to set our target price for L&T based on its peer group’s valuation and, using our 2014 forecasts, we end up with EUR 17.50. Target Price: EUR 17.50 titre 16 15 14 LASSILA & TIKANOJA SMALL & MID CAPS SELECTION Analyst(s) 13 12 11 10 Henri Parkkinen 9 8 Mar 11 Source : Factset 120 Jun 11 Sep 11 Dec 11 Mar 12 Jun 12 Sep 12 Dec 12 Mar 13 Jun 13 Sep 13 Dec 13 Mar 14 Jun 14 +358 10 252 4409 Pohjola [email protected] France SMALL & MID CAPS SELECTION EUR 132.86 Hold LDC LDCP.PA/LOUP FP Market capitalisation: EUR 1084m Food & Beverage EUR Sales (m) EBITDA (m) EBITDA margin EBIT (m) EBIT margin Net profit (reported) (m) Net profit (adj.) (m) Cash Flow from Ops.bef. chg in NWC (m) Net debt (Cash) (m) Net Debt/Equity Net Debt/EBITDA Interest cover (EBITDA/Fin. interest) ROCE (adj.) ROCE (adj.)/WACC EV / CE EV / Sales EV / EBITDA EV / EBIT P/E (adj.) P/BV OpFCF yield Dividend yield EPS (adj.) EPS (adj.) growth BVPS DPS Abs. Performances(12m,6m,3m,1m): 12 month High/low: EUR133.16 / 94.80 02/12 2,774 177 6.4% 96.1 3.5% 56.4 56.4 132 -50.0 -0.1 -0.3 nm 10.1% 1.1 1.0 0.2 3.6 6.7 12.2 1.1 5.7% 2.1% 6.92 18.1% 76.34 1.80 40.1% 02/13 2,923 163 5.6% 87.5 3.0% 60.5 60.5 141 -49.1 -0.1 -0.3 nm 8.7% 0.9 1.1 0.2 4.4 8.3 12.8 1.2 2.1% 1.4% 7.49 8.3% 81.81 1.80 12.1% 02/14e 02/15e 3,026 3,101 202 227 6.7% 7.3% 102 120 3.4% 3.9% 66.6 78.8 66.6 78.8 160 180 -64.1 -123 -0.1 -0.2 -0.3 -0.5 nm nm 9.7% 11.4% 1.0 1.2 1.3 1.4 0.3 0.3 4.5 4.2 8.8 7.9 14.4 13.6 1.3 1.4 6.4% 8.4% 1.4% 1.4% 8.24 9.75 10.0% 18.3% 88.49 96.19 1.90 1.90 11.8% 0.1% Avg. Daily nb traded shares:0,798 Profile: LDC produces and sells: 1) poultry in France (three-quarters of sales): standard grade with the Le Gaulois brand and premium grade with the Loué brand, sold as whole chickens, chicken portions and crumbed products; and 2) poultry abroad, mainly in Poland, through its Drosed subsidiary acquired in June 2000. By product range, 82.5% of business is in processed foods, including delicatessen foods such as pizzas, sandwiches, Asian dishes under the Chip Long brand, and meat pastries SWOT Analysis Strengths • Leader in the French mass retail segment for poultry • Leading producer of premium poultry under the Lou‚ brand • Recently acquired international standing Weaknesses • The French poultry sector is frequently hit by crises linked to over-production • Absence of a strong brand, difficulty establishing Le Gaulois as a horizontal brand • Earnings highly dependent on the state of the French poultry market • Sound financial structure Opportunities • Poultry sector rationalisation via consolidation or a substantial reduction in production capacity • LDC could shore up supplies by buying rivals • Development of delicatessen products, notably pizzas and sandwiches • Market recovery in Poland Threats • Imports of cheap chicken from Brazil & Thailand • Cooperatives continue to focus on volumes rather than prices • Risk of epidemics, such as bird flu Recommendation: We expected low growth of 1% in Q4; the reported figure was flat at -0.2% (-0.8% on constant scope), i.e., revenues of EUR811.9m (EUR822m CM-CIC). FY 2013 revenues were EUR3,026m Main shareholders: Lambert & Chancereul families 61.0% (70.3%); Free float 24.3% (14.4%); Huttepain Family 9.6% (10.3%); vs EUR2,923.1m in 2012 (+3.5%, of which a +1.5% volume effect and +2% price effect). That said, given the Guillet family 4.3% (5.0%); Treasury stock 0.9% (0.0%); good product-mix trend, the group expects UOI growth excl. the CICE competitive tax credit while they initially expected it to be flat. We maintain our UOI at EUR102m (3.39% margin) vs EUR85.9m (2.94%). Q4 All share prices at 19/05/14. clearly points to a fall in consumption. LDC has shown staunch resilience by focusing on high value added product ranges. While France was hit hard, international ops turned in a good performance with constant scope growth of 9.4% over the full year and 3.9% in Q4. The disposal of the lossmaking upstream activity in Spain on 1 February 2013 led to full-year growth of 0.7%. The delicatessen division posted a rise in sales of PRICE (SHORT & LONG AVERAGE) FINANCIAL CALENDAR (Source: Precise) its Marie brand (which should be in the black in H2) while the private label segment was weak. Management is cautious on 2014 owing to still-low consumer spending and volatile commodity prices, with increases in recent weeks. titre 140 130 120 110 100 Target Price: EUR 119.00 90 80 70 60 Mar 11 Source : Factset Jun 11 Sep 11 Dec 11 Mar 12 Jun 12 Sep 12 Dec 12 Mar 13 Jun 13 Sep 13 Dec 13 Mar 14 Jun 14 Analyst(s) Francis Prêtre CM - CIC Securities +33 4 78 92 02 30 [email protected] 121 Belgium SMALL & MID CAPS SELECTION EUR 80.00 LNRE.BR/LEAS BB Market capitalisation: EUR 394m Real Estate EUR 12/12 38 29 79.1% 1 (10) 21 21 21.11 362 579 624 5.26 4.40 63.80 2.2% 70.62 8.1% 6.7% 21.5 12 3.8 362 54.3% 5.1% 12/14e 12/15e 48 49 EBITDA (m) 38 39 EBITDA margin 79.1% 79.1% Portfolio Result (m) 5 0 Net Financial Result (10) (10) Net Profit (reported)(m) 33 28 Net Profit (adj.)(m) 28 28 Funds From Operations 27.81 28.21 Net Debt (m) 375 372 Portfolio Value (m) 676 678 Enterprise Value (m) 770 766 EPS (adj.) 5.63 5.73 DPS 4.70 4.80 IFRS NAVPS 68.12 69.37 Premium/(discount) 17.4% 15.3% EPRA NAVPS 73.77 75.04 Earnings adj. yield 7.0% 7.2% Dividend yield 5.9% 6.0% EV/EBITDA 20.3 19.9 P/E (adj.) 14 14 Int. cover(EBITDA/Fin.int) 3.8 3.8 Net debt/(cash) (m) 375 372 Net Debt/Total Assets 49.2% 48.6% Abs. Performances(12m,6m,3m,1m): 3.6% -0.7% 12 month High/low: EUR83.00 / 65.15 Avg. Daily nb traded shares:0,936 Main shareholders: Free float 33.6%; Ackermans & van Haaren Group 30.0%; AXA Belgium NV 29.0%; Gross Rental Income (m) 12/13 44 34 79.0% 2 (10) 27 25 24.59 376 663 739 4.98 4.45 65.93 11.6% 71.58 6.2% 5.6% 21.5 15 3.6 376 50.0% 9.1% AG Insurance 7.4%; FINANCIAL CALENDAR (Source: Precise) PRICE (SHORT & LONG AVERAGE) titre 85 80 75 26/05/14 Dividend Payment 2013 21/05/14 Ex Dividend Date 2013 19/05/14 AGM 2013 70 65 60 55 Mar 11 122 Jun 11 Sep 11 Dec 11 Mar 12 Jun 12 Profile: Leasinvest Real Estate is a Belgian REIT that owns and manages a EUR 710.7m portfolio consisting of offices (35%), retail (43%) and logistics (22%) premises – some 35 properties in total – located in the Grand Duchy of Luxembourg (60%) and Belgium (40%). In addition, Leasinvest owns 8% of the shares of the Belgian REIT Retail Estates valued at EUR 43.0m on 31 March 2014. The company is listed on NYSE Euronext Brussels since 1999 and is, since January 2005, included in the EPRA Eurozone Total Return Index. SWOT Analysis Strengths • Presence in Luxembourg (58% of portfolio) • High gross portfolio yield (exc. Vac.) of 7.3% Weaknesses • Some exposure to challenging Brussels office market, although it is limited: 14% of portfolio, of which 9.5% in the Decentralised • No pure playArea • Value creation through (re)developments • Limited liquidity, but active OTC market Opportunities • Leverage knowhow in Luxembourg market Threats • Vacancy risk, notably in office segment • Fully letting The Crescent (31% vacant) • Hike in interest rates • Additional (re)developments • Lifecycle of buldings • Expand activities to a third country Recommendation: Leasinvest reported higher 1Q14 revenues and earnings, but on a per share basis the net current profit declined by 13.5%. The EPRA NAV stands at EUR 71.5 per share which prices the stock at a c. 15% premium (cum EUR 4.50 gross coupon, ex-coupon May 21). Management has realised its strategic orientation (more Luxembourg and more retail) and is now guiding for higher full year FY14E net current result and net reported result. Caterpillar and Sal. Oppenheim have announced that they won’t renew their leases when they expire (respectively 30/10/14 and 31/12/14). Leasinvest is however confident that given the prime location and low vacancy rate on that location, it will be able to replace the tenants soon. All share prices at 19/05/14. Source : Factset Hold LEASINVEST REAL ESTATE Sep 12 Dec 12 Mar 13 Jun 13 Sep 13 Dec 13 Mar 14 Jun 14 We maintain our Hold rating and EUR 74 TP. Target Price: EUR 74.00 LEASINVEST REAL ESTATE SMALL & MID CAPS SELECTION Analyst(s) Dirk Peeters +32 2 287 97 16 Bank Degroof [email protected] Germany SMALL & MID CAPS SELECTION EUR 53.23 Accumulate LEONI LEOGn.DE/LEO GY Market capitalisation: EUR 1739m Automobiles & Parts EUR Sales (m) EBITDA (m) EBITDA margin EBIT (m) EBIT margin Net profit (reported) (m) Net profit (adj.) (m) Cash Flow from Ops.bef. chg in NWC (m) Net debt (Cash) (m) Net Debt/Equity Net Debt/EBITDA Interest cover (EBITDA/Fin. interest) ROCE (adj.) ROCE (adj.)/WACC EV / CE EV / Sales EV / EBITDA EV / EBIT P/E (adj.) P/BV OpFCF yield Dividend yield EPS (adj.) EPS (adj.) growth BVPS DPS Abs. Performances(12m,6m,3m,1m): 12 month High/low: EUR59.57 / 35.02 12/12 3,809 352 9.2% 236 6.2% 156 35.3 212 249 0.3 0.7 9.3 14.5% 1.7 1.0 0.3 3.5 5.2 26.4 1.1 5.5% 5.3% 1.08 51.4% 25.82 1.50 40.8% 12/13 12/14e 12/15e 3,918 4,176 4,534 284 347 381 7.3% 8.3% 8.4% 163 217 248 4.2% 5.2% 5.5% 106 140 165 27.6 154 181 187 272 300 257 247 186 0.3 0.3 0.2 0.9 0.7 0.5 8.8 11.6 13.6 10.0% 11.5% 12.6% 1.2 1.4 1.6 1.5 1.4 0.5 0.5 0.5 7.5 6.0 5.4 13.1 9.7 8.2 nm 11.3 9.6 2.1 1.9 1.7 1.9% 2.4% 6.3% 1.9% 2.8% 3.3% 0.85 4.73 5.55 -21.7% nm 17.3% 25.29 28.62 32.18 1.00 1.50 1.76 5.1% -4.2% -0.5% Avg. Daily nb traded shares:227,074 Main shareholders: Free float 100.0%; All share prices at 19/05/14. Profile: Leoni is one of Europe’s leading companies in its core Wiring Systems (WS) business and has a leading market position within its chosen Wire & Cable (WCS) niche markets. A key focus of the company’s business activity is the production of wiring systems for the automobile industry, which therefore also represents Leoni’s dominant client group. Wiring Systems should account for roughly 64% of group EBIT in FY 2014. The remaining is attributable to the Wire & Cable Solutions division. SWOT Analysis Strengths • Strong market position in Europe. Weaknesses • Low capacity utilisation in the industrial cable production in Europe. • Cost leader in the wiring systems industry. • Strong order book. Opportunities • Recovery of the European car market. Threats • Country risks in their low cost production locations (Ukraine, North Africa etc.) • Further growth in Emerging Markets. • Recovery of demand for industrial cables in Europe. Recommendation: Leoni has done its homework during the crisis by reducing its cost position significantly. Revenues and earnings have risen to new record levels in 2012. In 2013 the company had a transition year and suffered from the ramp-up of new orders. This should however result in a significant earnings growth in the next years. This is not yet fully included in the current share price, in our view. Accumulate. Target Price: EUR 58.00 FINANCIAL CALENDAR (Source: Precise) PRICE (SHORT & LONG AVERAGE) titre 65 60 12/08/14 Results 2014H1 12/08/14 Results 2014H1 55 50 45 LEONI SMALL & MID CAPS SELECTION Analyst(s) Tim Schuldt, CFA +49 69 5899 7433 Equinet Bank [email protected] 40 35 30 25 20 Mar 11 Jun 11 Sep 11 Dec 11 Mar 12 Jun 12 Sep 12 Dec 12 Mar 13 Jun 13 Sep 13 Dec 13 Mar 14 Jun 14 Source : Factset 123 France SMALL & MID CAPS SELECTION EUR 116.40 Hold LISI GFII.PA/FII FP Market capitalisation: EUR 1256m Aerospace & Defense EUR Sales (m) EBITDA (m) EBITDA margin EBIT (m) EBIT margin Net profit (reported) (m) Net profit (adj.) (m) Cash Flow from Ops.bef. chg in NWC (m) Net debt (Cash) (m) Net Debt/Equity Net Debt/EBITDA Interest cover (EBITDA/Fin. interest) ROCE (adj.) ROCE (adj.)/WACC EV / CE EV / Sales EV / EBITDA EV / EBIT P/E (adj.) P/BV OpFCF yield Dividend yield EPS (adj.) EPS (adj.) growth BVPS DPS Abs. Performances(12m,6m,3m,1m): 12 month High/low: EUR129.35 / 82.00 12/12 1,107 155 14.0% 100 9.1% 57.3 57.1 120 76.7 0.1 0.5 65.3 8.9% 12/13 1,175 179 15.2% 129 11.0% 74.6 74.5 142 67.8 0.1 0.4 46.9 10.7% 1.0 0.7 4.8 7.4 11.7 1.2 6.7% 2.3% 5.29 -1.7% 53.28 1.40 37.8% 1.6 1.0 6.9 9.5 15.6 1.9 2.7% 1.5% 6.91 30.5% 57.96 1.70 8.8% 12/14e 1,257 198 15.7% 143 11.4% 80.8 81.7 152 42.1 0.1 0.2 27.9 11.5% 12/15e 1,344 218 16.3% 158 11.7% 90.8 90.9 169 8.0 0.0 0.0 30.0 12.1% 1.6 1.5 1.0 0.9 6.6 5.8 9.1 8.0 15.4 13.8 1.8 1.7 7.5% 4.3% 1.6% 1.7% 7.57 8.43 9.6% 11.3% 63.75 70.34 1.83 1.96 -5.4% 1.1% Avg. Daily nb traded shares:1,607 Main shareholders: CID 60.9% (69.7%); Free float 24.2% (19.4%); VMC - VIELLARD MIGEON & Cie 5.7% (6.9%); Profile: LISI is the world No. 3 for metal and plastic clips, and threaded fasteners for the aerospace and automotive industries. LISI (LInk Solutions for Industry) is specialised in all types of industrial solutions to link different parts of an aircraft, or an auto. The company has three business units: Aeronautics (56% of sales), Automobile (36%), and Medical (5%), and owns 36 factories around the world. In 2013, the group’s main clients in the aerospace segment were Airbus, Boeing, Bombardier, and Dassault Aviation, while auto clients consist of major parts suppliers and carmakers. SWOT Analysis Strengths • Exposure to the aerospace cycle, which is holding up well in the dismal macroeconomic cycle • Very healthy balance sheet which allow to external growth • Management team very efficient : managers hold the capital, ang take care of each type of risk Weaknesses • Regular collapse of the auto sector, Long term pressure on automotive margins • Financial market use to associate LISI with the automotive industry • Historically a very cyclical stock Opportunities • Significant cash flow generation Threats • Aerospace growth cycle could stall • Change of LT status as aerospace sector now accounts for more than 2/3 of profits • Could buy a lot of smaller company, right now in negociation to reinforce Aerospace • Risk of paying too much for acquisitions in this phase of the cycle Recommendation: LISI intends to carry out acquisitions, and has the means to do so, as shown by the acquisition of rival Manoir, announced in March 2014 (its last deal dated back to 2010). All share prices at 19/05/14. This transaction will enable the company to: 1) double its revenues in the structural components business; and 2) increase its economic presence with clients, which have been seeking a much more concentrated segment. PRICE (SHORT & LONG AVERAGE) LISI’s share price is likely to undergo a transition year. No major change in valuation expected in the medium term. Aviation FFP Invest 5.1% (3.2%); Autocontr“le et auto d‚tention 2.8% (0.0%); Salari‚s 1.2% (0.8%); FINANCIAL CALENDAR (Source: Precise) Target Price: EUR 125.00 titre 130 25/07/14 Analyst Meeting 120 2014H1 110 100 90 Analyst(s) 80 70 Agnès Blazy 60 50 40 Mar 11 Source : Factset 124 Jun 11 Sep 11 Dec 11 Mar 12 Jun 12 Sep 12 Dec 12 Mar 13 Jun 13 Sep 13 Dec 13 Mar 14 Jun 14 CM - CIC Securities +33 1 45 96 77 61 [email protected] Belgium SMALL & MID CAPS SELECTION EUR 830.00 Hold LOTUS BAKERIES LOTB.BR/LOTB BB Market capitalisation: EUR 667m Food & Beverage EUR Sales (m) EBITDA (m) EBITDA margin EBIT (m) EBIT margin Net profit (reported) (m) Net profit (adj.) (m) Cash Flow from Ops.bef. chg in NWC (m) Net debt (Cash) (m) Net Debt/Equity Net Debt/EBITDA Interest cover (EBITDA/Fin. interest) ROCE (adj.) ROCE (adj.)/WACC EV / CE EV / Sales EV / EBITDA EV / EBIT P/E (adj.) P/BV OpFCF yield Dividend yield EPS (adj.) EPS (adj.) growth BVPS DPS Abs. Performances(12m,6m,3m,1m): 12 month High/low: EUR858.99 / 620.10 12/12 288 47.0 16.3% 34.7 12.0% 25.7 25.5 38.6 35.2 0.2 0.7 29.9 12.5% 2.0 2.1 1.6 10.0 13.6 16.9 3.0 -1.6% 1.8% 32.77 6.4% 186.17 9.80 27.8% 12/13 332 51.1 15.4% 37.7 11.3% 27.9 27.9 42.1 58.3 0.3 1.1 29.4 11.4% 1.8 2.2 1.9 12.1 16.4 19.9 3.2 -4.8% 1.3% 35.81 9.3% 219.74 10.80 16.1% 12/14e 12/15e 355 371 56.9 62.5 16.0% 16.8% 39.6 45.3 11.2% 12.2% 29.8 35.2 29.8 35.2 47.0 52.3 29.5 1.8 0.1 0.0 0.5 0.0 45.2 nm 11.4% 12.5% 1.9 2.0 2.5 2.4 2.0 1.8 12.3 10.8 17.6 14.8 22.4 19.0 3.4 3.0 4.8% 5.5% 1.4% 1.5% 37.05 43.78 3.5% 18.2% 246.69 278.94 11.30 12.70 2.0% 5.0% Avg. Daily nb traded shares:0,518 Main shareholders: STAK Lotus Bakeries 57.3%; Free float 31.3%; Christavest 8.1%; Lotus Bakeries Group Services 3.4%; All share prices at 19/05/14. FINANCIAL CALENDAR (Source: Precise) PRICE (SHORT & LONG AVERAGE) Profile: Lotus Bakeries focuses on authentic specialities from the biscuit and cake world: caramelised biscuits (“speculoos”), gingerbread, cake specialties, waffles, and pepparkakor biscuits. Lotus Bakeries, with headquarters in Belgium, is an internationally oriented company with production facilities in Belgium, the Netherlands, France and Sweden. The company has its own sales organisations in 10 European countries and in the US, Hong-Kong, China and Chile. Lotus Bakeries sells its products under the Lotus, Peijnenburg and Annas brand names. SWOT Analysis Strengths • Strong brand management (Lotus, Peijnenburg, Annas, Biscoff brand names) • Market leader in niches: caramelised biscuits in Belgium, gingerbread in the Netherl., Pepparkakor in the Nordics • Limited forex risks. The larger part of earnings is only exposed to the euro-zone. • Strong balance sheet and high free cash flow. Will soon be debt free. Opportunities • Continued international sales expansion of caramelised biscuits “speculoos” • International sales expansion of other top-products: madeleine cakes, franchipane cakes and waffles • Launch of innovative products on the base of existing traditional biscuits Weaknesses • Rather low liquidity (low velocity) and very limited free float • Limited scale versus a number of European peers that are part of multinationals • Active in a mature market industry with low organic growth potential Threats • Concentration of customers (big retail chains): price pressure and margin squeeze from major food retailers • A major food crisis could create a sudden drop in demand for almost all products • Increasing private label competition and consumer that is inclined to look for cheaper products • Raw materials price evolution (suger, wheat, edible oils, chocolate…) Recommendation: Strong market positions in its niche markets and massive investments in branding allow protecting against margin erosion. Moreover, we the company is focusing on its best performing products (predominantly caramelised biscuits, next to waffles, gingerbread etc.) and its recently expanded production capacity will pay off. This comes at a price, though. At present Lotus Bakeries is trading at rather rich earnings and EBITDA multiples that are above the median of multiples of small & mid cap food & beverage sector peers. We however think that it is warranted given the track-record, strong growth and underlying operational performance. However, at the present level the stock seems fairly valued (viz. our DCF-based EUR 820 TP) and therefore we reiterate our Hold recommendation. Target Price: EUR 820.00 titre 850 800 750 700 LOTUS BAKERIES SMALL & MID CAPS SELECTION Analyst(s) 650 600 550 500 450 Hans D'Haese 400 350 300 Mar 11 Jun 11 Sep 11 Dec 11 Mar 12 Jun 12 Sep 12 Dec 12 Mar 13 Jun 13 Sep 13 Dec 13 Mar 14 +32 (0) 2 287 9223 Bank Degroof [email protected] Jun 14 Source : Factset 125 Luxembourg SMALL & MID CAPS SELECTION EUR 32.40 Hold LUXEMPART LUXP.LU/LXMP LX Market capitalisation: EUR 776m Financial Services PROFIT & LOSS (EURm) Revenues Non Recurrent Items Net Profit (reported) BALANCE SHEET (EURm) Shareholders Equity Minorities equity Net Debt NAV Constituents & Total NAV (EURm) Core portfolio PE & unquoted Other assets Net cash/(debt) position Total Net Asset Value Discount/(Premium) to NAV Listed shareholdings on NAV OTHER ITEMS (EURm) Total Market Cap Debt / Equity Payout Ratio P/BV Dividend Yield (Gross) PER SHARE DATA (EUR) EPS (reported) NAVPS BVPS DPS 2011 22.9 -4.7 43.3 2012 24.7 -1.8 28.3 2013 31.6 60.3 92.6 2014e 832.5 20.4 -163.6 864.0 2.5 -229.1 971.6 7.5 256.1 554.0 73.0 74.6 159.0 860.6 -36.5% 61.7% 528.0 129.0 25.8 200.0 882.8 -32.4% 63.1% 493.0 149.0 64.2 331.0 1,037.2 -35.8% 62.0% 526.8 146.3 109.3 333.2 1,115.6 -30.4% 51.2% 546.7 -19.7% 41.7% 0.7 3.3% 597.0 -26.5% 67.1% 0.7 3.3% 665.5 26.4% 23.0% 0.7 2.8% 776.1 1.800 35.950 34.751 0.750 1.230 36.880 36.067 0.825 3.940 43.330 40.558 0.908 3.0% 46.571 0.980 Source: Company, Bank Degroof estimates Main shareholders: Foyer Finance (43.6%), Banque International à Luxembourg (10.0%), Sofina (5.3%), Treasury shares (4.2%) FINANCIAL CALENDAR (Source: Precise) PRICE (SHORT & LONG AVERAGE) titre 34 32 30 28 26 24 22 Profile: Luxempart (LXMP) is a Luxembourg based financial holding company, managing a portfolio of stakes in both quoted and non-quoted companies. LXMP undertakes its activities as a professional shareholder in two distinct manners: (1) through supportive investments managed by a team geared towards creating long-term value and generating recurring revenue (“Strategic portfolio”: Direct Energy, Foyer, SES, RTL Group, Atenor Group), (2) through the private equity business entrusted to a team geared towards realising medium-term exit capital gains (“Private equity”: direct stakes and venture capital, indirectly through ICP SICAR and LCP SICAR and through VC funds). SWOT Analysis Strengths • Financially involved management with strong network and over 20 years of experience • Historical gross IRR of 16% (Luxempart calculations) since its IPO in 1992 • Good exit track record of several larger participations and historical dividend growth • Fiscal optimisation: Luxempart and Indufin SICAR structures for venture investments Opportunities • Investment capacity: financial means of over EUR 300m ready for investments • Favourable tax status for holding companies: No capital gains taxes in Luxembourg • Hidden value in the private equity portfolio and new PE partnerships in France, Italy and Germany • Acquisition of a new high dividend payer as a source of cash earnings for future LXMP dividends Weaknesses • Limited visibility on operational performance of private equity participations • Uncertainty about allocation of tash position (reinvestment risk for 21% of NAV). • Limited international scope: maily Luxembourg, next to Belgium, France, Germany and Italy • Low portfolio turnover. Some participations are staying in the portfolio for over a decade Threats • Vulnerable to changes in stock market sentiment and impact holding company discount to NAV volatility • Divestments are negatively impacting cash earnings. Future dividend payout could be dependent on capital •gains. Cash drag on return. Proceeds from cash have a negative impact on ROE. Recommendation: LXMP has a very defensive profile thanks to its ample cash position (30% of NAV), while the stock prices of its main stakes should withstand potential economic headwinds: SES (30% of Gross Asset Value) is a stable cash flow company with attractive growth, Foyer Finance (17% of GAV), mainly consists in Foyer shares (cheaply valued insurance and asset management company) & LXMP treasury shares, and RTL Group (6% of GAV), seems to have an increased cash return potential thanks to FCF generation. Because of the reduction of the stake, however, we have reviewed LXMP’s cash earnings downwards. Our EUR 33 TP is based on ESN Research target prices for underlying assets and discount to NAV mean reverting. It leaves enough upside potential to warrant an Accumulate recommendation. 20 18 Mar 11 Jun 11 Sep 11 Dec 11 Mar 12 Jun 12 Sep 12 Dec 12 Mar 13 Jun 13 Sep 13 Dec 13 Mar 14 Jun 14 Source : Factset Target Price: EUR 33.00 Analyst(s) Hans D'Haese 126 Bank Degroof +32 (0) 2 287 9223 [email protected] France SMALL & MID CAPS SELECTION EUR 14.22 Hold M6-METROPOLE TELEVISION MMTP.PA/MMT FP Market capitalisation: EUR 1791m Media EUR Sales (m) EBITDA (m) EBITDA margin EBIT (m) EBIT margin Net profit (reported) (m) Net profit (adj.) (m) Cash Flow from Ops.bef. chg in NWC (m) Net debt (Cash) (m) Net Debt/Equity Net Debt/EBITDA Interest cover (EBITDA/Fin. interest) ROCE (adj.) ROCE (adj.)/WACC EV / CE EV / Sales EV / EBITDA EV / EBIT P/E (adj.) P/BV OpFCF yield Dividend yield EPS (adj.) EPS (adj.) growth BVPS DPS Abs. Performances(12m,6m,3m,1m): 12 month High/low: EUR18.04 / 11.40 12/12 1,387 329 23.8% 206 14.8% 140 132 229 -299 -0.4 -0.9 nm 29.2% 2.8 2.8 0.9 3.7 5.9 11.3 2.2 8.3% 15.7% 1.05 -11.9% 5.42 1.85 18.2% 12/13 12/14e 12/15e 1,265 1,270 1,309 325 306 304 25.7% 24.1% 23.2% 211 192 190 16.7% 15.1% 14.5% 112 114 113 98.8 114 113 246 228 227 -261 -265 -270 -0.5 -0.5 -0.5 -0.8 -0.9 -0.9 nm nm nm 39.9% 32.7% 32.3% 3.8 3.1 3.1 5.6 4.2 4.2 1.5 1.2 1.2 5.7 5.0 5.0 8.7 8.0 8.0 21.2 15.7 15.8 3.7 3.1 3.1 9.0% 6.2% 6.2% 6.0% 6.0% 6.0% 0.78 0.91 0.90 -25.0% 15.7% -0.9% 4.54 4.60 4.66 0.85 0.85 0.85 -11.1% -15.4% -7.8% Avg. Daily nb traded shares:207,260 Main shareholders: RTL Group 48.4% (34.0%); Free float 44.3% (58.7%); CNP-A.FrŠre 7.3%; All share prices at 20/05/14. Profile: M6 was the No. 2 TV channel in France for women under 50 in 2013 (audience share of 16.2% vs 25.2% for TF1). 2014 est. group sales can be broken down as follows: 50% advertising on the M6 channel, 35% diversified businesses and broadcasting rights, 15% digital channels, free or pay channels (W9, 6ter, TF6, Série Club, Paris Première, Teva, etc.). Diversified businesses include home shopping, football (Girondins), publishing (CDs, DVDs, etc.), the M6 mobile licence, broadcasting rights and Internet revenues. SWOT Analysis Strengths • Real skills in cost management and programming • Creativity in programming and formats (Capital, L'Amour est dans le Pre, Top Chef) • Capacity to create rapidly profitable businesses (M6 mobile by Orange, W9) • Commercial innovations: flash sales of ad slots, W9 and 6ter simultaneous ad screens Opportunities • Gain TV ad market shares • Make 6ter profitable through a full operating and advertising integration Weaknesses • Limited resources compared with TF1 (programming costs of EUR347m in 2012 vs EUR936m for TF1) • Lack of cost cutting potentail • Limited acquisition opportunities • Failure in some diversifications (e-commerce, Girondins football club) Threats • Very crowded competition in free-to-air, ongoing fragmentation of TV audiences • Arrival of Canal+ in free-to-air TV, with a potential budget of more than EUR100m (30% of M6 channel, x2 vs W9) Recommendation: At 8.4x EBIT 14e and a dividend yield of 5.4%, M6’s multiples look attractive in the European TV sector. Our SOP stands at EUR16. However, we fear that hopes of a mild recovery in M6 channel ad revenues (+1% in our estimates) could fade later in the year, as the French TV market remains deflationary (weak economic environment and new entrants in the free-to-air TV market) and M6 channel audience shares are eroding. The diversification strategy is less convincing, following the disposal of loss making Mister Good Deal at a slightly negative EV. Girondins are structurally loss making. We believe that TF1 has better dynamics: cost cutting, full integration of TMC/NT1 in 2015, disposal of Eurosport at a high price, more powerful multimedia ad selling, and better performances of small FTA channels. Target Price: EUR 16.00 FINANCIAL CALENDAR (Source: Precise) PRICE (SHORT & LONG AVERAGE) titre 19.0 22/05/14 Dividend Payment 18.0 17.0 16.0 15.0 2013 M6-MÉTROPOLE TÉLÉVISION SMALL & MID CAPS SELECTION Analyst(s) CM - CIC Securities Eric Ravary Emmanuel Chevalier 14.0 13.0 12.0 11.0 +33 1 45 96 79 53 +33 1 45 96 77 42 [email protected] [email protected] 10.0 9.0 Mar 11 Jun 11 Sep 11 Dec 11 Mar 12 Jun 12 Sep 12 Dec 12 Mar 13 Jun 13 Sep 13 Dec 13 Mar 14 Jun 14 Source : Factset 127 Italy SMALL & MID CAPS SELECTION EUR 2.32 Accumulate MAIRE TECNIMONT MTCM.MI/MT IM Market capitalisation: EUR 712m Materials, Construction & Infrastructure EUR Sales (m) EBITDA (m) EBITDA margin EBIT (m) EBIT margin Net profit (reported) (m) Net profit (adj.) (m) Cash Flow from Ops.bef. chg in NWC (m) Net debt (Cash) (m) Net Debt/Equity Net Debt/EBITDA Interest cover (EBITDA/Fin. interest) ROCE (adj.) ROCE (adj.)/WACC EV / CE EV / Sales EV / EBITDA EV / EBIT P/E (adj.) P/BV OpFCF yield Dividend yield EPS (adj.) EPS (adj.) growth BVPS DPS Abs. Performances(12m,6m,3m,1m): 12 month High/low: EUR2.87 / .59 12/12 2,187 -159 nm -187 nm -208 -208 -180 226 -1.9 -1.4 nm -781% nm nm 0.3 nm nm nm nm -59.2% 0.0% -0.64 +chg -0.38 0.00 43.2% 12/13 12/14e 12/15e 1,656 1,766 1,982 116 118 139 7.0% 6.7% 7.0% 90.1 98.6 116 5.4% 5.6% 5.8% 17.1 41.5 56.9 17.0 41.5 56.9 43.6 61.4 80.9 305 173 79.1 nm 2.2 0.6 2.6 1.5 0.6 2.9 3.3 4.6 19.5% -43.6% -147% 2.0 -4.5 2.6 2.9 3.0 0.5 0.5 0.4 6.9 7.5 5.7 8.9 9.0 6.9 29.4 17.2 12.6 14.9 9.5 5.4 -57.9% 6.0% 12.9% 0.0% 0.0% 0.0% 0.06 0.14 0.18 +chg 143.9% 36.6% 0.11 0.24 0.43 0.00 0.00 0.00 54.8% 36.7% -3.3% Avg. Daily nb traded shares:1,907,237 Main shareholders: GLV capital 55.0%; Free float 35.0%; Ardeco 10.0%; All share prices at 19/05/14. FINANCIAL CALENDAR (Source: Precise) PRICE (SHORT & LONG AVERAGE) titre 4.5 4.0 3.5 Profile: Maire Tecnimont is an engineering and contracting group operating worldwide in the oil, gas & petrochemicals, power, infrastructure sectors. The company has key competitive advantages in the chemical and petrochemical sector (world leader in the construction of plants using technologies licensed by Basell), in the fertilizer plant business (Stamicarbon is a global leader in urea licenses) and in gas treatment. Maire Tecnimont’s main shareholder is Fabrizio Di Amato, who also founded the company. SWOT Analysis Strengths • competitive advantages in the chemical and petrochemical sector • global leadership in the Urea Licenses market Weaknesses • no off-shore operations that have higher margins • the company is small size compared to most of its peers • Skills in managing projects in gas production Opportunities • fertilizer plant business Threats • still high debt • infrastructures and facilities for gas • change in strategy could not be easy In 2011 and 2012 the group experienced a period of financial distress. As of mid-2011, exceptional events in the Power business unit in South America negatively affected the company’s results, requiring a significant amount of liquidity that contributed to the deterioration of the net financial position. The net financial position worsened by EUR 442.2m to EUR 226.2m at the end of 2012 from a net cash of EUR 216m at the end of 2010. As a result the company launched a financial strengthening plan for around EUR 500m in April. This plan included: EUR 50m new financing; EUR 307m debt rescheduling (expiration 31/12/2017 grace period until 31/12/2014); EUR 150m capital increase. The capital increase was finalized at the end of July. At the beginning of June Ardeco bought a 5% stake in Maire for EUR 15m after a reserved capital increase. After a reverse stock split (ratio 10:1) Maire Tecnimont finalized a EUR 135m capital increase at EUR 0.50/sh. The company aims at selling non-core assets for around EUR 300m in the 2013-2016 period. In June 2013 the company announced the disposal of its stake in the COCIV consortium for EUR 50m and the sale of its stake in the CMT consortium (Copenhagen subway) for EUR 15m. The company is now going to sell the “Biolevano” power plant; the sale price is expected to be worth around EUR 70/80m The company’s new strategy is aimed at focusing on low-risk high margin technology driven business and engineering services; the company is going to pursue a greater selectivity of projects with focus on value (versus volumes) and reduced construction risk. This strategy is expected to structurally reduce the company’s risk without negatively affecting its margins which, on the contrary, are expected to improve in the next few years. Recommendation: our EUR 3.0/sh target price takes into account the improvements expected in the next few years both as regards profitability and as regards the decrease in net debt. 3.0 Target Price: EUR 3.00 2.5 2.0 Analyst(s) 1.5 1.0 0.5 Mar 11 Source : Factset 128 Jun 11 Sep 11 Dec 11 Mar 12 Jun 12 Sep 12 Dec 12 Mar 13 Jun 13 Sep 13 Dec 13 Mar 14 Jun 14 Francesco Sala Banca Akros +39 02 4344 4240 [email protected] France SMALL & MID CAPS SELECTION EUR 12.38 Buy MANITOU MANP.PA/MTU FP Market capitalisation: EUR 490m Industrial Engineering EUR Sales (m) EBITDA (m) EBITDA margin EBIT (m) EBIT margin Net profit (reported) (m) Net profit (adj.) (m) Cash Flow from Ops.bef. chg in NWC (m) Net debt (Cash) (m) Net Debt/Equity Net Debt/EBITDA Interest cover (EBITDA/Fin. interest) ROCE (adj.) ROCE (adj.)/WACC EV / CE EV / Sales EV / EBITDA EV / EBIT P/E (adj.) P/BV OpFCF yield Dividend yield EPS (adj.) EPS (adj.) growth BVPS DPS Abs. Performances(12m,6m,3m,1m): 12 month High/low: EUR14.55 / 9.42 12/12 1,265 75.1 5.9% 45.5 3.6% 44.9 44.9 37.7 121 0.3 1.6 7.5 5.3% 0.6 1.1 0.5 8.2 13.5 11.4 1.2 -5.5% 3.6% 1.14 23.4% 10.59 0.45 8.9% 12/13e 1,176 50.9 4.3% 20.7 1.8% 6.7 6.7 30.9 84.8 0.2 1.7 6.7 2.5% 0.3 1.1 0.5 12.0 29.4 nm 1.3 6.7% 0.1% 0.17 -85.1% 10.62 0.01 -12.2% 12/14e 12/15e 1,234 1,284 90.2 103 7.3% 8.0% 59.3 71.2 4.8% 5.6% 35.5 42.7 35.5 42.7 65.3 73.3 70.7 30.1 0.2 0.1 0.8 0.3 18.0 20.6 7.0% 8.5% 0.8 1.0 1.0 0.9 0.4 0.4 6.0 4.8 9.0 6.9 13.8 11.5 1.1 1.0 4.7% 10.5% 1.8% 2.2% 0.90 1.08 nm 20.4% 11.29 12.10 0.22 0.27 -5.0% 1.4% Avg. Daily nb traded shares:3,794 Main shareholders: Founders 65.4% (65.8%); Free float 31.0% (31.3%); Toyota 2.8% (2.9%); Treasury Shares 0.8% (0.0%); All share prices at 20/05/14. FINANCIAL CALENDAR (Source: Precise) PRICE (SHORT & LONG AVERAGE) Profile: World leader in forklift trucks (market share close to 40%). It is present on three segments: construction (3/8 of sales), agriculture (3/8 of sales) and industry (2/8 of sales). In addition to its traditional models, Manitou now sells chargers, industrial loaders and aerial work platforms. With the acquisition of Gehl at end-2008, Manitou has prospects for large-scale expansion on the leading global market: the US. SWOT Analysis Strengths • 40% market share in Europe Weaknesses • A very cyclical activity • Loyal distribution network. Possibility of extension thanks to Gehl and Yanmar. • Heightened competitiveness for several years, which weighs on margin trends. Return to 12% operating margin therefore unlikely. Opportunities • Manitou has survived to become a stock with strong economic and stock market leverage • Growth set to be strong until 2015, after a decrease in H1 2013 Threats • Bond market crash would have an impact on already weakened clients • Final markets still ill and fragile Recommendation: There was a first severe downturn in the construction sector with public works, ending mid-2010. Investment by industrial players is undergoing a correction on a scale not seen for the past 20 years. The agricultural sector has been unable to put in a satisfactory performance due to farmers adopting a wait-and-see stance, but the recovery phase began for these three divisions in Q3-2010. The company has confirmed that it will boost its production capacity by 25-30% p.a. over several years. As a result, Manitou could, in 2014 or 2015, see pro-forma sales return to the previous cycle peak of EUR1.5bn. The market’s recent reaction evidenced that Manitou’s outlook for 2014 and 2015 is not priced in. If we assume that the cycle in 2014 and 2015 will be higher than the previous one, we can decide to play on multi-year growth for the company. Moreover, we feel that the level of risk is much more acceptable than it has been over the past four years. Target Price: EUR 16.50 titre 26 24 22 MANITOU SMALL & MID CAPS SELECTION Analyst(s) 20 18 16 14 12 Christian Auzanneau 10 8 Mar 11 Jun 11 Sep 11 Dec 11 Mar 12 Jun 12 Sep 12 Dec 12 Mar 13 Jun 13 Sep 13 Dec 13 Mar 14 +33 4 78 92 01 85 CM - CIC Securities [email protected] Jun 14 Source : Factset 129 Italy SMALL & MID CAPS SELECTION EUR 13.60 Hold MARR MARR.MI/MARR IM Market capitalisation: EUR 905m Food & Drug Retailers EUR Sales (m) EBITDA (m) EBITDA margin EBIT (m) EBIT margin Net profit (reported) (m) Net profit (adj.) (m) Cash Flow from Ops.bef. chg in NWC (m) Net debt (Cash) (m) Net Debt/Equity Net Debt/EBITDA Interest cover (EBITDA/Fin. interest) ROCE (adj.) ROCE (adj.)/WACC EV / CE EV / Sales EV / EBITDA EV / EBIT P/E (adj.) P/BV OpFCF yield Dividend yield EPS (adj.) EPS (adj.) growth BVPS DPS Abs. Performances(12m,6m,3m,1m): 12 month High/low: EUR14.38 / 9.08 12/12 1,260 90.3 7.2% 77.1 6.1% 49.0 49.0 62.2 165 0.7 1.8 16.1 13.0% 1.8 1.8 0.6 7.8 9.1 10.6 2.2 8.4% 7.3% 0.74 0.0% 3.53 0.58 38.5% 12/13 12/14e 12/15e 1,365 1,429 1,471 94.9 100 106 7.0% 7.0% 7.2% 80.0 84.4 90.2 5.9% 5.9% 6.1% 47.6 51.0 54.0 47.6 51.0 54.0 62.5 66.6 69.6 194 193 172 0.8 0.8 0.6 2.0 1.9 1.6 11.3 14.1 12.6 12.2% 12.4% 13.3% 1.7 1.8 1.9 2.3 2.5 2.4 0.7 0.8 0.7 10.6 11.1 10.2 12.6 13.1 12.0 16.8 17.5 16.6 3.3 3.5 3.4 2.0% 4.8% 7.1% 4.2% 4.4% 4.5% 0.72 0.77 0.82 -3.4% 7.8% 5.8% 3.67 3.84 4.05 0.58 0.60 0.61 14.7% 3.4% -1.2% Avg. Daily nb traded shares:88,155 Main shareholders: Cremonini S.p.a. 50.6%; Free float 49.4%; All share prices at 19/05/14. FINANCIAL CALENDAR (Source: Precise) PRICE (SHORT & LONG AVERAGE) titre 15 04/08/14 Results 14 13 12 2014H1 Profile: MARR markets and distributes about 18,000 stock keeping units (10,000 food and 8,000 non food) to approximately 38,000 clients. With around 30 distribution centres across Italy and 4 Cash & Carry stores, it is the only truly national operator of the Italian foodservice distribution industry. Its reference market is worth around EUR 11.0bn. MARR has around 10% market share of the wholesale market. MARR’s most important client segment is the street market (i.e restaurants and hotels) with around 61% of total sales. MARR focuses entirely on the Italian market. SWOT Analysis Strengths • Domestic market leadership: it reached 13% in terms of value (Wholesalers food supply to Italian Foodservice est. of EUR 11bn) and over 25% inthe terms of clients served • Capability to outperform reference market Weaknesses • Reference market growing between 0.5% - 2.0% in volumes • Management with historical track record of excellent execution Opportunities • Consolidation of a very fragmented market Threats • No acquisitions at reasonable multiples • Deeper commercial presence on existing clients • Potential effects of historical high product innovation Recommendation: Marr reported Q1 2014 sales at EUR 290.1m, up by 9.0% Y/Y and a touch better than expected. Q1 2014 sales of the Street Market and National Account were at EUR 230.9m up 7.6% Y/Y: organic growth was +5.2%, while growth due to acquisition was of +2.4%. In the Street Market and National Account price mix was +1.5% (prices now recovering in some seafood products), while volume growth was +6.1% (where grocery had the largest increase with a growth of 7.9%, vs. meat +4.7% and seafood +0.0%).Q1 2014 sales to clients in the Wholesale category were at EUR 55.5m up 15.0% Y/Y (due to a benign winter fishing campaign) and better than expected. Q1 2014 EBITDA reached EUR 13.4m (+11.8% Y/Y) and was better than our estimates of EUR 12.8m: Q1 2014 COGS on sales were at 78.3% decreasing by 20bps vs. Q1 2013; Q1 2014 EBIT of EUR 10.2m (+10.0% Y/Y) was ahead of our forecasts. Q1 2014 Net financial interests were at EUR -2.1m vs. EUR 1.7m in Q1 2013.Q1 2014 trade NWC was at EUR 249.5m (higher than expected) vs. EUR 226.6m in FY 2013. Q1 2014 Net debt was of EUR 206.6m vs. Q1 2013 level of EUR 184.9m. Q1 2014 numbers were solid, and management said that sales to the Street Market & National accounts were positive also thanks to benign trend during Easter period. Our DCF-based Target Price is at EUR 14.30 per share. Hold. 11 10 Target Price: EUR 14.30 9 8 7 6 Mar 11 Source : Factset Jun 11 Sep 11 Dec 11 Mar 12 Jun 12 Sep 12 Dec 12 Mar 13 Jun 13 Sep 13 Dec 13 Mar 14 Jun 14 MARR SMALL & MID CAPS SELECTION Analyst(s) Claudio Giacomiello, CFA 130 +39 02 4344 4269 Banca Akros [email protected] France SMALL & MID CAPS SELECTION EUR 12.35 Accumulate MAUREL ET PROM MAUP.PA/MAU FP Market capitalisation: EUR 1497m Oil & Gas Producers EUR Sales (m) EBITDA (m) EBITDA margin EBIT (m) EBIT margin Net profit (reported) (m) Net profit (adj.) (m) Cash Flow from Ops.bef. chg in NWC (m) Net debt (Cash) (m) Net Debt/Equity Net Debt/EBITDA Interest cover (EBITDA/Fin. interest) ROCE (adj.) ROCE (adj.)/WACC EV / CE EV / Sales EV / EBITDA EV / EBIT P/E (adj.) P/BV OpFCF yield Dividend yield EPS (adj.) EPS (adj.) growth BVPS DPS Abs. Performances(12m,6m,3m,1m): 12 month High/low: EUR13.46 / 10.93 12/12 461 335 72.8% 212 46.1% 98.6 98.6 186 354 0.4 1.1 9.5 7.8% 0.1 1.5 3.9 5.3 8.4 15.6 1.8 3.2% 2.2% 0.81 -40.1% 6.88 0.27 -7.6% 12/13e 12/14e 12/15e 589 618 582 483 508 477 81.9% 82.1% 81.8% 341 364 343 57.9% 58.8% 58.8% 150 163 157 150 163 157 253 266 246 296 245 224 0.3 0.2 0.2 0.6 0.5 0.5 13.6 14.3 13.4 12.0% 12.4% 11.1% 0.4 0.4 0.5 1.3 1.2 1.1 2.8 2.6 2.7 3.4 3.2 3.3 4.8 4.4 4.6 9.8 9.2 9.6 1.5 1.4 1.3 6.2% 6.7% 5.0% 3.4% 3.6% 3.5% 1.24 1.35 1.29 52.6% 8.4% -3.9% 7.85 8.78 9.62 0.41 0.45 0.43 5.8% 4.0% 0.4% Avg. Daily nb traded shares:163,698 Main shareholders: Free float 64.0%; Pacifico (JF Henin) 24.6%; MACIF 6.7%; Halisol 3.3%; Financiere de Rosario 1.5%; All share prices at 20/05/14. FINANCIAL CALENDAR (Source: Precise) PRICE (SHORT & LONG AVERAGE) Profile: Maurel et Prom is an independent oil exploration and production company listed in Paris. In 2009, M&P refocused on production activities to generate solid cash flow. As a counterpart to this, the group reduced its exposure to exploration risk. Operations are therefore now focused on developing the group in Gabon and on increasing its production, as well as on actions aimed at fully or partially disengaging from risky assets or assets that demand heavy financial resources. In 2013, production in Gabon increased sharply to an average of 19,580 b/d (+19%) and ended the year near 25 kb/d. M&P’s production will continue to grow significantly in 2014 and for Gabon the group is aiming for over 35kb/d by year-end, which should lead to positive free cash flow for 2014. The group is finalising negotiations of a gas sale contract to monetise its Mnazi-Bay gas resources in Tanzania. Exploration investments are more limited in 2014 and will partially be borne by M&P’s partners (Colombia and Peru). Maurel et Prom has participations in exploration assets in Tanzania, Mozambique, Namibia and Latin America. Along with MPI (2/3), Maurel et Prom (1/3) has embarked on investments in new, promising areas: Myanmar (offshore gas) and Canada (tight light oil in the east and oil sands in the west). SWOT Analysis STRENGTHS Solid reserve/resources base in Gabon (195mboe 2P) Tanzania (52mboe) and Colombia Light structure helping move rapidly and exploiting opportunities Carried exploration costs in Colombia and Peru OPPORTUNITIES Exploration in high risk/high reward areas (e.g. Offshore Namibia) Monetise gas assets in Tanzania that could rapidly increase M&P’s sales and cash flow WEAKNESSES Limited access to bank financing Imposed financing through issues of two OCEANEs expiring in 2014 and 2015 Limited technical capacities THREATS Fall in oil prices Lack of exploration success Failure to fix well productivity issues in Gabon limiting potential growth Recommendation: The group’s proven reserves were sharply revised upwards to around 142mboe at end2013 vs EUR54mboe at end-2012 due to the signing of a new production sharing contract in Gabon. This new PSC enhances the visibility and attractiveness of M&P’s reserves and production profile, enabling the company to form new alliances. Moreover, M&P’s JV with MPI Energy has allowed the group to expand its exploration interests to Myanmar (offshore and Canada (unconventional resources), opening up opportunities for longer term growth. Our total valuation of EUR14.9/share offers only a modest upside. Target Price: EUR 14.90 titre 19.0 05/08/14 Trading Update 18.0 2014Q2 17.0 16.0 15.0 14.0 13.0 12.0 11.0 10.0 Mar 11 Jun 11 Sep 11 Dec 11 Mar 12 Jun 12 Sep 12 Dec 12 Mar 13 Jun 13 Sep 13 Dec 13 Mar 14 MAUREL ET PROM SMALL & MID CAPS SELECTION Analyst(s) CM - CIC Securities Jean-Luc Romain [email protected] +33 1 45 96 77 36 Jun 14 Source : Factset 131 Spain SMALL & MID CAPS SELECTION EUR 9.20 MELIA HOTELS INTERNATIONAL MEL.MC/MEL SM Market capitalisation: EUR 1699m Accumulate Hotels, Travel & Tourism EUR Sales (m) EBITDA (m) EBITDA margin EBIT (m) EBIT margin Net profit (reported) (m) Net profit (adj.) (m) Cash Flow from Ops.bef. chg in NWC (m) Net debt (Cash) (m) Net Debt/Equity Net Debt/EBITDA Interest cover (EBITDA/Fin. interest) ROCE (adj.) ROCE (adj.)/WACC EV / CE EV / Sales EV / EBITDA EV / EBIT P/E (adj.) P/BV OpFCF yield Dividend yield EPS (adj.) EPS (adj.) growth BVPS DPS Abs. Performances(12m,6m,3m,1m): 12 month High/low: EUR9.93 / 5.32 12/12 1,505 417 27.7% 327 21.7% 200 45.1 125 1,003 0.9 2.4 6.3 13.1% 1.7 1.0 1.4 4.9 6.2 23.7 1.0 1.4% 0.7% 0.24 12.3% 5.80 0.04 66.1% 12/13 12/14e 12/15e 1,352 1,494 1,656 242 278 305 17.9% 18.6% 18.4% 178 186 211 13.1% 12.5% 12.8% -73.2 66.1 103 -37.9 69.3 104 20.1 161 199 1,158 844 756 1.0 0.6 0.5 4.8 3.0 2.5 3.2 3.7 5.0 7.9% 8.5% 9.6% 1.0 1.1 1.3 1.5 1.3 1.3 2.1 1.7 1.5 11.7 9.0 7.9 15.9 13.4 11.4 nm 24.5 16.4 1.6 1.3 1.3 -3.4% 3.8% 4.5% 0.4% 0.8% 1.2% -0.21 0.38 0.56 -chg +chg 49.8% 5.95 6.84 7.33 0.04 0.07 0.11 11.6% -1.9% 4.1% Avg. Daily nb traded shares:723,915 Main shareholders: Familia Escarrer 64.6%; Free float 35.4%; All share prices at 19/05/14. PRICE (SHORT & LONG AVERAGE) titre 11 10 FINANCIAL CALENDAR (Source: Company) 04/06/14 AGM Profile: Meliá is the leading Spanish hotel chain, 3rd European and 19th internationally. It currently counts on a total of 305 hotels and 78.515 rooms distributed in 4 continents and 30 cities of which 57% are under management, 20% leased and the remaining 23% owned. According to a geographic breakdown: Spain 45% of the total rooms, 28% America, 24% rest of Europe and 3% Asia. By category 52% of the rooms are midscale (brands Tryp and Sol Hotels) while the remaining 48% are upscale & premium (brands Gran Melia, Paradisus, ME or Innside). Hotel revenues account for the 85% of the total, but Melia has three more business lines: real estate (whre capital gains are recurrently registered), Club Melia (each accounting 4.7% total) and overheads the remaining 5.6%. Melia’s strategy is focused on expanding through an “asset light” model based on management, mainly upscale and within high potential growth markets. In this regard recent signatures have been Bahamas, Jamaica, Mongolia, Manhattan, Morocco and Milan. Regarding the financial situation, Melia closed 1Q14 with EUR 1.242m of net debt and pursues: 1) extending 2014 maturities (EUR 139m excluding the convertible bond). 2) Better balance 50/50% between banking debt and capital markets, 3) Increasing dollar exposure as natural hedge with the dollar denominated revenues (America’s division accounts for 33% revenues and 56% EBIT) and 4) further streamlining (debt reduction of at least EUR0.25bn). In this regard there is no relevant expansion capex 2014-15 and asset rotation will continue (at least EUR 125m/year). Jones Lang LaSalle valuation assigns a gross value of EUR3.1bn to the owned assets. For 2014e: revpar +7.3% (guidance mid-high single digit growth) and hotel EBITDA > 10%. SWOT Analysis Strengths • Spanish leader hotel chain • Worldwide leader in resort segment • High exposure to management regime • Attractive pipeline (60 hotels and 17.000 rooms) Weaknesses • Difficult macro situation in feeder countries • Potential dilution due to convertible bonds • Slowdown in cutting debt Opportunities • Expected recovery of domestic demand • Asset rotation possibilities • Increasing exposure to direct channels • Successful loyalty programme Threats • Dependant on Spain (14% EBITDA) • High dollar exposure (51% EBITDA) • Venezuelan currency devaluation (8% EBIT) Recommendation: Accumulate given the positive stance for the tourism industry in Spain and the good prospects for America, EMEA’s and ME segments for the year. On the negative we expect a capital increase during the year due to the cancellation of the convertible bond by December 2014. Target Price: EUR 11.85 9 8 7 Analyst(s) 6 Sonia Ruiz De Garibay 5 4 3 Mar 11 Source : Factset 132 Jun 11 Sep 11 Dec 11 Mar 12 Jun 12 Sep 12 Dec 12 Mar 13 Jun 13 Sep 13 Dec 13 Mar 14 Jun 14 BEKA Finance +34 91 436 7841 [email protected] Finland SMALL & MID CAPS SELECTION EUR 3.39 Accumulate METSÄ BOARD METSB.HE/METSA FH Market capitalisation: EUR 1112m Basic Resources EUR Sales (m) EBITDA (m) EBITDA margin EBIT (m) EBIT margin Net profit (reported) (m) Net profit (adj.) (m) Cash Flow from Ops.bef. chg in NWC (m) Net debt (Cash) (m) Net Debt/Equity Net Debt/EBITDA Interest cover (EBITDA/Fin. interest) ROCE (adj.) ROCE (adj.)/WACC EV / CE EV / Sales EV / EBITDA EV / EBIT P/E (adj.) P/BV OpFCF yield Dividend yield EPS (adj.) EPS (adj.) growth BVPS DPS Abs. Performances(12m,6m,3m,1m): 12 month High/low: EUR3.48 / 2.37 12/12 19,059 1,618 8.5% 669 3.5% 380 380 1,329 6,926 0.9 4.3 4.1 3.7% 0.5 1.0 0.7 8.1 19.7 17.3 0.8 -0.4% 2.8% 1.16 nm 23.89 0.54 22.8% 12/13 12/14e 12/15e 18,258 18,637 20,173 1,572 2,219 2,509 8.6% 11.9% 12.4% 943 1,308 1,641 5.2% 7.0% 8.1% 496 663 907 496 663 907 1,126 1,574 1,774 7,161 6,530 6,004 0.9 0.8 0.7 4.6 2.9 2.4 3.1 4.8 6.0 5.1% 7.2% -3.1% 0.7 0.9 1.2 1.2 1.2 0.9 0.9 0.8 10.4 7.5 6.4 17.3 12.7 9.8 18.8 15.2 11.1 1.2 1.2 1.2 -2.6% 9.3% 8.8% 2.7% 2.9% 2.9% 1.51 2.02 2.76 30.7% 33.6% 36.7% 23.41 24.61 26.47 0.81 0.90 0.90 14.5% 11.9% 3.4% Avg. Daily nb traded shares:155,885 Main shareholders: Free float 100.0%; Metsäliitto Cooperative 38.8%; Varma Mutual Pension Insurance Company 4.3%; Ilmarinen Mutual Pension Insurance Company 2.0%; All share prices at 19/05/14. Profile: Metsä Board produces high-quality folding boxboard and kraftliner, mainly of virgin fibre. It is the largest producer of folding boxboard in Europe, with output accounting for about one-third of the total. In 2012, Metsä Board completed the investment programme to expand folding boxboard capacity by a total of 150,000 tonnes (+19%) to 935,000 tonnes. Metsä Board is some 250 thousand tonnes long in pulp on an annual basis. Metsä Board's only paper-making asset, the Husum Mill, is Europe’s largest integrated paper and pulp mill, producing uncoated and coated fine paper and bleached market pulp. SWOT Analysis Strengths • Expansion of packaging board markets at a rate of 3–5% Weaknesses • Consumer packaging production mostly in Finland • Extremely competitive production facilities in packaging boards • Profile transformation into a packaging company in the final stretch • Very sensitive to pulp prices Opportunities • Accelerating growth of the market for fibre-based packages thanks to emerging economies • Growing market share in virgin fibre packages Threats • Cost inflation • Faster sector consolidation in Europe • Declining trend demand in paper • Competitors investing further in packaging board production in Europe • Growth in Asian capacity and persistence of European overcapacity in fine paper Recommendation: Metsä Board’s strength is its consumer board operations, which will have even better earnings potential thanks to the investments being made. The segment's market outlook is strong and, in folding boxboard, there have been signs of a transition from recycled fibre products to virgin fibre products, favouring Metsä Board. All other things being equal, the higher relative portion of consumer packaging may in the long run raise the valuation multiples accepted for the company. Our target price is based on the median EV/EBITDA level of peer group. Target Price: EUR 3.80 FINANCIAL CALENDAR (Source: Precise) PRICE (SHORT & LONG AVERAGE) titre 3.5 METSÄ BOARD SMALL & MID CAPS SELECTION Analyst(s) 3.0 2.5 Henri Parkkinen 2.0 +358 10 252 4409 Pohjola [email protected] 1.5 1.0 Mar 11 Jun 11 Sep 11 Dec 11 Mar 12 Jun 12 Sep 12 Dec 12 Mar 13 Jun 13 Sep 13 Dec 13 Mar 14 Jun 14 Source : Factset 133 Germany SMALL & MID CAPS SELECTION EUR 4.90 Accumulate MLP MLPG.DE/MLP GR Market capitalisation: EUR 529m Financial Services EUR Sales (m) EBITDA (m) EBITDA margin EBIT (m) EBIT margin Net profit (reported) (m) Net profit (adj.) (m) Cash Flow from Ops.bef. chg in NWC (m) Net debt (Cash) (m) Net Debt/Equity Net Debt/EBITDA Interest cover (EBITDA/Fin. interest) ROCE (adj.) ROCE (adj.)/WACC EV / CE EV / Sales EV / EBITDA EV / EBIT P/E (adj.) P/BV OpFCF yield Dividend yield EPS (adj.) EPS (adj.) growth BVPS DPS Abs. Performances(12m,6m,3m,1m): 12 month High/low: EUR5.98 / 4.41 12/12 568 86.7 15.3% 74.1 13.0% 52.7 52.7 64.8 -40.7 -0.1 -0.5 nm 20.6% 1.9 2.4 0.9 6.0 7.0 10.2 1.4 3.5% 6.4% 0.49 74.7% 3.59 0.32 -8.8% 12/13p 12/14e 12/15e 501 546 567 44.6 67.5 76.4 8.9% 12.4% 13.5% 32.8 55.4 63.9 6.5% 10.1% 11.3% 25.5 39.5 45.7 25.5 39.5 45.7 37.3 51.7 58.2 -46.4 -68.0 -84.1 -0.1 -0.2 -0.2 -1.0 -1.0 -1.1 nm nm nm 8.7% 14.4% 16.5% 0.8 1.3 1.5 2.3 2.1 2.0 1.1 0.9 0.8 12.0 7.1 6.1 16.3 8.7 7.3 22.1 13.4 11.6 1.5 1.3 1.3 8.4% 6.9% 8.2% 3.3% 5.1% 6.1% 0.24 0.37 0.42 -51.6% 55.0% 15.7% 3.47 3.68 3.85 0.16 0.25 0.30 6.9% -6.8% 1.1% Avg. Daily nb traded shares:12,606 Profile: MLP is a financial services provider for academics and other highly educated individuals. The company integrates insurance and banking services into a financial concept tailored for each individual customer. MLP advises its clients in all issues concerning private cover and provisions and provides solutions by selecting from a diverse range of products and services offered by different banks, insurance companies and investment organisations. Furthermore, the company offers advice and solutions regarding financial investments, mortgages and business start-ups as well as wealth planning and management (through its subsidiary Feri). MLP is only active in Germany. Products related to long-term asset formation and retirement saving account for approximately 80% of total revenues. For 2014 we expect earnings to increase by 61% yoy due to higher revenues stemming from MLP’s traditional old-age provision/health insurance business and the built-up of the residential real estate brokerage business. Generally MLP should continue to suffer from the difficult market environment as people should continue to be reluctant to invest into old-age provision products (MLP’s key revenue source). SWOT Analysis Strengths • Highly cash flow generative business Weaknesses • High dependence on regulatory environment • Strong asset quality • Good market position in wealth management Opportunities • Rising demand for old-age provision products Threats • Market environment further deteriorates Main shareholders: Free float 47.6%; Lautenschläger 29.6%; HDI 9.9%; Barmenia 6.7%; Allianz 6.3%; All share prices at 19/05/14. Recommendation: On the back of MLP’s attractive valuation and the expected earnings improvement for 2014 we recommend buying the shares with a target price of EUR 6.30. FINANCIAL CALENDAR (Source: Precise) PRICE (SHORT & LONG AVERAGE) Target Price: EUR 6.30 titre 7.5 7.0 6.5 6.0 5.5 5.0 4.0 Mar 11 134 2013 06/06/14 Ex Dividend Date 2013 05/06/14 AGM 2013 MLP SMALL & MID CAPS SELECTION Analyst(s) Philipp Häßler, CFA 4.5 Source : Factset 06/06/14 Dividend Payment Jun 11 Sep 11 Dec 11 Mar 12 Jun 12 Sep 12 Dec 12 Mar 13 Jun 13 Sep 13 Dec 13 Mar 14 Jun 14 +49 69 58997 414 Equinet Bank [email protected] Belgium SMALL & MID CAPS SELECTION EUR 15.11 Reduce MOBISTAR MSTAR.BR/MOBB BB Market capitalisation: EUR 907m Telecommunications EUR Sales (m) EBITDA (m) EBITDA margin EBIT (m) EBIT margin Net profit (reported) (m) Net profit (adj.) (m) Cash Flow from Ops.bef. chg in NWC (m) Net debt (Cash) (m) Net Debt/Equity Net Debt/EBITDA Interest cover (EBITDA/Fin. interest) ROCE (adj.) ROCE (adj.)/WACC EV / CE EV / Sales EV / EBITDA EV / EBIT P/E (adj.) P/BV OpFCF yield Dividend yield EPS (adj.) EPS (adj.) growth BVPS DPS Abs. Performances(12m,6m,3m,1m): 12 month High/low: EUR18.55 / 10.25 12/12 1,703 494 29.0% 277 16.3% 186 186 410 394 1.1 0.8 46.2 24.0% 3.5 1.9 0.9 3.1 5.6 6.3 3.3 14.1% 9.3% 3.09 -15.9% 5.96 1.80 -18.6% 12/13 12/14e 12/15e 1,494 1,329 1,303 317 266 315 21.2% 20.1% 24.2% 129 51.5 99.7 8.6% 3.9% 7.7% 87.5 30.1 65.4 87.5 30.1 65.4 275 245 280 557 585 521 1.7 1.6 1.2 1.8 2.2 1.7 40.1 26.6 33.7 9.8% 3.7% 7.1% 1.4 0.5 1.0 1.4 1.5 1.4 0.9 1.1 1.1 4.3 5.6 4.5 10.7 28.7 14.2 9.5 30.2 13.9 2.5 2.5 2.1 -7.0% -3.1% 7.1% 0.0% 0.0% 3.3% 1.46 0.50 1.09 -52.9% -65.7% 117.5% 5.62 6.12 7.21 0.00 0.00 0.50 11.3% 8.6% 13.4% Avg. Daily nb traded shares:111,808 Main shareholders: France Telecom 52.9%; Free Float 47.1%; All share prices at 19/05/14. FINANCIAL CALENDAR (Source: Precise) PRICE (SHORT & LONG AVERAGE) titre 55 50 Profile: Mobistar is a subsidiary of the Orange group and Belgium's second mobile operator with an active client’s market share of around 30% after Belgacom, the incumbent operator. Offering mobile services from August 1996 on, the company also offers converged services for enterprises and is now working on a triple play retail fixed product by using the opening of the cable network (launch planned in the end of 2014). Mobistar's strategy is to consolidate its mobile position by rolling out a strong 4G network, to differentiate with services, to up customer service and to lead efficiency Next to this, Mobistar is also active as a mobile operator in Luxembourg and responsible for the business of mobile machine-to-machine communication of the Orange group (with the exception of France). SWOT Analysis Strengths • Strong balance sheet Weaknesses • Missing converged offers in retail • Profiting from belonging to the Orange group • Regulation hits mobile business the most • Small market limits newcomers • Mobile network not up to speed with the one of Belgacom • Low possibilities to offload mobile data to wifi • Ample room for cost cutting Opportunities • If successful, new fixed offering could level competitive playing field • Monetising increased mobile date usage with 4G Threats • Regulated cable opening can still be blocked by court • Cost cutting can protect margins • Competition could eliminate possibilities to monetise 4G • Fixed offering could be unsuccessful Recommendation: 1Q14 disappointed on client acquisitions but surprised us in the timing of its cost savings, leading to a better than expected EBITDA. Since this is only a timing effect, it does not change the case fundamentally. The share price has gone up because of speculative reasons, for which there are still many questions. Does Orange want to sel? (The operator declined the rumor that there was a divestment process started). If so, at what price? Are likely (cable) buyers ready to buy? Telenet or Voo are the most obvious buyers because they can generate most synergies, however they might prefer pure cable consolidation first and we believe that Altice needs to enlarge its fixed footprint in Belgium before being able to generate sufficient synergies. Hence, we stick to our operational Target Price of EUR 12.6 (based on DCF) and Reduce recommendation. 45 Target Price: EUR 12.60 40 35 30 25 Analyst(s) 20 15 10 Mar 11 Jun 11 Sep 11 Dec 11 Mar 12 Jun 12 Sep 12 Dec 12 Mar 13 Jun 13 Sep 13 Dec 13 Mar 14 Jun 14 Bart Jooris, CFA Bank Degroof +32 2 287 92 79 [email protected] Source : Factset 135 Portugal SMALL & MID CAPS SELECTION EUR 4.72 Rating Suspended MOTA ENGIL MOTA.LS/EGL PL Market capitalisation: EUR 966m Materials, Construction & Infrastructure EUR Sales (m) EBITDA (m) EBITDA margin EBIT (m) EBIT margin Net profit (reported) (m) Net profit (adj.) (m) Cash Flow from Ops.bef. chg in NWC (m) Net debt (Cash) (m) Net Debt/Equity Net Debt/EBITDA Interest cov er (EBITDA/Fin. interest) ROCE (adj.) ROCE (adj.)/WACC EV / CE EV / Sales EV / EBITDA EV / EBIT P/E (adj.) P/BV OpFCF y ield Div idend y ield EPS (adj.) EPS (adj.) grow th BVPS DPS Abs. Performances(12m,6m,3m,1m): 12 month High/low : EUR5.96 / 2.09 12/12 2,326 287 12.4% 171 7.4% 40.7 47.2 190 1,034 2.4 3.6 4.5 11.5% 1.4 1.0 0.4 3.6 6.1 6.4 0.9 15.2% 7.0% 0.24 69.8% 1.67 0.11 115.7% 12/13 12/14e 12/15e 2,375 2,608 2,902 363 376 426 15.3% 14.4% 14.7% 243 256 294 10.2% 9.8% 10.1% 50.5 75.5 94.8 60.0 75.2 95.2 208 243 280 1,136 964 929 2.0 1.7 1.4 3.1 2.6 2.2 4.5 6.3 7.2 14.3% 15.1% 16.6% 1.7 1.6 1.7 1.7 1.7 1.6 0.9 0.8 0.7 5.8 5.4 4.7 8.6 7.9 6.8 13.9 12.8 10.2 2.3 2.4 2.1 -2.0% 13.2% 9.5% 2.6% 4.1% 5.2% 0.31 0.37 0.46 27.1% 18.5% 26.5% 1.85 1.99 2.27 0.12 0.19 0.24 25.7% -4.3% -11.0% Av g. Daily nb traded shares:484,296 Main shareholders: FM - Soc. Cont. 56.4%; Free float 41.5%; Amber UK 2.1%; Profile: Mota-Engil is a construction company that has been diversifying its activities into fast growing markets in Sub-Saharan Africa and in Latam. Africa is Mota-Engil’s prevalent value driver, backed by its continuous revenue growth and, particularly, by the impressive EBITDA margins obtained. Latam is also proving to be a winning bet, albeit generating less value than Africa due to the lower margins generated. European activity is expected to show some stabilization from 2014 onwards. In Africa: (44% of 2013 Turnover, 67% of EBITDA and 79% of EBIT) The company is present in Angola, Mozambique, Malawi, Zambia and Ghana. Even though the bulk of local Turnover is generated by heavy construction activities, the company is diversifying its local activities into the concessions, mining, water and waste management sectors. The African Order Backlog amounted to EUR 1,620m at the end of 2013 (of a total EUR 3,870m reported). SWOT Analysis Strengths • Growth focused and geographically diversified • Market leader in Portugal • Ascendi stake (mostly highway concessions ) Weaknesses • Exposed to Portugal (difficult economic climate) • Too small to compete in mature European markets • Reduced free-float • Logistics unit benefits from Portuguese exports’ growth Opportunities • Focused on high GDP growth markets • Ascendi Group data lacks transparency • Concentration opportunities • Further economic deterioration in Portugal • Entering new countries in Latam and Africa • Order execution problems affecting profitability • Good know-how of its activities • Difficulty entering the Brazilean infrastructures Threats • Forex risk exposure All share prices at 19/05/14. Recommendation: Our rating is currently suspended. FINANCIAL CALENDAR (Source: Precise) PRICE (SHORT & LONG AVERAGE) titre 6.0 30/05/14 Dividend Payment 5.5 5.0 2013 4.5 4.0 29/05/14 Results 3.5 2014Q1 3.0 2.5 27/05/14 Ex Dividend Date 2.0 1.5 1.0 0.5 mar 11 Source : Factset 136 jun 11 set 11 dez 11 mar 12 jun 12 set 12 dez 12 mar 13 jun 13 set 13 dez 13 mar 14 jun 14 2013 MOTA ENGIL SMALL & MID CAPS SELECTION Analyst(s) José Mota Freitas, CFA +351 22 607 09 31 Caixa-Banco de Investimento [email protected] Greece SMALL & MID CAPS SELECTION EUR 7.71 Accumulate MOTOR OIL MORr.AT/MOH GA Market capitalisation: EUR 854m Oil & Gas Producers EUR Sales (m) EBITDA (m) EBITDA margin EBIT (m) EBIT margin Net profit (reported) (m) Net profit (adj.) (m) Cash Flow from Ops.bef. chg in NWC (m) Net debt (Cash) (m) Net Debt/Equity Net Debt/EBITDA Interest cover (EBITDA/Fin. interest) ROCE (adj.) ROCE (adj.)/WACC EV / CE EV / Sales EV / EBITDA EV / EBIT P/E (adj.) P/BV OpFCF yield Dividend yield EPS (adj.) EPS (adj.) growth BVPS DPS Abs. Performances(12m,6m,3m,1m): 12 month High/low: EUR10.27 / 6.40 12/12 9,682 270 2.8% 178 1.8% 77.6 104 154 987 1.7 3.7 3.3 10.8% 1.1 1.2 0.2 6.9 10.4 8.8 1.6 26.4% 3.6% 0.94 -17.4% 5.14 0.30 -15.7% 01/13 12/14e 12/15e 9,282 9,519 9,599 185 280 356 2.0% 2.9% 3.7% 91.5 189 267 1.0% 2.0% 2.8% -4.6 88.4 149 38.9 88.4 149 107 201 240 925 903 844 1.8 1.5 1.3 5.0 3.2 2.4 2.4 3.8 5.2 6.5% 9.1% 12.6% 0.7 0.9 1.3 1.2 1.1 1.0 0.2 0.2 0.2 9.8 6.1 4.6 19.7 9.0 6.2 24.2 9.7 5.7 1.8 1.5 1.3 10.7% 12.2% 14.6% 2.6% 7.8% 9.1% 0.35 0.80 1.35 -62.6% 127.4% 69.0% 4.70 5.30 6.05 0.20 0.60 0.70 -6.0% -12.4% -13.1% Avg. Daily nb traded shares:129,926 Main shareholders: Vardinoyannis group 61.5%; Free float 38.5%; All share prices at 19/05/14. Profile: MOH is the second largest refiner in Greece with a strong export activity. Owner of a highly sophisticated coastal refinery with total nominal capacity of 180 kbd. Additionally, after the acquisition of Shell’s assets in Greece in 2010, including the operation of c.700 branded petrol stations, which will retain Shell brand name for at least 5 years, MOH’s total retail market share exceeds 30%, with upward trend. Finally, the company has recently entered electricity generation (35% stake in 437 MW CCGT power plant in commercial operation) and LNG trading. The company recently raised EUR 350m through a 5-year bond issue, significantly improving its debt maturity profile. SWOT Analysis Strengths • High complexity of the refinery, location next to coast facilitating exports and proximity to many crude oil •suppliers. Production geared towards middle distillates capitalizing on rising deficit in the region. • Strong export activity (over 50% of production is exported). • High dividend yield policy. Weaknesses • High sensitivity of earnings to refining margins, oil prices and EUR/USD exchange rate. • High working capital needs. Opportunities • Room for optimization of product and crude mix. Threats • Weak world demand combined with new capacity and rising US exports retain pressure on Med margins. • Slower than expected recovery of domestic fuels demand • Market share gains in retail market • Entrance in the electricity generation and LNG • Challenging financing environment in Greece • Crude oil supply disruptions in the region (Iran, Syria, Libya) have reduced traditional advantage in crude oil costs. Recommendation: The combination of mediocre outlook for global refining margins, higher crude costs due to tightening crude differentials and weak domestic demand indicates a negative operating environment for MOH in the near-term. Nevertheless, due to its flexibility in production and sales mix and low capex requirements, we estimate that MOH will continue to generate solid FCF, even at mediocre margins, retaining a satisfactory dividend policy and at the same time deleveraging balance sheet. FINANCIAL CALENDAR (Source: Precise) PRICE (SHORT & LONG AVERAGE) Target Price: EUR 9.80 t i t re 11 19/06/14 AGM 10 2013 9 8 29/05/14 Results 2014Q1 29/05/14 Results 2014Q1 7 6 5 Vassilis Roumantzis 4 3 Μαρ 11 MOTOR OIL SMALL & MID CAPS SELECTION Analyst(s) Ιουν 11 Σεπ 11 Δεκ 11 Μαρ 12 Ιουν 12 Σεπ 12 Δεκ 12 Μαρ 13 Ιουν 13 Σεπ 13 Δεκ 13 Μαρ 14 +30 2108173394 Investment Bank of Greece [email protected] Ιουν 14 Source : Factset 137 France SMALL & MID CAPS SELECTION EUR 65.14 Hold NATUREX NATU.PA/NRX FP Market capitalisation: EUR 541m Food & Beverage EUR Sales (m) EBITDA (m) EBITDA margin EBIT (m) EBIT margin Net profit (reported) (m) Net profit (adj.) (m) Cash Flow from Ops.bef. chg in NWC (m) Net debt (Cash) (m) Net Debt/Equity Net Debt/EBITDA Interest cover (EBITDA/Fin. interest) ROCE (adj.) ROCE (adj.)/WACC EV / CE EV / Sales EV / EBITDA EV / EBIT P/E (adj.) P/BV OpFCF yield Dividend yield EPS (adj.) EPS (adj.) growth BVPS DPS Abs. Performances(12m,6m,3m,1m): 12 month High/low: EUR65.90 / 55.40 12/12 300 49.6 16.6% 35.5 11.8% 18.3 18.3 32.5 119 0.5 2.4 10.5 6.4% 0.8 1.4 1.9 11.3 15.8 24.7 1.7 -4.1% 0.2% 2.31 2.8% 33.49 0.12 13.9% 12/13 321 53.0 16.5% 35.3 11.0% 16.8 16.8 34.5 152 0.6 2.9 9.7 5.8% 0.7 1.4 1.9 11.4 17.1 27.4 1.6 -6.5% 0.2% 2.12 -8.1% 35.37 0.11 9.9% 12/14e 12/15e 354 402 60.3 70.5 17.0% 17.5% 41.2 49.9 11.6% 12.4% 22.3 27.9 22.3 27.9 41.4 48.5 155 144 0.4 0.4 2.6 2.0 9.7 11.5 5.6% 6.6% 0.7 0.8 1.3 1.4 2.0 1.8 11.5 10.3 16.9 14.5 24.9 21.3 1.5 1.5 0.5% 2.1% 0.2% 0.2% 2.62 3.07 23.3% 17.0% 43.26 43.39 0.13 0.15 3.2% 2.1% Avg. Daily nb traded shares:5,154 Main shareholders: Flottant 52.0% (62.0%); SGD 21.0% (25.3%); Groupe Natraceutical 20.7% (3.2%); CM-CIC invest 3.2% (5.6%); Ed Rotschild IP 3.1% (3.9%); All share prices at 20/05/14. Profile: Naturex is a leading producer of natural extracts for the flavouring, food processing, nutraceutical and cosmetics industries. SWOT Analysis Strengths • Among the leaders of the industry, with a full range of products and applications, • A large, diversified, locally established production tool, Weaknesses • Financial performances in the low range of the industry, especially in terms of cash flow generation, • Still a weak position on some fast growing segments like colours • Experience in acquisitions, which is one of the KFS of the group's strategy Opportunities • Increasing use of natural flavours and ingredients in food industry as well as cosmetics • A still fragmented industry Threats • Bargaining power against the largest clients, • Weaker growth in Europe. • Concentration accelerate at the top of the industry, led by the large chemical groups Recommendation: Naturex has been reorganizing over the past year. This programme was initiated jointly by the management and the new shareholders, in order to lift operating performances to the industry standards. As a result, the operating margin is slightly under pressure, whereas organic top line growth is back in the 6-7% range versus 8-10% previously. The company is focusing on its best practices and has put aside its aggressive acquisition strategy for now. But the main challenge could, however, come from a faster than expected change in the industry structure, under the impetus of chemical players accelerating the consolidation of the natural extracts producers, and therefore weakening the position of Naturex. That could lead management to reconsider the question of critical size and, consequently, their strategic priorities. Target Price: EUR 65.00 FINANCIAL CALENDAR (Source: Precise) PRICE (SHORT & LONG AVERAGE) titre 75 25/07/14 Trading Update 70 65 26/06/14 AGM 60 55 26/05/14 Results 50 45 40 Mar 11 Source : Factset 138 Jun 11 Sep 11 Dec 11 Mar 12 Jun 12 Sep 12 Dec 12 Mar 13 Jun 13 Sep 13 Dec 13 Mar 14 Jun 14 2014Q2 2013 2014Q1 NATUREX SMALL & MID CAPS SELECTION Analyst(s) Jean-Pascal Brivady +33 4 78 92 02 25 CM - CIC Securities [email protected] Netherlands SMALL & MID CAPS SELECTION EUR 32.02 Hold NEDAP NEDP.AS/NEDAP NA Market capitalisation: EUR 214m General Industrials EUR Sales (m) EBITDA (m) EBITDA margin EBIT (m) EBIT margin Net profit (reported) (m) Net profit (adj.) (m) Cash Flow from Ops.bef. chg in NWC (m) Net debt (Cash) (m) Net Debt/Equity Net Debt/EBITDA Interest cover (EBITDA/Fin. interest) ROCE (adj.) ROCE (adj.)/WACC EV / CE EV / Sales EV / EBITDA EV / EBIT P/E (adj.) P/BV OpFCF yield Dividend yield EPS (adj.) EPS (adj.) growth BVPS DPS Abs. Performances(12m,6m,3m,1m): 12 month High/low: EUR32.95 / 27.67 12/12 172 25.6 14.9% 16.4 9.5% 13.5 13.5 23.5 31.3 0.5 1.2 39.2 11.0% 1.3 2.1 1.3 8.8 13.7 14.5 3.3 6.5% 5.2% 2.01 22.8% 8.83 1.51 0.7% 12/13 174 21.8 12.5% 11.8 6.8% 9.8 9.8 16.3 33.7 0.6 1.5 37.0 7.9% 0.9 2.2 1.3 10.6 19.6 20.5 3.7 3.5% 3.4% 1.46 -27.4% 8.00 1.10 10.4% 12/14e 12/15e 179 188 24.0 27.5 13.4% 14.6% 13.7 16.6 7.6% 8.8% 11.5 13.8 11.5 13.8 21.8 24.7 28.4 24.0 0.5 0.4 1.2 0.9 61.7 95.0 9.3% 11.1% 1.1 1.3 2.3 2.2 1.3 1.2 9.9 8.5 17.5 14.1 18.7 15.5 3.7 3.4 5.9% 6.1% 4.0% 4.8% 1.72 2.07 17.3% 20.3% 8.62 9.39 1.29 1.55 2.6% -0.1% Avg. Daily nb traded shares:3,658 Profile: Nedap describes itself as a manufacturer of intelligent technological solutions for relevant themes such as energy, water, agri, healthcare and security. The company’s products and technology are used in applications for cattle farming, access control, security management, shrink management, library solutions, water purification, energy efficiency, and the recognition, identification and management of vehicles and drivers. It also offers a planning and registration system for healthcare professionals. The common denominator between Nedap’s products is technology, with most of its products being based on Radio Frequency Identification (RFID) technology. SWOT Analysis Strengths • Highly innovative company • Flexible organisation structure, adapting quickly to new markets or market circumstances • Highly diversified product portfolio Weaknesses • The company has project-based work with a short order book • Highly sensitive for sales changes due to high gross margins • Relatively small company with limited resources • Solid financial position Opportunities • Internationalisation by using partners and web-based technology • Increase of recurring business • Further transformation into a software oriented and market driven company Threats • Competitors going for market share • Increase of required R&D spending to continue development of new products • Availability of educated and skilled personnel • High dependence on RF technology Main shareholders: Free float 28.3%; Cross Options 15.1%; Delta Lloyd Deelnemingen 13.5%; Delta Lloyd 12.6%; ASR 8.2%; Kempen 7.1%; Darlin 5.2%; TKH 5.1%; Decico 5.0%; All share prices at 19/05/14. FINANCIAL CALENDAR (Source: Precise) PRICE (SHORT & LONG AVERAGE) t i t re 34 32 Recommendation: Nedap has transformed from a pure technology player into a much more market oriented organisation with a larger sales force and partner network. With continued internationalisation we expect that the next step in the company’s strategy is scalability which will further improve the company’s added value per employee in the next few years. Nedap is showing improving revenue trends following the slow growth in 2013. High investments made over the last 12 months could result in net profit growth lagging sales growth in 1H14. These investments are expected to pay off in the longer term and the improved revenue trends will drive margin improvement. Target Price: EUR 30.00 30 28 26 24 22 20 18 Mar 11 Source : Factset Jun 11 Sep 11 Dec 11 Mar 12 Jun 12 Sep 12 Dec 12 Mar 13 Jun 13 Sep 13 Dec 13 Mar 14 Jun 14 NEDAP SMALL & MID CAPS SELECTION Analyst(s) Johan van den Hooven +312 0 5508518 SNS Securities [email protected] 139 France SMALL & MID CAPS SELECTION EUR 59.94 Hold NEOPOST NPOS.PA/NEO FP Market capitalisation: EUR 2004m General Industrials EUR Sales (m) EBITDA (m) EBITDA margin EBIT (m) EBIT margin Net profit (reported) (m) Net profit (adj.) (m) Cash Flow from Ops.bef. chg in NWC (m) Net debt (Cash) (m) Net Debt/Equity Net Debt/EBITDA Interest cover (EBITDA/Fin. interest) ROCE (adj.) ROCE (adj.)/WACC EV / CE EV / Sales EV / EBITDA EV / EBIT P/E (adj.) P/BV OpFCF yield Dividend yield EPS (adj.) EPS (adj.) growth BVPS DPS Abs. Performances(12m,6m,3m,1m): 12 month High/low: EUR66.61 / 48.65 01/12 1,003 300 29.9% 237 23.6% 154 154 239 796 1.4 2.7 10.9 11.8% 2.1 1.8 2.6 8.7 11.0 11.8 3.2 9.5% 7.2% 4.59 -4.8% 16.93 3.90 12.5% 01/13 01/14e 01/15e 1,070 1,096 1,104 323 331 324 30.2% 30.2% 29.3% 256 255 245 23.9% 23.2% 22.2% 161 162 146 161 162 146 233 237 225 964 949 964 1.6 1.5 1.5 3.0 2.9 3.0 10.6 8.8 9.4 10.8% 10.5% 9.8% 2.0 1.8 1.7 1.5 1.9 1.8 2.2 2.8 2.7 7.4 9.3 9.2 9.3 12.0 12.2 8.7 13.0 13.7 2.3 3.3 3.0 11.6% 9.1% 7.6% 6.5% 6.6% 6.6% 4.80 4.84 4.37 4.6% 0.9% -9.8% 18.43 19.32 19.74 3.90 3.95 3.95 5.2% -7.8% 3.8% Avg. Daily nb traded shares:81,214 Main shareholders: Free float 74.5%; First Eagle Investment 9.5%; Mondrian 5.7%; Profile: Europe’s biggest and the world’s second-biggest supplier of mail-processing equipment. Neopost is positioned in two main markets: franking systems (2/3 of consolidated sales) and document management systems and logistics (1/3). Sales split by country: 39% in North America; 21% in France; 32% in Europe, excluding France; 7% in the rest of the world. Its main rival is market leader Pitney Bowes (PBI US) which holds key positions in North America, a market on which Neopost, as a challenger, has residual growth potential. SWOT Analysis Strengths • Markets have been turned into cartels by national postal services • Effective R&D, new products on a regular basis • Very high, durable dividend yield Opportunities • Development of cross-selling, given that only 10% of Neopost's clients are equipped with both of its two main (franking machines and inserting •products Consolidation of distributors andenvelope their margins • US market 80% controlled by Pitney Bowes, positioned on the highest-margin segments • Renewal of Pitney Bowes' product range, which should limit the competitive advantage of Neopost (new products launched in 2012) Threats • Revenue exposure to the dollar (40% of sales) • Crash in bond market, as the defensive high dividend yield story is linked to an arbitrage against interest rates Recommendation: Neopost is currently and slowly gaining market share in North America. The group expects growth in its service offer to bring about both organic growth and higher profits in 204-16, but at a low level (0-2%). We believe that the average long-yield will exceed 7% based on changes in share price and dividends. Lastly, Neopost recently confirmed it is interested in its embattled German rival, Francotyp Postalia. Buy recommendation as we believe that the dividend is solid. Also short positions on the stock are really high at around 13% of existing shares (according to Bloomberg and AMF). Marathon 5.7%; Blackrock 4.7%; All share prices at 19/05/14. Target Price: EUR 62.00 FINANCIAL CALENDAR (Source: Precise) PRICE (SHORT & LONG AVERAGE) Weaknesses • Risky diversifications? titre 70 01/07/14 AGM 65 60 27/05/14 Trading Update 55 50 40 35 Mar 11 140 2014Q1 NEOPOST SMALL & MID CAPS SELECTION Analyst(s) Christian Auzanneau 45 Source : Factset 2013 Jun 11 Sep 11 Dec 11 Mar 12 Jun 12 Sep 12 Dec 12 Mar 13 Jun 13 Sep 13 Dec 13 Mar 14 Jun 14 +33 4 78 92 01 85 CM - CIC Securities [email protected] France SMALL & MID CAPS SELECTION EUR 41.80 Reduce NEXANS NEXS.PA/NEX FP Market capitalisation: EUR 1756m Electronic & Electrical Equipment EUR Sales (m) EBITDA (m) EBITDA margin EBIT (m) EBIT margin Net profit (reported) (m) Net profit (adj.) (m) Cash Flow from Ops.bef. chg in NWC (m) Net debt (Cash) (m) Net Debt/Equity Net Debt/EBITDA Interest cover (EBITDA/Fin. interest) ROCE (adj.) ROCE (adj.)/WACC EV / CE EV / Sales EV / EBITDA EV / EBIT P/E (adj.) P/BV OpFCF yield Dividend yield EPS (adj.) EPS (adj.) growth BVPS DPS Abs. Performances(12m,6m,3m,1m): 12 month High/low: EUR43.14 / 30.38 12/12 4,872 292 6.0% 143 2.9% 28.0 46.0 224 606 0.3 2.1 2.6 4.3% 0.5 0.6 0.4 6.4 13.1 19.1 0.5 4.3% 2.7% 1.56 +chg 62.35 1.14 21.8% 12/13e 12/14e 12/15e 4,689 4,877 5,126 -37.0 280 380 nm 5.7% 7.4% -182 129 226 nm 2.6% 4.4% -333 20.1 106 -200 60.1 141 181 179 328 337 345 180 0.2 0.2 0.1 -9.1 1.2 0.5 nm 2.8 4.2 3.4% 5.3% 7.8% 0.4 0.6 1.0 0.8 1.0 0.5 0.5 nm 9.3 nm 20.3 nm 29.2 12.4 1.0 1.1 1.1 4.4% -0.5% 9.7% 0.0% 0.4% 1.9% -4.76 1.43 3.36 -chg +chg 135.0% 36.88 37.36 39.72 0.00 0.17 0.78 28.0% 10.4% 7.4% Avg. Daily nb traded shares:195,957 Main shareholders: Free float 65.4%; Madeco 25.8%; French State Sovereign Fund (FSI) 5.6%; Employees 3.2%; All share prices at 19/05/14. FINANCIAL CALENDAR (Source: Precise) PRICE (SHORT & LONG AVERAGE) titre 65 25/07/14 Results 60 Profile: Worldwide leader in the cable industry, Nexans brings solutions to clients regarding infrastructures (energy and telecoms), industry and building cables. Nexans derives more than 55% of its sales from Europe, and has roughly 100 production sites spread across 39 countries. Energy-related business accounts for more than 80% of sales. This covers infrastructure cables (high voltage), industrial cables targeting the oil and renewable energy markets, and low- and medium-voltage cables for construction markets. There are many drivers in the energy infrastructure market: modernisation of power systems (saturation issues), urbanisation and electrification in emerging markets, development of renewable energy sources (scattered and intermittent) and the interconnection of national grids (creating an integrated European market). SWOT Analysis STRENGTHS Repositioning in market segments with highadded value (energy infrastructure) Industry leadership position in high-voltage cables, where growth and margins are high Strong presence in emerging markets, which provide 34% of group revenue OPPORTUNITIES Urbanisation/electrification in emerging markets Upgrading of electrical networks (renovation, burying lines), connecting of new renewable energy sources European electricity interconnection needs WEAKNESSES Balance sheet impacted by changes in commodity prices (copper, aluminium) Western Europe still accounts for more than 60% of group revenue, weak presence in China. The cost structure (WCR, R&D, SG&A) still needs improvement THREATS Cyclical nature of the cable industry in some segments (construction, cars, aerospace) Competition from emerging players (China, India), so far limited to generic products Investigations underway for distortion of competition in high-voltage cables Recommendation: Shareholders at the AGM voted for Fréderic Vincent to remain a Director of Nexans. The Board of Directors, decided to separate the functions of Chairman (Fréderic Vincent) and CEO (Arnaud Poupart Lafarge). The separation of powers, requested for several months now by several US and UK funds-shareholders and independent shareholder advisory bodies, leaves Arnaud Poupart-Lafarge as the sole architect of the group’s short-term strategy, notably the shaping of the restructuring plan. This move will allay investor concerns on this subject. A request has been made by Invexans (28% shareholder) to terminate its 2011 agreement (modified in 2012). In order to reassure minority shareholders, Invexans stated it has no intention of taking control of Nexans, or increasing its stake to over 30%, or selling all or part of its stake. Given the company’s current valuation, we believe that the benefits of the reorganisation are already priced in to a large extent (the goal is to lift operating profit from EUR141m in 2013 to EUR290m in 2015). Our intrinsic value method, which is based on an approach using Nexans’ normalised results, points to a EUR30.8 valuation. 2014H1 55 50 Target Price: EUR 31.00 45 40 35 30 Analyst(s) 25 20 Mar 11 Source : Factset Jun 11 Sep 11 Dec 11 Mar 12 Jun 12 Sep 12 Dec 12 Mar 13 Jun 13 Sep 13 Dec 13 Mar 14 Jun 14 Ari Agopyan CM - CIC Securities +33 1 45 96 85 80 [email protected] 141 Spain SMALL & MID CAPS SELECTION EUR 4.32 Accumulate NH HOTEL GROUP NHH.MC/NHH SM Market capitalisation: EUR 1513m Hotels, Travel & Tourism EUR Sales (m) EBITDA (m) EBITDA margin EBIT (m) EBIT margin Net profit (reported) (m) Net profit (adj.) (m) Cash Flow from Ops.bef. chg in NWC (m) Net debt (Cash) (m) Net Debt/Equity Net Debt/EBITDA Interest cover (EBITDA/Fin. interest) ROCE (adj.) ROCE (adj.)/WACC EV / CE EV / Sales EV / EBITDA EV / EBIT P/E (adj.) P/BV OpFCF yield Dividend yield EPS (adj.) EPS (adj.) growth BVPS DPS Abs. Performances(12m,6m,3m,1m): 12 month High/low: EUR5.17 / 2.53 12/12 1,310 77.9 5.9% -34.8 nm -292 -66.7 132 996 1.0 12.8 1.4 0.2% 0.0 0.8 1.3 21.9 nm nm 0.8 27.6% 0.0% -0.27 -chg 3.38 0.00 58.2% 12/13 12/14e 12/15e 1,281 1,311 1,370 143 139 163 11.2% 10.6% 11.9% 49.0 46.2 69.0 3.8% 3.5% 5.0% -39.8 -6.8 12.7 -44.1 -6.8 12.7 55.2 86.6 107 745 673 720 0.6 0.6 0.6 5.2 4.9 4.4 2.4 2.6 3.3 1.1% 1.9% 2.7% 0.1 0.2 0.4 1.1 1.2 1.2 1.7 1.7 1.6 14.9 15.7 13.6 43.4 47.1 32.2 nm nm nm 1.2 1.3 1.3 -0.7% -3.7% -3.3% 0.0% 0.0% 0.0% -0.15 -0.02 0.04 +chg +chg +chg 3.46 3.20 3.24 0.00 0.00 0.00 6.0% -2.0% -4.3% Avg. Daily nb traded shares:846,523 Main shareholders: Free float 34.0%; HNA 24.1%; Hesperia 20.1%; Banca Intesa 4.5%; Profile: NH Hotel Group occupies the 23rd position worldwide and fifth in Europe (88% of its total rooms are located within Europe). It is a hotel chain focused on business travellers (91% of the rooms are urban), with 379 hotels and 58,195 rooms (at December 2013) within the midscale category (3-4*). Currently its major business comes from Benelux and Central Europe (jointly 51% of its revenues and 57% of its EBITDA). By country revenue breakdown: 23% Spain, 22% Benelux, 15% Italy, 28% Central Europe and 6% LatAm. According to the contract type: 23% of the rooms are owned, 53% leased (mainly in Germany & Italy) and 24% managed. During 2013 relevant financial and shareholder restructuration’s took place. Regarding the former, several disposals were accomplished giving entrance to a more stable shareholders. HNA, Hesperia and Banca Intesa currently hold 48.6% of the capital, although the latter will increase its stake after a capital increase in the s/t. Concerning the financial situation, a relevant refining policy has enabled to count on a more comfortable financial calendar (no relevant maturities until 2017) at a similar cost (5.15%). Nonetheless an additional asset disposal is required (at least of EUR 125m) to complete de asset repositioning plan currently in force (capex needs 2014-15 will surpass EUR 100m/year). The aim is to reduce the number of hotels by cancelling non-strategic and non-profitable leasing contracts & economy category premises; as well as rising ADR (especially in Spain, Italy and Benelux). SWOT Analysis Strengths • Leader in urban segments in Italy, Spain, Netherlands, Belgium & Germany. • Entrance of long term shareholders Weaknesses • Poor outlook real estate business (Sotogrande) • Successful refinancing policy • Good track record in asset sales Opportunities • Ambitiousasset repositioning plan • Operating leverage accomplished • Low resort presence (Hesperia brand) • ADR and operating margins below peak cycle Threats • Slow recovery Spanish & Italian urban segments • Strong asset concentration in Spain & Italy (c. 50%) • High exposure to rental hotels • High exposure to domestic clients • Low possibilities of relevant expansion in the s/t All share prices at 19/05/14. • Mid term expansion with HNA (China) • Asset portfolio valued EUR 1.4-1.6bn PRICE (SHORT & LONG AVERAGE) Recommendation: Accumulate. Year 2014 will be a key in operating terms awaiting for the delivery of the asset repositioning plan and obtaining additional financial muscle to accomplish intense investments. On the negative after the AGM a capital increase will take place and in the s/t Hesperia might divest 8% stake. titre 6.5 6.0 FINANCIAL CALENDAR (Source: Company) 26/06 AGM Target Price: EUR 5.70 5.5 5.0 4.5 4.0 Analyst(s) 3.5 Sonia Ruiz De Garibay 3.0 2.5 2.0 1.5 Mar 11 Source : Factset 142 Jun 11 Sep 11 Dec 11 Mar 12 Jun 12 Sep 12 Dec 12 Mar 13 Jun 13 Sep 13 Dec 13 Mar 14 Jun 14 BEKA Finance +34 91 436 7841 [email protected] Portugal SMALL & MID CAPS SELECTION EUR 3.86 Accumulate NOVABASE NBA.LS/NBA PL Market capitalisation: EUR 121m Software & Computer Services EUR Sales (m) EBITDA (m) EBITDA margin EBIT (m) EBIT margin Net profit (reported) (m) Net profit (adj.) (m) Cash Flow from Ops.bef. chg in NWC (m) Net debt (Cash) (m) Net Debt/Equity Net Debt/EBITDA Interest cov er (EBITDA/Fin. interest) ROCE (adj.) ROCE (adj.)/WACC EV / CE EV / Sales EV / EBITDA EV / EBIT P/E (adj.) P/BV OpFCF y ield Div idend y ield EPS (adj.) EPS (adj.) grow th BVPS DPS Abs. Performances(12m,6m,3m,1m): 12 month High/low : EUR3.97 / 2.31 12/12 212 18.1 8.5% 12.3 5.8% 7.9 6.6 15.5 -33.7 -0.3 -1.9 nm 10.3% 1.1 0.5 0.2 2.4 3.5 11.0 0.7 16.9% 1.3% 0.21 177.7% 3.19 0.03 33.3% 12/13 12/14e 12/15e 217 217 233 14.9 15.5 18.3 6.9% 7.1% 7.8% 9.1 9.4 11.7 4.2% 4.3% 5.0% 7.5 5.3 6.7 4.2 4.0 5.3 15.0 13.5 15.6 -17.7 -26.1 -29.7 -0.2 -0.3 -0.3 -1.2 -1.7 -1.6 25.9 24.5 34.3 7.9% 9.0% 10.9% 0.9 1.0 1.2 0.9 1.5 1.4 0.3 0.5 0.5 4.9 7.1 5.9 7.9 11.7 9.2 19.5 30.4 22.7 0.9 1.4 1.3 15.6% 12.3% 5.5% 15.5% 5.2% 2.6% 0.13 0.13 0.17 -36.1% -5.1% 34.1% 2.87 2.84 2.95 0.60 0.20 0.10 35.4% 7.2% -0.3% Av g. Daily nb traded shares:4,499 Main shareholders: Management 42.1% (42.9%); Free float 30.0% (30.6%); Partbleu, SGPS 10.1% (10.3%); Grupo BES 5.9% (6.0%); F. F. Santos 5.0% (5.1%); Santander A. M. 4.9% (5.0%); Treas. Stock 1.9%; Profile: Novabase is one of the leading IT companies in the Portuguese market. Created in 1989 and listed since 2000, its activity is divided into three segments: (i) Business Solutions, (ii) Infrastructures and Managed Services and (iii) Novabase Capital. Novabase is a sound and flexible company with a very focused and ambitious management that shows very strong governance and a strong will to increase its market awareness. SWOT Analysis Strengths • One of the largest players in Portugal's IT market Weaknesses • Reduced stock market liquidity • Presents transparent accounts • Low market cap • Focused management • Solid balance sheet Opportunities • International expansion – namely in Africa Threats • Portuguese economic woes • M&A activity increase in the IT sector • International peers’ competition Recommendation: Novabase’s guidance for 2014 points to reaching EUR 220m in Turnover, EBITDA between EUR 14m and EUR 17m and 35% foreign Sales. The company is stepping up its internationalization effort, seeking new sources of growth. Novabase has recently (March) changed its payout policy by indicating a lower 30% of Net Profit limit and leaving the total dividend amount more dependent on the effective cash generation during the period (and future needs). We have an Accumulate recommendation on the stock. All share prices at 19/05/14. Target Price: EUR 4.40 FINANCIAL CALENDAR (Source: Precise) PRICE (SHORT & LONG AVERAGE) 30/07/14 Results 2014Q2 NOVABASE SMALL & MID CAPS SELECTION Analyst(s) 30/07/14 Results 2014Q2 José Mota Freitas, CFA titre 4.0 3.5 3.0 2.5 05/06/14 Dividend Payment 2013 02/06/14 Ex Dividend Date 2013 +351 22 607 09 31 Caixa-Banco de Investimento [email protected] 2.0 1.5 mar 11 jun 11 set 11 dez 11 mar 12 jun 12 set 12 dez 12 mar 13 jun 13 set 13 dez 13 mar 14 jun 14 Source : Factset 143 Netherlands SMALL & MID CAPS SELECTION EUR 33.01 Hold NUTRECO NUTR.AS/NUO NA Market capitalisation: EUR 2267m Food & Beverage EUR Sales (m) EBITDA (m) EBITDA margin EBIT (m) EBIT margin Net profit (reported) (m) Net profit (adj.) (m) Cash Flow from Ops.bef. chg in NWC (m) Net debt (Cash) (m) Net Debt/Equity Net Debt/EBITDA Interest cover (EBITDA/Fin. interest) ROCE (adj.) ROCE (adj.)/WACC EV / CE EV / Sales EV / EBITDA EV / EBIT P/E (adj.) P/BV OpFCF yield Dividend yield EPS (adj.) EPS (adj.) growth BVPS DPS Abs. Performances(12m,6m,3m,1m): 12 month High/low: EUR39.19 / 30.50 12/12 5,229 307 5.9% 235 4.5% 177 157 222 262 0.3 0.9 11.6 17.3% 2.4 2.3 0.5 8.0 10.5 14.2 2.3 2.7% 3.2% 2.27 26.2% 13.98 1.03 0.6% 12/13 12/14e 12/15e 3,867 3,975 4,135 251 265 278 6.5% 6.7% 6.7% 195 209 221 5.0% 5.3% 5.4% 150 157 166 127 134 143 195 189 199 352 349 333 0.4 0.3 0.3 1.4 1.3 1.2 8.6 9.4 9.5 12.9% 12.8% 12.9% 1.8 1.8 1.8 2.4 2.1 2.0 0.7 0.7 0.6 11.2 9.8 9.3 14.4 12.4 11.6 19.5 16.9 15.9 2.6 2.3 2.1 2.3% 4.0% 4.4% 3.0% 3.0% 3.0% 1.85 1.96 2.08 -18.3% 5.8% 6.3% 13.70 14.63 15.72 1.00 1.00 1.00 -7.2% 1.2% 3.0% Avg. Daily nb traded shares:142,285 Main shareholders: Free float 90.0%; ING Group 10.0%; All share prices at 19/05/14. FINANCIAL CALENDAR (Source: Precise) PRICE (SHORT & LONG AVERAGE) t i t re 40 38 Profile: Nutreco is internationally active in animal nutrition (premix/additives) and fish feed in various species and in various countries worldwide. Additionally, it produces and distributes compound feed in Spain/Portugal and is a processor of poultry and pork in Spain. Nutreco is the global market leader in fish feed, in particular in salmon feed in which it has an estimated market share of 35%. Nutreco plans to divest its Spanish/Portuguese businesses in compound feed and meat processing. SWOT Analysis Strengths • Market leadership in fish feed, in particular salmon feed • Strong balance sheet Weaknesses • Exposure to livestock makes Nutreco vulnerable to animal diseases • Volatility of Spanish poultry operations • Sustainability approach • Declining livestock staples Western Europe • Many management changes Opportunities • Growth in fish demand and aquaculture drives growth in fish feed • Growth of protein demand in emerging markets Threats • Price increases of raw materials • Consolidation potential Animal Nutrition • Will investments in shrimp feed bear fruit? • Take-over target • Marine Harvest starts salmon feed factory • Consolidation in salmon farming industry Recommendation: We rate Nutreco shares Hold with a target price of EUR 33. Our recommendation is based on 1) Nutreco operates in attractive markets with underlying volume growth prospects of c. 5% in fish feed and 3% in animal nutrition due to megatrends in demographics/increased protein intake. 2) Nutreco has invested substantially in R&D and has created strong conversion rates/improved formulas in salmon feed. In premix/specialty feed, Nutreco invested in application centres. 3) Nutreco has a good focus on sustainability. 4) However, the company has some transformational issues. The divestment process of the Iberian activities, the roll-out of the UnITe platform in Animal Nutrition, and the MicroBalance concept in the fragmented shrimp sector. The valuation range for Nutreco is €27 (DCF including discount) and €40 (breakup). Although 1H14E results will be strong based on high water temperatures YoY in Norway, the issues will hold back the share price. Our TP is based on a 50/50 weight for DCF and break-up/bid. 36 Target Price: EUR 33.00 34 32 30 28 26 Analyst(s) 24 22 20 Mar 11 Source : Factset 144 Jun 11 Sep 11 Dec 11 Mar 12 Jun 12 Sep 12 Dec 12 Mar 13 Jun 13 Sep 13 Dec 13 Mar 14 Jun 14 Gerard Rijk SNS Securities + 31 (0)20 550 8572 [email protected] Finland SMALL & MID CAPS SELECTION EUR 23.41 Hold OLVI OLVAS.HE/OLVAS FH Market capitalisation: EUR 486m Food & Beverage EUR Sales (m) EBITDA (m) EBITDA margin EBIT (m) EBIT margin Net profit (reported) (m) Net profit (adj.) (m) Cash Flow from Ops.bef. chg in NWC (m) Net debt (Cash) (m) Net Debt/Equity Net Debt/EBITDA Interest cover (EBITDA/Fin. interest) ROCE (adj.) ROCE (adj.)/WACC EV / CE EV / Sales EV / EBITDA EV / EBIT P/E (adj.) P/BV OpFCF yield Dividend yield EPS (adj.) EPS (adj.) growth BVPS DPS Abs. Performances(12m,6m,3m,1m): 12 month High/low: EUR29.04 / 23.10 12/12 312 52.4 16.8% 30.5 9.8% 25.7 25.7 46.2 52.8 0.4 1.0 high 11.7% 1.8 2.3 1.5 8.7 15.0 15.9 2.8 1.4% 2.5% 1.24 95.6% 7.10 0.50 -3.9% 12/13 327 56.8 17.4% 43.2 13.2% 33.5 33.5 49.2 45.3 0.3 0.8 high 15.3% 2.4 2.9 1.9 11.2 14.7 17.7 3.5 2.7% 2.8% 1.61 30.6% 8.26 0.65 -12.6% 12/14e 12/15e 322 341 56.1 62.2 17.4% 18.3% 41.7 46.7 12.9% 13.7% 35.4 39.5 35.4 39.5 51.0 56.6 38.6 30.9 0.2 0.1 0.7 0.5 high high 13.8% 14.4% 2.1 2.2 2.2 2.1 1.6 1.5 9.3 8.3 12.5 11.0 13.7 12.3 2.5 2.2 4.4% 5.1% 3.2% 3.4% 1.70 1.90 5.5% 11.7% 9.32 10.47 0.75 0.80 -17.4% -7.6% Avg. Daily nb traded shares:2,879 Profile: A beer and soft drinks company, Olvi makes over 30% of its sales in Finland, approximately 50% in the Baltic countries and almost 20% in Belarus. The company's main brands include the flagship brand Olvi as well as Sandels, A. Le Coq, Cēsu, Volfas Engelman and Lidskoe. Olvi supplies beer and soft drinks primarily to retailers. SWOT Analysis Strengths • Brewing know-how Weaknesses • Downbeat, mature Finnish market • Strong track record of above average growth and profitability • Light organisation and able management • Olvi Foundation's (controlling) stake not likely to change hands • Innovative R&D Opportunities • Further growth in Belarus Threats • Intensifying competition • Expansion into new emerging markets • Tightening regulation • New brand and product extensions • Stricter excise taxation • Belarusian economy's structural problems Main shareholders: Free float 78.2%; Olvi Foundation 15.7%; Hortling Heikki 5.1%; Ilmarinen Mutual Pension Insurance Company 1.0%; All share prices at 19/05/14. FINANCIAL CALENDAR (Source: Precise) PRICE (SHORT & LONG AVERAGE) titre 32 14/08/14 Results 30 2014H1 Recommendation: Olvi's earnings momentum has been hit by the strong decline in Angry Birds soft drink sales and excise tax hikes in Finland. This negative earnings momentum and the potential guidance downgrade are essential risks for the share in the short term, in our view. Yet the share price decline has moderated the company’s 2015 valuation to an acceptable level when taking into account company's good track record in delivering solid earnings growth. The main risk for the investment case is that the harsh economic situation in Belarus escalates into a balance of payments crisis that would hurt the share price. 28 Target Price: EUR 26.00 26 24 22 20 18 Analyst(s) 16 14 12 Mar 11 Jun 11 Sep 11 Dec 11 Mar 12 Jun 12 Sep 12 Dec 12 Mar 13 Jun 13 Sep 13 Dec 13 Mar 14 Jun 14 Niclas Catani Pohjola +358 10 252 8780 [email protected] Source : Factset 145 Netherlands SMALL & MID CAPS SELECTION EUR 1.89 Hold ORDINA ORDN.AS/ORDI NA Market capitalisation: EUR 174m Software & Computer Services EUR Sales (m) EBITDA (m) EBITDA margin EBIT (m) EBIT margin Net profit (reported) (m) Net profit (adj.) (m) Cash Flow from Ops.bef. chg in NWC (m) Net debt (Cash) (m) Net Debt/Equity Net Debt/EBITDA Interest cover (EBITDA/Fin. interest) ROCE (adj.) ROCE (adj.)/WACC EV / CE EV / Sales EV / EBITDA EV / EBIT P/E (adj.) P/BV OpFCF yield Dividend yield EPS (adj.) EPS (adj.) growth BVPS DPS Abs. Performances(12m,6m,3m,1m): 12 month High/low: EUR2.16 / 1.19 12/12 401 13.6 3.4% 3.0 0.8% 0.4 8.1 11.0 9.8 0.0 0.7 9.0 -0.8% -0.1 0.5 0.3 8.3 37.4 12.8 0.5 3.3% 0.0% 0.09 29.9% 2.25 0.00 41.7% 12/13 12/14e 12/15e 377 385 400 8.8 18.2 27.8 2.3% 4.7% 6.9% 1.8 12.1 21.5 0.5% 3.1% 5.4% 0.9 8.7 16.4 8.4 12.2 17.3 16.3 14.8 21.9 2.2 -7.0 -19.6 0.0 0.0 -0.1 0.3 -0.4 -0.7 5.9 36.6 nm -7.1% -12.0% -29.4% -0.6 -1.1 -2.7 1.1 1.0 0.9 0.5 0.4 0.4 20.1 9.2 5.6 99.4 13.8 7.2 20.8 14.2 10.1 1.2 1.1 1.1 7.1% 5.3% 9.0% 0.0% 1.7% 3.8% 0.09 0.13 0.19 4.0% 44.9% 41.6% 1.55 1.64 1.78 0.00 0.03 0.07 4.8% -8.2% -7.0% Avg. Daily nb traded shares:304,395 Main shareholders: Project Holland 9.3%; Lazard Frères Gestion 5.1%; Invesco 5.1%; Todlin 5.0%; Deutsche Bank 3.0%; All share prices at 19/05/14. FINANCIAL CALENDAR (Source: Precise) PRICE (SHORT & LONG AVERAGE) Profile: Ordina is a top-10 IT services player in the Netherlands, with a particularly strong position in the Finance and Public sectors (about 70% of total revenues). The other 30% of revenues comes from the Industry segment. Key clients include the Ministries of Home Affairs, Infrastructure and Justice, ING, Rabobank and KPN, with the top-10 customers delivering around 45% of total revenues. The Belgian activities account for about 18% of total revenues. SWOT Analysis Strengths • Blue chip client list Weaknesses • Relatively high mix of non-recurring ‘time & material’ business • Fully focused on Benelux market, which has proven to be extremely cyclical • Scale in local market • Skills in managing the core IT services business Opportunities • Growth in outsourcing market • Cyclical recovery fueling renewed growth Threats • Dutch Public sector spending under pressure due to political uncertainty and budget cuts • IT services business is cyclical, impact economy • Sector consolidation • Competing with strong international players Recommendation: Revenues in the first quarter showed a decline of 0.4%, which reflects a slowdown compared to the last two quarters in which Ordina showed positive growth (3Q13 +1.9%; 4Q13 +0.8%). EBITDA margin improved 250bps in 1Q14, fully driven by cost savings. The number of fte was further reduced by 39 to 2,879. Last year’s cost savings actions were mainly focused on reducing the number of indirect personnel which declined 7.5% to 335 fte in the first quarter. Ordina’s financial position remains sound with net debt / EBITDA currently at 0.7 and improving. Valued at an EV/EBITDA of 8.5 for 2014, the improved outlook and profitability seems to be priced in. We do not see short term triggers for further multiple expansions. We have a Hold rating. t i t re 3.5 Target Price: EUR 2.00 3.0 2.5 2.0 ORDINA SMALL & MID CAPS SELECTION Analyst(s) 1.5 1.0 0.5 Mar 11 Source : Factset 146 Jun 11 Sep 11 Dec 11 Mar 12 Jun 12 Sep 12 Dec 12 Mar 13 Jun 13 Sep 13 Dec 13 Mar 14 Jun 14 Johan van den Hooven +312 0 5508518 SNS Securities [email protected] Finland SMALL & MID CAPS SELECTION EUR 2.33 Hold ORIOLA-KD OKDBV.HE/OKDBV FH Market capitalisation: EUR 352m Healthcare EUR Sales (m) EBITDA (m) EBITDA margin EBIT (m) EBIT margin Net profit (reported) (m) Net profit (adj.) (m) Cash Flow from Ops.bef. chg in NWC (m) Net debt (Cash) (m) Net Debt/Equity Net Debt/EBITDA Interest cover (EBITDA/Fin. interest) ROCE (adj.) ROCE (adj.)/WACC EV / CE EV / Sales EV / EBITDA EV / EBIT P/E (adj.) P/BV OpFCF yield Dividend yield EPS (adj.) EPS (adj.) growth BVPS DPS Abs. Performances(12m,6m,3m,1m): 12 month High/low: EUR2.78 / 2.18 12/12 2,474 37.0 1.5% 27.7 1.1% 18.0 18.9 27.3 6.6 0.0 0.2 6.9 6.4% 0.8 1.0 0.1 9.3 12.4 17.9 1.1 4.7% 4.0% 0.12 -73.3% 2.08 0.09 -2.1% 12/13 12/14e 12/15e 2,599 2,580 2,700 50.1 61.0 84.3 1.9% 2.4% 3.1% 29.0 34.6 59.3 1.1% 1.3% 2.2% 13.7 16.9 36.4 20.9 17.7 34.4 34.8 43.3 59.4 182 126 55.9 0.7 0.4 0.1 3.6 2.1 0.7 3.7 4.6 5.9 5.9% 5.6% 9.5% 0.8 0.7 1.2 1.2 1.0 0.8 0.2 0.2 0.2 11.3 7.9 4.9 19.6 13.8 6.9 18.5 19.9 10.3 1.4 1.1 0.9 -42.4% 0.8% 10.8% 0.0% 2.1% 4.3% 0.14 0.12 0.23 10.5% -15.3% 94.4% 1.84 2.21 2.65 0.00 0.05 0.10 -7.2% -2.1% 0.0% Avg. Daily nb traded shares:46,055 Profile: Oriola-KD is a leading pharmaceutical retail and wholesale company in the Nordic countries and Russia. Its operating segments are Pharmaceutical Trade Finland and the Baltics; Pharmaceutical Trade Sweden; and Pharmaceutical Trade Russia. SWOT Analysis Strengths • Attractive growth strategy implemented with determination. Streamlining has been made and the focus on core operations •is Healthcare is generally regarded as a stable and defensive sector • High barriers to entry in wholesale trade Weaknesses • Unhealthy competition in Russian wholesale, significant consolidation needed in Russia • Regulation changes in Russia tend to be fast and unpredictable, market visibility is extremely poor • Weak business visibility has resulted in several profit warnings Opportunities • Liberalisation of the Finnish pharmacy market would give rise to an attractive growth opportunity • The still underdeveloped Russian market offers long-term growth potential • Target for a European buyer, but the difference in the voting rights of share series makes this difficult Threats • Small market share in Russia keeps the margin low/negative • Situation in Russia enhances only if some of the businesses go bust • Future of wholesale trade in general (has to be supported by retail sales channel) Recommendation: The company fares well in Finland, with margins between 4.5% and 5.0%, and the future also looks bright in Sweden, where the company has gained considerable market share in both wholesale and retail trade. The acquisition of Medstop in Sweden was costly but a necessary move for the long 3.4%; term. The financial worries concentrate on Russia, which is having yet another poor year. Automation Main shareholders: Free float 100.0%; Keskinäinen Työeläkevakuutusyhtiö Varma 4.2%; Ilmarinen Keskinäinen Eläkevakuutusyhtiö has been increased and the new main logistics centre will be opened in Moscow in 2015. These measures Keskinäinen Eläkevakuutusyhtiö Etera 2.8%; should finally raise Russia into the black, but market visibility remains foggy. All share prices at 19/05/14. Target Price: EUR 2.50 FINANCIAL CALENDAR (Source: Precise) PRICE (SHORT & LONG AVERAGE) titre 3.0 2.8 2.6 ORIOLA-KD SMALL & MID CAPS SELECTION Analyst(s) Kimmo Stenvall 2.4 +358 10 252 4561 Pohjola [email protected] 2.2 2.0 1.8 1.6 1.4 Mar 11 Jun 11 Sep 11 Dec 11 Mar 12 Jun 12 Sep 12 Dec 12 Mar 13 Jun 13 Sep 13 Dec 13 Mar 14 Jun 14 Source : Factset 147 France SMALL & MID CAPS SELECTION EUR 51.33 Buy ORPEA ORP.PA/ORP FP Market capitalisation: EUR 2848m Healthcare EUR Sales (m) EBITDA (m) EBITDA margin EBIT (m) EBIT margin Net profit (reported) (m) Net profit (adj.) (m) Cash Flow from Ops.bef. chg in NWC (m) Net debt (Cash) (m) Net Debt/Equity Net Debt/EBITDA Interest cover (EBITDA/Fin. interest) ROCE (adj.) ROCE (adj.)/WACC EV / CE EV / Sales EV / EBITDA EV / EBIT P/E (adj.) P/BV OpFCF yield Dividend yield EPS (adj.) EPS (adj.) growth BVPS DPS Abs. Performances(12m,6m,3m,1m): 12 month High/low: EUR53.67 / 34.81 12/12 1,429 258 18.0% 194 13.6% 97.0 97.0 212 1,963 1.7 7.6 3.5 3.2% 0.6 0.9 2.6 14.5 19.3 18.3 1.5 4.0% 1.2% 1.83 20.8% 22.31 0.60 46.2% 12/13e 12/14e 12/15e 1,608 1,949 2,169 299 347 384 18.6% 17.8% 17.7% 227 265 294 14.1% 13.6% 13.5% 116 122 133 116 122 133 188 204 223 1,767 1,864 1,852 1.3 1.3 1.2 5.9 5.4 4.8 3.3 4.1 4.5 3.7% 4.1% 4.5% 0.6 0.7 0.8 1.0 1.1 1.1 2.6 2.4 2.2 13.8 13.6 12.3 18.1 17.9 16.1 20.1 23.3 21.4 1.7 2.0 1.8 8.0% 3.9% 3.6% 1.4% 1.5% 1.6% 2.10 2.20 2.40 14.7% 4.7% 9.0% 24.64 26.14 27.79 0.70 0.75 0.80 23.9% 17.1% 7.8% Avg. Daily nb traded shares:79,791 Main shareholders: Free float 64.5% (64.6%); CPPIB 15.0% (12.0%); Marian Family 7.6% (12.8%); Profile: Specialised since 1989 in permanent dependence (extended care for seniors and the very elderly with growing needs for medication) and temporary dependence (post-operative and psychiatric care), with more than 520 establishments. One-fifth of beds are under construction or being restructured, which will provide upside in 2014-16. The targeted population is very solvent and consolidation of the commercial private sector (22% of the overall offer) still holds opportunities given its fragmented nature (50% of supply excluding major groups) and the non-profit making private sector (78% of the French global offer) whose investment capacity is limited given the need to standardise quality and rehabilitation standards. SWOT Analysis Strengths • Sharp increase in demand for the over 85 age bracket Weaknesses • Debt is huge. • Limited offering in quantitative & qualitative terms • . but finances real estate only • Close links with the health ministry on which authorisations depend • Government to broaden offering • Valuation multiples are high. Opportunities • Capacity for sector consolidation (capacity for additional debt >EUR200m) • Transfer of activity from non-lucrative private sector to commercial private sector • Increase in quality specifications which is good news for main sector players • Pressure on solvency of end clients Threats • Crash in French real estate prices All share prices at 19/05/14. FINANCIAL CALENDAR (Source: Precise) Target Price: EUR 50.00 titre 55 • Strong de-rating of stock is possible as growth will slow. but will generate high leverage on stock price valuation (growing EBITDA, stabilizing net debt). Recommendation: 1) debt is hedged against an increase in rates and is covered by assets approaching EUR3.0bn; 2) property debt corresponds to assets. The group’s strength is still intact and stems from: 1) continued strong organic growth with stable prices and a high occupancy rate); 2) regular acquisitions; 3) the growth from beds under restructuring/construction; 4) high profitability over the long term (operating margin >10% over the long term); 5) the assistance of a banking pool. This will allow the group to post target sales of over EUR2.0bn in 2015. This visibility and the fact that profitability is steady justify a high valuation. The property crisis could create opportunities to return to this stock over the next years or so. FFP 7.1% (5.8%); SOFINA 5.8% (4.8%); PRICE (SHORT & LONG AVERAGE) • . but hidden value of real estate is huge 11/07/2014 Dividend Payment 2013 25/06/2014 AGM 2013 50 45 40 35 30 Christian Auzanneau 25 20 Mar 11 Source : Factset 148 ORPÉA SMALL & MID CAPS SELECTION Analyst(s) Jun 11 Sep 11 Dec 11 Mar 12 Jun 12 Sep 12 Dec 12 Mar 13 Jun 13 Sep 13 Dec 13 Mar 14 Jun 14 +33 4 78 92 01 85 CM - CIC Securities [email protected] Germany SMALL & MID CAPS SELECTION EUR 9.42 Accumulate PATRIZIA AG P1ZGn.DE/P1Z GR Market capitalisation: EUR 594m Financial Services EUR Sales (m) EBITDA (m) EBITDA margin EBIT (m) EBIT margin Net profit (reported) (m) Net profit (adj.) (m) Cash Flow from Ops.bef. chg in NWC (m) Net debt (Cash) (m) Net Debt/Equity Net Debt/EBITDA Interest cover (EBITDA/Fin. interest) ROCE (adj.) ROCE (adj.)/WACC EV / CE EV / Sales EV / EBITDA EV / EBIT P/E (adj.) P/BV OpFCF yield Dividend yield EPS (adj.) EPS (adj.) growth BVPS DPS Abs. Performances(12m,6m,3m,1m): 12 month High/low: EUR9.42 / 6.48 12/12 196 49.2 25.1% 44.7 22.8% 25.4 25.4 0.1 588 1.7 11.9 2.1 0.0% nm 2.2 4.6 18.5 20.3 12.6 1.0 8.5% 0.0% 0.46 79.5% 6.12 0.00 22.2% 12/13 12/14e 12/15e 208 219 210 24.8 23.6 21.9 11.9% 10.8% 10.4% 18.7 16.6 13.9 9.0% 7.6% 6.6% 37.2 40.5 46.2 37.2 40.5 46.2 2.4 31.4 47.1 503 377 270 1.3 0.9 0.6 20.3 16.0 12.3 2.1 2.1 3.8 0.0% 0.0% 0.0% nm nm 3.6 6.3 nm 4.7 4.4 4.1 39.7 41.1 39.4 52.7 58.4 62.3 13.0 14.7 12.9 1.3 1.4 1.3 35.7% 10.5% 10.5% 0.0% 2.0% 3.1% 0.59 0.64 0.73 26.9% 9.0% 14.1% 5.91 6.56 7.29 0.00 0.19 0.29 25.5% 15.4% 14.2% Avg. Daily nb traded shares:186,324 Profile: Patrizia, which was founded by Wolfgang Effer, CEO and majority shareholder, in 1984, used to be a traditional real estate asset manager with a focus on residential real estate. In recent years it has started a strategic reorientation moving from a holder of real estate property to a real estate manager (of both residential and commercial real estate property). As of Dec 2013 Patrizia has EUR 12bn assets under management of which EUR 5.7bn are third parties AuM, EUR 5.6bn Co-Investments and EUR 0.5bn of own investments. The company is operating in 14 European countries. Patrizia intends to completely sell off its remaining own real estate property in the next two years. We forecast Patrizia to increase its operating profit, its key performance indicator, by 36% yoy to EUR 52m, an improving financial result and higher earnings contributions from its Co-Investments being the key earnings drivers. SWOT Analysis Strengths • Extensive market know how Weaknesses • High dependence on German residential market • Well capitalized, low leverage Opportunities • Additional acquisition of real estate portfolios Threats • Rising interest rates lead to lower demand for real estate property • Disposal of own real estate property can be realized at higher prices Main shareholders: First Capital Partner GmbH 51.6%; Free float 48.4% (0.0%); Recommendation: We recommend accumulating the shares with a target price of EUR 10. Firstly we see good earnings growth for 2014e and 2015e, secondly Patrizia’s shift to a real estate management should trigger higher valuation multiples in the mid-term and thirdly PAT should continue to benefit from a growing demand for real estate asset management services. All share prices at 19/05/14. FINANCIAL CALENDAR (Source: Precise) PRICE (SHORT & LONG AVERAGE) Target Price: EUR 10.00 titre 10 9 8 PATRIZIA AG SMALL & MID CAPS SELECTION Analyst(s) 7 6 5 Philipp Häßler, CFA 4 3 2 Mar 11 Jun 11 Sep 11 Dec 11 Mar 12 Jun 12 Sep 12 Dec 12 Mar 13 Jun 13 Sep 13 Dec 13 Mar 14 +49 69 58997 414 Equinet Bank [email protected] Jun 14 Source : Factset 149 Germany SMALL & MID CAPS SELECTION EUR 79.56 Reduce PFEIFFER VACUUM PV.DE/PFV GR Market capitalisation: EUR 785m Industrial Engineering EUR Sales (m) EBITDA (m) EBITDA margin EBIT (m) EBIT margin Net profit (reported) (m) Net profit (adj.) (m) Cash Flow from Ops.bef. chg in NWC (m) Net debt (Cash) (m) Net Debt/Equity Net Debt/EBITDA Interest cover (EBITDA/Fin. interest) ROCE (adj.) ROCE (adj.)/WACC EV / CE EV / Sales EV / EBITDA EV / EBIT P/E (adj.) P/BV OpFCF yield Dividend yield EPS (adj.) EPS (adj.) growth BVPS DPS Abs. Performances(12m,6m,3m,1m): 12 month High/low: EUR99.45 / 77.94 12/12 461 87.5 19.0% 67.7 14.7% 45.3 51.8 81.5 -49.9 -0.2 -0.6 81.6 17.9% 1.9 3.1 1.9 10.0 12.9 17.5 3.3 9.2% 3.8% 5.24 -5.4% 28.07 3.45 -18.8% 12/13 12/14e 12/15e 409 431 458 70.7 77.5 85.2 17.3% 18.0% 18.6% 50.5 57.4 65.3 12.4% 13.3% 14.3% 34.8 39.0 45.1 41.3 45.5 51.6 48.4 61.5 68.3 -53.6 -73.2 -91.3 -0.2 -0.3 -0.3 -0.8 -0.9 -1.1 nm nm nm 15.0% 16.9% 19.1% 1.6 1.8 2.1 3.6 2.8 2.8 2.3 1.7 1.6 13.4 9.5 8.4 18.7 12.8 11.0 23.6 17.2 15.2 3.5 2.7 2.6 4.6% 6.1% 6.3% 3.3% 3.7% 4.3% 4.19 4.61 5.23 -20.2% 10.2% 13.3% 27.97 29.28 30.89 2.65 2.95 3.40 -13.3% -9.4% -3.0% Avg. Daily nb traded shares:15,934 Main shareholders: Free float 96.5%; Hakuto 3.5%; All share prices at 19/05/14. FINANCIAL CALENDAR (Source: Precise) PRICE (SHORT & LONG AVERAGE) titre 100 95 23/05/14 Ex Dividend Date 2013 23/05/14 Dividend Payment 2013 22/05/14 AGM 2013 Profile: Pfeiffer Vacuum (PFV) develops and produces vacuum pumps and systems for various applications. The company was founded in 1890 and emerged as one of the world wide leading players in its domain. A major milestone in its history was achieved through the acquisition of one of its main rivals: thanks to the takeover of Adixen, PFV emerged as the no.2 in its market behind Edwards. We would like to highlight PFV's sector leading expertise in turbo-pumps and Adixen’s special knowledge in dry backing pumps. Besides the mentioned core focus, PFV complements its offerings by devices, gauges and components for analysis of vacuum and gases as well as valves and vacuum chambers. SWOT Analysis Strengths • World leader in turbo-pumps and dry backing pumps • Tubo-pump EBIT margin probably still around 25-30% • Net debt-free balance sheet Opportunities • Cross-selling/synergies from Adixen takeover Weaknesses • High share of turns business, thus limited visibility in general • Exposure to cyclical industries has increased as a consequence of the Adixen takeover • Adixen dilutes the group margin • Up-selling vacuum systems Threats • Price pressure at lower margin products (e.g. backing pumps) • USD sensitivity • Further acquisitions • Market share losses as PFV favours price over volume Recommendation: Before the takeover of Adixen, PFV – being a product company – had operating margins of around 25%. Still, adj. EBIT margins are solid at around 10-13% after the consolidation of the acquisition. However, the revenue profile has become more volatile as largely through the acquisition of the French vacuum specialist, PFV generates now more than a third of sales with semiconductor customers. Still, relative revenue stability is however provided by R&D and analytical markets (together c. 30% of group sales) as well as partly by industrial segments. However, in our opinion, the proof of concept as regards the synergy realisation is still missing and we do not believe that the company can return to a 20% EBIT margin as desired by the management too soon. Due to its rich valuation (P/E’14e of c. 17x), we rate the stock a ‘Reduce’. Target Price: EUR 79.00 90 85 80 75 70 65 60 Mrz 11 Source : Factset 150 Jun 11 Sep 11 Dez 11 Mrz 12 Jun 12 Sep 12 Dez 12 Mrz 13 Jun 13 Sep 13 Dez 13 Mrz 14 Jun 14 PFEIFFER VACUUM SMALL & MID CAPS SELECTION Analyst(s) Adrian Pehl, CFA +49 69 58997 438 Equinet Bank [email protected] Italy SMALL & MID CAPS SELECTION EUR 2.70 Hold PIAGGIO PIA.MI/PIA IM Market capitalisation: EUR 973m Automobiles & Parts EUR Sales (m) EBITDA (m) EBITDA margin EBIT (m) EBIT margin Net profit (reported) (m) Net profit (adj.) (m) Cash Flow from Ops.bef. chg in NWC (m) Net debt (Cash) (m) Net Debt/Equity Net Debt/EBITDA Interest cover (EBITDA/Fin. interest) ROCE (adj.) ROCE (adj.)/WACC EV / CE EV / Sales EV / EBITDA EV / EBIT P/E (adj.) P/BV OpFCF yield Dividend yield EPS (adj.) EPS (adj.) growth BVPS DPS Abs. Performances(12m,6m,3m,1m): 12 month High/low: EUR2.98 / 1.88 12/12 1,406 176 12.5% 96.6 6.9% 42.0 42.0 122 391 0.9 2.2 6.1 7.4% 1.0 1.4 0.8 6.8 12.3 18.0 1.7 2.0% 4.5% 0.11 -10.5% 1.18 0.09 22.7% 12/13 12/14e 12/15e 1,213 1,322 1,458 147 170 195 12.1% 12.9% 13.4% 62.6 86.2 108 5.2% 6.5% 7.4% -6.6 30.8 45.1 -6.6 30.8 45.1 77.6 -1.6 132 476 468 449 1.2 1.1 1.0 3.2 2.8 2.3 4.5 4.8 5.7 5.0% 6.3% 7.8% 0.7 0.9 1.1 1.5 1.6 1.6 1.1 1.1 1.0 9.5 8.8 7.6 22.2 17.3 13.6 nm 31.6 21.6 2.2 2.3 2.2 -7.0% -10.5% 3.3% 0.0% 1.9% 2.8% -0.02 0.09 0.12 -chg +chg 46.3% 1.08 1.17 1.24 0.00 0.05 0.08 21.3% 22.9% -3.9% Avg. Daily nb traded shares:1,075,640 Main shareholders: IMMSI 50.6%; Free float 38.7%; Della Valle Diego 5.5%; Financière de l'Echiquier 5.1%; All share prices at 19/05/14. FINANCIAL CALENDAR (Source: Precise) PRICE (SHORT & LONG AVERAGE) titre 3.0 2.8 2.6 2.4 Profile: PIA is the biggest European 2/3 wheel vehicle manufacturer. In 2013, PIA sold ~352 K 2 wheelers (~-13% Y/Y) and ~204 K light commercial vehicles (-2.6% Y/Y); the group recorded ~11% of its FY13 revenues in Italy, ~36% in the rest of Europe, ~6% in North America, ~26% in India, ~10% in Vietnam and ~10% in the rest of the world. PIA has strengthened its operations in India and Vietnam: it has built a diesel engine plant and started assembling the “Vespa” in India (production capacity: 150 K units/year) and it is in the process to doubling the current Vietnamese production capacity (100 K units/year) to further penetrate East-Asia countries. PIA is targeting to increase its sales to ~800 K units by 2017 (CAGR of 9.5%) with Europe, Far East Asia and Indian sales of two and four wheelers contributing for ~60 K additional units each. The company aims at increasing its top line to EUR 1.75bn, its EBITDA to EUR 250m and the bottom line to EUR 70m. SWOT Analysis Strengths • Full range of 2/3 wheelers Weaknesses • The EU market weighs for ~53% of revenues • Good brand portfolio • Japanese competitors are bigger and stronger • Consolidated positioning in India, Vietnam • Reliability is in some cases still an issue Opportunities • Global sourcing initiatives Threats • Korean and Chinese manufacturers’ competition • The Vespa brand can be exploited further • European market is falling for the 5th year in a row • Further expansion in the ASEAN area Recommendation: PIA recorded revenues of EUR 1.2bn in 2013 (~-14% Y/Y), with a ~EUR 147m EBITDA (~-17% Y/Y) and a ~EUR 18m adjusted net profit (-57% Y/Y); the NFP reached EUR -476m (EUR -392m as at the end of 2012). PIA European revenues were down ~22% Y/Y in 2013; they were up ~4% Y/Y in India, they grew 10% Y/Y in the USA and they fell ~10% Y/Y in Far East Asia; PIA preserved its EBITDA margin which came in at ~12.1% (-0.4 p.ps). Q1 2014 results showed the first signs of a recovery in Europe after 5 years of crisis, while Indian and the Far East Asia sales were down 16% and 19% Y/Y respectively; we are assuming that PIA's Italian and Rest of Europe sales will grow 10% Y/Y in 2014 while we see the Indian and Far East Asia sales to grow by 15% and 10% respectively. We value PIA on the basis of a DCF which gives us a EUR 2.50 target price. We argue that much of the European recovery is factored in the price and that weaker-than-expected results in India/Far east Asia may offset such growth. Target Price: EUR 2.50 2.2 2.0 1.8 1.6 Mar 11 Source : Factset Jun 11 Sep 11 Dec 11 Mar 12 Jun 12 Sep 12 Dec 12 Mar 13 Jun 13 Sep 13 Dec 13 Mar 14 Jun 14 PIAGGIO SMALL & MID CAPS SELECTION Analyst(s) Gabriele Gambarova +39 02 43 444 289 Banca Akros [email protected] 151 Finland SMALL & MID CAPS SELECTION EUR 21.10 Reduce PKC GROUP PKC1V.HE/PKC1V FH Market capitalisation: EUR 504m Electronic & Electrical Equipment EUR Sales (m) EBITDA (m) EBITDA margin EBIT (m) EBIT margin Net profit (reported) (m) Net profit (adj.) (m) Cash Flow from Ops.bef. chg in NWC (m) Net debt (Cash) (m) Net Debt/Equity Net Debt/EBITDA Interest cover (EBITDA/Fin. interest) ROCE (adj.) ROCE (adj.)/WACC EV / CE EV / Sales EV / EBITDA EV / EBIT P/E (adj.) P/BV OpFCF yield Dividend yield EPS (adj.) EPS (adj.) growth BVPS DPS Abs. Performances(12m,6m,3m,1m): 12 month High/low: EUR26.21 / 17.60 12/12 928 74.7 8.1% 43.5 4.7% 24.0 24.0 57.9 111 0.7 1.5 12.8 13.9% 2.1 1.7 0.4 5.5 9.4 13.9 2.1 21.0% 3.9% 1.12 -5.1% 7.34 0.60 4.2% 12/13 12/14e 12/15e 886 847 944 64.1 63.0 85.5 7.2% 7.4% 9.1% 30.5 36.3 62.8 3.4% 4.3% 6.7% 14.0 24.8 40.6 14.0 24.8 40.6 49.8 51.9 63.3 30.4 25.2 -2.0 0.2 0.1 0.0 0.5 0.4 0.0 9.6 13.4 17.8 11.5% 13.5% 23.9% 1.7 2.0 3.6 2.9 2.5 2.4 0.7 0.6 0.5 9.1 8.1 5.6 19.3 14.0 7.6 41.5 20.3 12.4 2.7 2.4 2.2 7.7% 4.3% 9.0% 3.3% 3.6% 3.8% 0.58 1.04 1.70 -47.8% 78.1% 63.4% 9.04 8.83 9.77 0.70 0.75 0.80 -12.6% -5.6% -4.6% Avg. Daily nb traded shares:30,756 Main shareholders: Free float 100.0%; Keskinäinen Eläkevakuutusyhtiö Ilmarinen 10.2%; As Harju Elekter 6.4%; Profile: PKC Group is a global designer and contract manufacturer of wiring systems and electronics. The group provides its products and services to the commercial vehicle, automotive and electronics industries. The operations are split into two business areas: Wiring Systems (93% of total sales) and Electronics (EMS). The group's manufacturing facilities on four different continents provide a comprehensive service and production network. PKC employs some 18,800 people. In 2013, South and North America accounted for 65% and Europe for 32% of PKC's sales. In the coming years, Asia will contribute more to PKC's sales. As a leading global designer and manufacturer of electrical distribution systems for trucks, PKC serves all the six leading Western truck OEM groups. The business competes with, for instance, Yazaki, Delphi, Stoneridge and Leoni. The Electronics business offers electronics contract design and manufacturing services for the automotive, electronics and energy industries. Electronics is in fact a non-core business with no strategic value for PKC. SWOT Analysis Strengths • Specialises in the provision of wiring harnesses to heavy commercial vehicles, which enables optimisation of to fit customer needs •production Close customer relationships with large commercial vehicle manufacturers Weaknesses • Relatively small company compared to competitors Opportunities • Truck sector integration opens up opportunities to win new customers • Customers outside the truck industry (e.g. off-road machinery) • Joint venture with Sinotruk Threats • Tightening competition especially from Asia OP-Focus-erikoissijoitusrahasto 3.2%; • Deepening of the European debt crisis could push the truck market's recovery forward • Realignments in customer industries may affect component suppliers as well Recommendation: The company is expecting 2014 sales and comparable EBITDA to be lower than in 2013. This year, profitability will be burdened by the reorganisation of European operations and production transfers, in addition to weak sales. 2014 will be a stressful year for PKC. All share prices at 19/05/14. Target Price: EUR 22.00 FINANCIAL CALENDAR (Source: Precise) PRICE (SHORT & LONG AVERAGE) titre 30 07/08/14 Results 28 26 24 22 20 16 14 12 10 Mar 11 152 PKC GROUP SMALL & MID CAPS SELECTION Analyst(s) Hannu Rauhala 18 Source : Factset 2014Q2 Jun 11 Sep 11 Dec 11 Mar 12 Jun 12 Sep 12 Dec 12 Mar 13 Jun 13 Sep 13 Dec 13 Mar 14 Jun 14 +358 10 252 4392 Pohjola [email protected] Portugal SMALL & MID CAPS SELECTION EUR 3.42 Accumulate PORTUCEL PTI.LS/PTI PL Market capitalisation: EUR 2626m Basic Resources EUR Sales (m) EBITDA (m) EBITDA margin EBIT (m) EBIT margin Net profit (reported) (m) Net profit (adj.) (m) Cash Flow from Ops.bef. chg in NWC (m) Net debt (Cash) (m) Net Debt/Equity Net Debt/EBITDA Interest cover (EBITDA/Fin. interest) ROCE (adj.) ROCE (adj.)/WACC EV / CE EV / Sales EV / EBITDA EV / EBIT P/E (adj.) P/BV OpFCF yield Dividend yield EPS (adj.) EPS (adj.) growth BVPS DPS Abs. Performances(12m,6m,3m,1m): 12 month High/low: EUR3.56 / 2.24 12/12 1,502 385 25.7% 286 19.1% 211 211 310 275 0.2 0.7 23.9 10.2% 1.3 1.0 1.3 5.3 7.1 8.3 1.1 14.8% 6.5% 0.28 7.6% 2.04 0.22 28.6% 12/13e 12/14e 12/15e 1,492 1,359 1,357 333 289 283 22.3% 21.3% 20.9% 231 188 181 15.5% 13.9% 13.4% 181 121 113 181 121 113 283 222 215 225 271 296 0.1 0.2 0.2 0.7 0.9 1.0 17.2 17.1 13.6 8.6% 7.1% 6.9% 1.1 0.9 0.9 1.2 1.5 1.5 1.6 2.1 2.2 7.4 10.0 10.3 10.6 15.4 16.1 12.4 21.7 23.2 1.4 1.8 1.8 11.7% 5.8% 5.0% 8.0% 7.6% 6.0% 0.24 0.16 0.15 -14.5% -33.1% -6.2% 2.02 1.92 1.86 0.27 0.26 0.20 18.9% 9.5% 7.9% Avg. Daily nb traded shares:308,254 Main shareholders: Semapa 75.9% (80.8%); Free float 24.1% (19.2%); Profile: Portucel Group is one of the largest producers of uncoated fine paper in Europe. The group holds a strong position in the office paper market and has a leading position in graphic papers in Europe. Its value chain extends from forest to pulp and paper production, sheeting, and merchant operations. The company invested in a new paper machine of 500 Kton per year in its Setúbal mill. This new investment should allow the company to significantly strengthen its competitiveness in the paper market. Portucel is one of the most interesting listed companies in the Portuguese equity market in terms of profitability and strength of its balance sheet. The need for cash of its main shareholder (Semapa) means that minorities have an extra bonus of high-end dividend yields at current market prices. With limited capex needs in the medium term, the company should be able to generate a very substantial level of cash flow going forward that, in our view, will not be entirely translated into a similar decrease of net debt given high dividend distribution. SWOT Analysis Strengths • State-of-the-art assets Weaknesses • Structural imbalance between demand and supply • Operating margins above European peers • Heavily dependent on economic cycle • Brand recognition Opportunities • Further cost cutting • USD devaluation has a negative effect on the European producers competitiveness • Increase of some raw materials prices (wood and chemicals) Threats • Economic slowdown • Biomass business • Further devaluation of the USD • Greenfield pulp business outside Europe • Strong and rising competition • Access to high quality raw materials • Capacity closure and price power All share prices at 19/05/14. FINANCIAL CALENDAR (Source: Precise) PRICE (SHORT & LONG AVERAGE) Recommendation: Our YE2014 fair value stands at EUR 3.50 per share with a Accumulate recommendation. titre 3.6 21/05/14 AGM 3.4 Target Price: EUR 3.50 2013 3.2 3.0 2.8 2.6 Analyst(s) 2.4 2.2 2.0 1.8 1.6 mar 11 jun 11 set 11 dez 11 mar 12 jun 12 set 12 dez 12 mar 13 jun 13 set 13 dez 13 mar 14 jun 14 Carlos Jesus Artur Amaro Caixa-Banco de Investimento +351 21 389 6812 +351 213 89 6822 [email protected] [email protected] Source : Factset 153 Germany SMALL & MID CAPS SELECTION EUR 12.30 Hold PSI PSAG.DE/PSA2 GY Market capitalisation: EUR 193m Software & Computer Services EUR Sales (m) EBITDA (m) EBITDA margin EBIT (m) EBIT margin Net profit (reported) (m) Net profit (adj.) (m) Cash Flow from Ops.bef. chg in NWC (m) Net debt (Cash) (m) Net Debt/Equity Net Debt/EBITDA Interest cover (EBITDA/Fin. interest) ROCE (adj.) ROCE (adj.)/WACC EV / CE EV / Sales EV / EBITDA EV / EBIT P/E (adj.) P/BV OpFCF yield Dividend yield EPS (adj.) EPS (adj.) growth BVPS DPS Abs. Performances(12m,6m,3m,1m): 12 month High/low: EUR15.74 / 11.40 12/12 181 16.9 9.4% 12.9 7.1% 9.4 9.4 10.0 -24.0 -0.3 -1.4 9.8 8.4% 0.9 2.4 1.4 15.2 19.9 25.7 3.3 -1.5% 1.9% 0.60 27.7% 4.69 0.30 -17.9% 12/13 176 8.0 4.5% 4.2 2.4% 0.4 0.4 2.7 -14.9 -0.2 -1.9 5.0 2.7% 0.3 2.2 1.3 29.8 57.1 nm 3.2 -2.1% 0.0% 0.02 -96.7% 4.29 0.00 -1.1% 12/14e 12/15e 189 200 16.5 19.3 8.7% 9.7% 12.5 15.4 6.6% 7.7% 8.4 10.8 8.4 10.8 13.0 14.9 -22.0 -26.1 -0.3 -0.3 -1.3 -1.3 9.7 12.0 7.9% 9.5% 0.9 1.1 1.9 1.8 1.1 1.0 12.8 10.7 16.9 13.4 22.8 17.8 2.5 2.4 3.7% 4.5% 2.4% 2.8% 0.54 0.69 nm 27.8% 4.83 5.21 0.30 0.35 -14.0% -5.1% Avg. Daily nb traded shares:9,475 Profile: PSI AG, founded in 1969, offers software and solutions for the management of large networks. Solutions and software for the control of energy networks such as electricity, gas, oil, water, and heat are provided in Energy Management. Expected strong demand for grid management applications on the back of the so-called Energiewende in Germany may spur future growth. Production management focuses on steel, mechanical engineering, automotive as well as logistics. We expect the segment to turn-around from pilot project cost overruns in 2013 and to benefit from a strong global market position and a unified production platform. The Infrastructure Management division combines solutions for telecommunications and transport. SWOT Analysis Strengths • High quality product Weaknesses • Disappointing company history and low confidence • Successful entry and expansion of export markets like Russia, China, other Asian countr. • Rising share of high-margin recurring revenues • Cost overruns in pilot projects • Platform consolidation finished, lifts economy of scale effects Opportunities • Strategy to grow through export and increasingly focus on license sales instead of services • Target to become leading player, charging higher margins • Low sales/employee ratio • Smart grid expansion • Further increasing working capital needs due to export strategy • Comparably low margins for a software company Threats • IT/power/gas grid capex slowdown • Dependence on partner to succeed in export markets • Supportive grid regulation Main shareholders: Free float 60.2% (0.0%); RWE 17.8%; Employees 9.4%; Harvinder Singh 8.1%; AGI 4.5%; All share prices at 19/05/14. FINANCIAL CALENDAR (Source: Precise) PRICE (SHORT & LONG AVERAGE) Recommendation: PSI’s strong market position leaves the company perfectly prepared to go for ample add-on revenue potential in upcoming years related to the overhaul of Germany’s grid infrastructure along the lines of expanded renewable energy feed-in. However, visibility of future sales growth in the German energy market is still weak on deferred planning and implementation processes. Hence, we expect PSI shares to trade around the current level as valuation already digested a lot. HOLD titre 24 Target Price: EUR 13.50 22 20 18 PSI SMALL & MID CAPS SELECTION Analyst(s) 16 14 12 10 Mar 11 Source : Factset 154 Jun 11 Sep 11 Dec 11 Mar 12 Jun 12 Sep 12 Dec 12 Mar 13 Jun 13 Sep 13 Dec 13 Mar 14 Jun 14 Michael Schaefer +49 69 58997 419 Equinet Bank [email protected] Finland SMALL & MID CAPS SELECTION EUR 4.16 Buy RAISIO RAIVV.HE/RAIVV FH Market capitalisation: EUR 654m Food & Beverage EUR Sales (m) EBITDA (m) EBITDA margin EBIT (m) EBIT margin Net profit (reported) (m) Net profit (adj.) (m) Cash Flow from Ops.bef. chg in NWC (m) Net debt (Cash) (m) Net Debt/Equity Net Debt/EBITDA Interest cover (EBITDA/Fin. interest) ROCE (adj.) ROCE (adj.)/WACC EV / CE EV / Sales EV / EBITDA EV / EBIT P/E (adj.) P/BV OpFCF yield Dividend yield EPS (adj.) EPS (adj.) growth BVPS DPS Abs. Performances(12m,6m,3m,1m): 12 month High/low: EUR5.03 / 3.31 12/12 584 48.2 8.3% 31.6 5.4% 11.9 22.0 44.3 15.0 0.0 0.3 high 7.5% 1.2 1.4 0.9 10.4 15.9 22.4 1.5 -1.1% 3.9% 0.14 -1.5% 2.04 0.12 17.2% 12/13 12/14e 12/15e 557 545 562 48.7 51.7 58.3 8.7% 9.5% 10.4% 33.7 36.7 43.3 6.0% 6.7% 7.7% 26.3 27.9 33.4 26.3 27.9 33.4 42.8 44.4 49.7 -28.6 -34.7 -46.6 -0.1 -0.1 -0.1 -0.6 -0.7 -0.8 high high high 9.7% 9.4% 10.7% 1.5 1.5 1.7 2.1 2.0 1.9 1.2 1.1 1.1 13.7 11.9 10.3 19.7 16.7 13.9 26.5 23.4 19.6 2.1 1.9 1.9 8.7% 4.3% 5.5% 3.1% 3.4% 3.6% 0.16 0.18 0.21 19.9% 7.9% 19.6% 2.07 2.15 2.22 0.13 0.14 0.15 -3.7% -14.2% -8.4% Avg. Daily nb traded shares:65,310 Profile: Raisio is a food company that focuses on plant-based nutrition. Brands, the food industry business, accounts for more than half of sales and Raisioagro, the feed and farming supplies segment, for less than half. The main markets are Finland, the UK, Sweden, Russia, Ukraine, Poland, Estonia and the Czech Republic. The company’s strategic objective is to grow organically and through acquisitions, emphasising health, ecology and food suited to mobile lifestyle in the breakfast and snack categories. The main brands on the food industry side are Benecol, Elovena, Sunnuntai, Honey Monster, Nordic, Fox's, Poppets and Juicee Gummee. On the animal feed side, company's flagship brand/innovation is dairy feed Benemilk. SWOT Analysis Strengths • Strong brands Weaknesses • Small company that has less marketing resources than its competitors • Two share series, with raw material producers and their representatives owning the voting shares • Able and highly committed management • Innovative research and development • Strong balance sheet Opportunities • Internationalisation of dairy feed innovation Benemilk Threats • Failure of the international commercialisation of Benemilk • Growth opportunities of cholesterol-lowering Benecol products • Combination of the share series • Failure of the acquisition strategy • Reduction of livestock production in Finland and the impact of this on demand for feed • Demerger of Brands and Agro into separate companies in the long term Main shareholders: Free float 97.5%; Keskinäinen Eläkevakuutusyhtiö Ilmarinen 3.3%; Reso Management Oy 2.7%; Central Union of Agricultural Producers and Forest Owners (MTK) 2.5%; All share prices at 19/05/14. FINANCIAL CALENDAR (Source: Precise) PRICE (SHORT & LONG AVERAGE) titre 5.0 12/08/14 Results 4.5 Recommendation: The primarily Benemilk-driven investment story gained more support from the Q1 report. Raisio and its partner Intellectual Ventures have been on a roadshow marketing a licensing partnership to many potential partners around the world. The dairy feed innovation has been very well received and has attracted great attention. At the moment, the biggest question is when will we hear further chapters of the story, in other words, some patent and licensing news. We believe this could still take a couple of quarters. The declined share price appears highly attractive because Benemilk Ltd’s project potential, now moderately priced in, and the outstanding balance sheet offer attractive upside. 2014H1 Target Price: EUR 5.50 4.0 3.5 RAISIO SMALL & MID CAPS SELECTION Analyst(s) 3.0 2.5 2.0 1.5 Mar 11 Source : Factset Jun 11 Sep 11 Dec 11 Mar 12 Jun 12 Sep 12 Dec 12 Mar 13 Jun 13 Sep 13 Dec 13 Mar 14 Jun 14 Niclas Catani +358 10 252 8780 Pohjola [email protected] 155 France SMALL & MID CAPS SELECTION EUR 36.57 Buy RALLYE GENC.PA/RAL FP Market capitalisation: EUR 1781m Food & Drug Retailers EUR Sales (m) EBITDA (m) EBITDA margin EBIT (m) EBIT margin Net profit (reported) (m) Net profit (adj.) (m) Cash Flow from Ops.bef. chg in NWC (m) Net debt (Cash) (m) Net Debt/Equity Net Debt/EBITDA Interest cover (EBITDA/Fin. interest) ROCE (adj.) ROCE (adj.)/WACC EV / CE EV / Sales EV / EBITDA EV / EBIT P/E (adj.) P/BV OpFCF yield Dividend yield EPS (adj.) EPS (adj.) growth BVPS DPS Abs. Performances(12m,6m,3m,1m): 12 month High/low: EUR38.40 / 25.90 12/12 42,663 3,246 7.6% 2,371 5.6% 313 313 2,423 8,641 0.6 2.7 4.6 12/13e 50,490 3,344 6.6% 2,302 4.6% -15.4 -15.4 2,065 8,828 0.6 2.6 4.9 4.0 0.7 161% 5.0% 6.43 nm 37.48 1.83 16.1% 12/14e 53,884 3,707 6.9% 2,593 4.8% 30.4 30.4 2,401 8,547 0.6 2.3 5.6 12/15e 56,890 4,024 7.1% 2,846 5.0% 68.6 68.6 2,648 8,112 0.5 2.0 6.4 nm nm 26.0 0.9 1.1 1.1 28.7% 22.2% 34.2% 5.0% 5.0% 5.0% -0.32 0.62 1.41 -chg +chg 125.6% 35.36 34.15 33.73 1.83 1.83 1.83 16.0% 18.2% 5.5% Avg. Daily nb traded shares:64,186 Main shareholders: FonciŠre Euris 56.1% (71.1%); Free float 42.7% (28.9%); Autocontr“le 1.2% (0.0%); All share prices at 19/05/14. FINANCIAL CALENDAR (Source: Precise) PRICE (SHORT & LONG AVERAGE) titre 40 30/07/14 Results 38 2014H1 36 34 21/05/14 Dividend Payment 32 2013 Profile: Rallye is the holding company that controls Casino, in which it owns 49.0% of the ordinary shares (and 59.3% of the voting rights). Rallye is controlled by Foncière Euris (which owns 55.6% of shares and 72.2% of voting rights). Rallye’s gross assets (before holding company debt) essentially comprise the stake in Casino (94% of gross assets), the stake in Go Sport (1% of gross assets) and financial investments (property, LBO funds) estimated by the company at EUR257m (5% of gross assets). SWOT Analysis Strengths • Leading player in convenience in France & leading food retailer in emerging countries • Well diversified portfolio of business units per countries & per format • Control of complementary banners, allowing the group to maximise its market share Opportunities • Convenience: favourable demographic trends • Huge potential in some emerging countries: Brazil, Colombia, Thailand, Vietnam, etc. • Strong ambition and opportunities in E-commerce Weaknesses • Dilemma as regards G‚ant hypermarkets in France. • Dilemma as regard Leader Price hard discount in France • Complex structure of ownership of the brazilian assets Threats • Performance of store banners in an adverse climate (economy, maturity of hard discounters) • Spreading of price war (unlikely) to the convenience segment • Substantial financial leverage Recommendation: The traditional investment case on the Rallye share rests on two pillars: 1) Rallye is a high-yield stock, and 2) whether or not it trades at an attractive discount in relation to its restated net asset value. The reasoning behind the classic Rallye investment case needs dusting off. We have opted to examine how Rallye’s cash-flow statement could be returned to balance. The Rallye holding company’s inflows (primarily the dividends paid by Casino) do not cover its outflows (interest charges, operating costs and its dividend), nor have they for some time. Over the long term, this imbalance explains why Rallye’s share has underperformed that of Casino. Our view on Rallye is correlated with our take on Casino. In our 2012 October report on Casino we stressed the company’s ability to generate an increasing amount of free cash flow, earnings and thus dividends (on a constant pay-out). The increase of the Casino dividend received by Rallye would thus make a steady contribution to balancing the holding company’s inflows and outflows. The expected re-balancing will enable the leverage effect to function once again. In our simulation table, we have projected a return to balance of Rallye’s cash-flow statement in 2018 and factored in the current value of the deficit over the next five years at our ‘target’ NAV. Target Price: EUR 38.40 30 28 26 24 22 20 Mar 11 Source : Factset 156 Jun 11 Sep 11 Dec 11 Mar 12 Jun 12 Sep 12 Dec 12 Mar 13 Jun 13 Sep 13 Dec 13 Mar 14 Jun 14 Analyst(s) Christian Devismes CM - CIC Securities +33 1 45 96 77 63 [email protected] Finland SMALL & MID CAPS SELECTION EUR 7.28 Buy RAMIRENT RMR1V.HE/RMR1V FH Market capitalisation: EUR 791m Materials, Construction & Infrastructure EUR Sales (m) EBITDA (m) EBITDA margin EBIT (m) EBIT margin Net profit (reported) (m) Net profit (adj.) (m) Cash Flow from Ops.bef. chg in NWC (m) Net debt (Cash) (m) Net Debt/Equity Net Debt/EBITDA Interest cover (EBITDA/Fin. interest) ROCE (adj.) ROCE (adj.)/WACC EV / CE EV / Sales EV / EBITDA EV / EBIT P/E (adj.) P/BV OpFCF yield Dividend yield EPS (adj.) EPS (adj.) growth BVPS DPS Abs. Performances(12m,6m,3m,1m): 12 month High/low: EUR10.18 / 6.50 12/12 714 210 29.4% 92.3 12.9% 63.6 63.6 182 239 0.7 1.1 22.3 10.3% 1.2 1.3 1.3 4.3 9.8 10.7 1.9 2.5% 5.4% 0.59 42.7% 3.33 0.34 -1.6% 12/13 12/14e 12/15e 647 623 664 196 185 219 30.4% 29.6% 33.0% 83.7 77.1 106 12.9% 12.4% 16.0% 55.9 50.1 69.7 55.9 50.1 69.7 169 158 183 207 206 198 0.6 0.5 0.5 1.1 1.1 0.9 10.7 15.2 16.8 10.6% 9.6% 12.8% 1.2 1.1 1.5 1.9 1.6 1.5 1.8 1.5 1.4 5.9 5.2 4.3 13.9 12.4 9.0 17.8 15.8 11.4 2.7 2.1 1.9 9.3% 3.6% 4.6% 5.1% 5.5% 6.9% 0.51 0.46 0.64 -12.2% -10.3% 39.1% 3.41 3.50 3.74 0.37 0.40 0.50 -21.0% -18.7% -7.1% Avg. Daily nb traded shares:125,814 Main shareholders: Free float 71.0%; Nordstjernan AB 29.3%; Oy Julius Tallberg Ab 11.0%; Varma Mutual Pension Insurance Co 6.8%; All share prices at 19/05/14. FINANCIAL CALENDAR (Source: Precise) PRICE (SHORT & LONG AVERAGE) Profile: Ramirent is the leading equipment rental company in the Nordic and CEE countries, offering a wide range of machinery and equipment rental services to construction and installation companies, customers in the industrial, shipyard and public sectors, and households. In the Nordic countries, the equipment rental market has historically grown by twice the rate for construction volumes. As a market leader in most of the operating markets, Ramirent has captured faster growth than the equipment rental market. The long-term growth driver for the equipment rental market is increasing rental penetration. The market growth potential is significant as the market is developing towards the 80% penetration rate prevailing in the UK. In the Nordic countries, the penetration rate is currently between 30– 40% and in Eastern Europe around 10%. Increasing rental penetration is driven by the benefits of rental, including release of capital, cost efficiency due to better capacity utilisation, no maintenance costs, better access to equipment as well as higher safety. SWOT Analysis Strengths • Market leader in e.g. Finland, Norway, Denmark, and Poland • Strong balance sheet Weaknesses • The business is a derivative of the construction market • Track record of above-industry average profitability Opportunities • Balance sheet allows acquisitions Threats • Weakening of the construction cycle • Growth in equipment rental penetration continuing for several years • Favourable construction cycle extending over several years Recommendation: The share trades with a EUR 0.65 extraordinary dividend, which is still conditional on the BoD’s approval and which, if paid, would deliver a 14% yield over the next 12 months with our ordinary dividend forecast for next spring. Valuation is also at the over-the-cycle-level and allows multiple expansion if the growth outlook for 2015 strengthens later this year like we believe. Our target price is based on our 2015 EBITDA forecast and the 10-year median EV/EBITDA valuation of 5.5. Target Price: EUR 9.50 titre 11 10 9 RAMIRENT SMALL & MID CAPS SELECTION Analyst(s) 8 7 6 Matias Rautionmaa 5 4 Mar 11 Jun 11 Sep 11 Dec 11 Mar 12 Jun 12 Sep 12 Dec 12 Mar 13 Jun 13 Sep 13 Dec 13 Mar 14 +358 10 252 4408 Pohjola [email protected] Jun 14 Source : Factset 157 Italy SMALL & MID CAPS SELECTION EUR 1.45 Accumulate RCS MEDIAGROUP RCSM.MI/RCS IM Market capitalisation: EUR 728m Media EUR Sales (m) EBITDA (m) EBITDA margin EBIT (m) EBIT margin Net profit (reported) (m) Net profit (adj.) (m) Cash Flow from Ops.bef. chg in NWC (m) Net debt (Cash) (m) Net Debt/Equity Net Debt/EBITDA Interest cover (EBITDA/Fin. interest) ROCE (adj.) ROCE (adj.)/WACC EV / CE EV / Sales EV / EBITDA EV / EBIT P/E (adj.) P/BV OpFCF yield Dividend yield EPS (adj.) EPS (adj.) growth BVPS DPS Abs. Performances(12m,6m,3m,1m): 12 month High/low: EUR2.49 / 1.10 12/12 1,598 1.3 0.1% -525 nm -509 -40.4 -418 846 4.7 651 high -23.6% -3.1 1.2 1.5 nm nm nm 13.2 -27.3% 0.0% -0.10 -chg 0.32 0.00 -34.4% 12/13 12/14e 12/15e 1,315 1,345 1,401 -82.9 50.2 151 nm 3.7% 10.8% -201 -19.8 82.9 nm nm 5.9% -219 -50.5 33.7 -124 -30.6 30.9 -137 23.6 108 476 446 421 1.4 1.5 1.3 -5.7 8.9 2.8 nm 1.7 5.4 -5.0% 1.3% 3.7% -0.7 0.2 0.5 0.6 0.7 0.7 0.7 0.8 0.7 nm 20.5 6.6 nm nm 12.1 nm nm 21.3 2.0 2.6 2.3 -29.7% 8.1% 3.3% 0.0% 0.0% 0.0% -0.27 -0.07 0.07 -chg +chg +chg 0.66 0.55 0.63 0.00 0.00 0.00 8.8% -7.6% -12.0% Avg. Daily nb traded shares:2,437,267 Profile: RCS is a leading Italian publishing group, namely: a) Newspapers: Italy #1 generalist and sport, free press title (37% group sales in 2013); b) Magazines: 9 weekly, 22 monthly (10% sales); c) books publishing (19% sales); d) television content production (1% sales). Presence in the Spanish market with #3 newspapers (28% sales). In February 07, RCS acquired the Spanish media group Recoletos for EUR 1.1bn (13.8x EV/EBITDA 06). The financial effort implied by the deal, along with the macro-economic crisis and the secular dynamics of the publishing industry put the company balance sheet under pressure. Restructuring. In May 2012, RCS AGM appointed a new BoD, a new chairman Mr. Provasoli and a new CEO Mr. Scott Jovane, former CEO of Microsoft.. Industrial targets. In Dec 2012 RCS presented the economic guidelines of the new 2013/15 plan. The main assumptions included a strong growth in digital activities and a new savings worth EUR 100m. Financial plan. In April 2013, RCS approved its financial package which included EUR 400m share issue, and a EUR 575m bank refinancing. Asset disposal.. In April 2011, RCS sold the consumer division of its Dada subsidiary to Buongiorno for EUR 32m. In August 2012, RCS sold the French publisher Flammarion for EUR 251m. The residual B2B activities of Dada were sold in July 2013 to Sawiris (EUR 60m impact). The company HQ was sold to Blackstone in December for EUR 120m. FY 2013 results were broadly in line with our estimates and the plan targets on an underlying basis. While the revenue performance fell short of the original estimates, the acceleration in cost savings allowed the co to meet the adjusted EBITDA target. In detail, revenues fell by 13% vs. the last projection of -10/12% (and the original plan indication of high-single-digit decline). Cost cutting was EUR 92m (EUR 30m in Q4), implying EUR 10m higher efficiencies against the plan. The EBITDA was positive as promised and strongly up Y/Y in Q4; however it slightly missed the plan target mainly due to RCS Sport. Net debt was in line with expectations and sharply down Y/Y in virtue of the EUR 410m capital increase and the real estate disposal. Other corporate action. In March 2014 the BoD proposed the conversion of the outstanding savings shares (category “A” and “B”) in ord shares according to either a voluntary or mandatory scheme. Following the unwinding of the shareholders pact and the willingness of Intesa and Mediobanca to dispose of their stakes, we believe the current control structure of RCS looks unstable with the 21% relative majority of FIAT challenged by Della Valle (9% stake), probably teaming up with Cairo (3.7%). SWOT Analysis Strengths • Leading titles in Italian newspapers • Strong presence in several verticals • International projection Weaknesses • Still fragile balance sheet • Governance issues Opportunities • Digitalization • Cost-cutting Threats • Secular trend in print • Fragmentation in on-line Main shareholders: Free float 41.7%; FIAT 20.6%; Mediobanca 9.9%; Della Valle 9.0%; Intesa 6.5%; All share prices at 19/05/14. FINANCIAL CALENDAR (Source: Precise) PRICE (SHORT & LONG AVERAGE) titre 5.5 Recommendation: Following the RCS investor Day on March 13, we increased our TP to EUR 1.85 and moved our Recommendation to Accumulate. The stock is clearly not cheap on short-term ratios; the equity story is based on a combination of credible and increased cost-cutting action, Short-Term peculiar top-line growth looking for a cyclical recovery M/T and sensible strategic vision. 5.0 Target Price: EUR 1.85 4.5 4.0 Analyst(s) 3.5 3.0 Andrea Devita, CFA 2.5 2.0 1.5 1.0 Mar 11 Source : Factset 158 Jun 11 Sep 11 Dec 11 Mar 12 Jun 12 Sep 12 Dec 12 Mar 13 Jun 13 Sep 13 Dec 13 Mar 14 Jun 14 Banca Akros +39 02 4344 4031 [email protected] Italy SMALL & MID CAPS SELECTION EUR 11.36 Accumulate RECORDATI RECI.MI/REC IM Market capitalisation: EUR 2376m Healthcare EUR Sales (m) EBITDA (m) EBITDA margin EBIT (m) EBIT margin Net profit (reported) (m) Net profit (adj.) (m) Cash Flow from Ops.bef. chg in NWC (m) Net debt (Cash) (m) Net Debt/Equity Net Debt/EBITDA Interest cover (EBITDA/Fin. interest) ROCE (adj.) ROCE (adj.)/WACC EV / CE EV / Sales EV / EBITDA EV / EBIT P/E (adj.) P/BV OpFCF yield Dividend yield EPS (adj.) EPS (adj.) growth BVPS DPS Abs. Performances(12m,6m,3m,1m): 12 month High/low: EUR13.33 / 7.98 12/12 828 192 23.1% 167 20.2% 118 118 143 153 0.2 0.8 28.9 12.7% 1.5 1.9 2.0 8.5 9.8 12.2 2.2 -4.5% 4.3% 0.57 1.7% 3.16 0.30 41.6% 12/13 12/14e 12/15e 942 987 1,055 230 254 271 24.4% 25.8% 25.7% 195 221 234 20.7% 22.4% 22.2% 135 152 161 135 152 161 170 186 198 261 236 167 0.4 0.3 0.2 1.1 0.9 0.6 29.7 20.5 18.2 12.2% 13.0% 13.3% 1.6 1.7 nm 2.3 2.3 2.2 2.6 2.7 2.4 10.8 10.4 9.5 12.7 12.0 11.0 16.2 15.6 14.8 3.0 2.9 2.6 -0.3% 3.6% 5.5% 2.6% 2.7% 2.8% 0.65 0.73 0.77 14.0% 12.9% 5.4% 3.50 3.93 4.39 0.30 0.31 0.32 12.6% -9.5% -7.6% Avg. Daily nb traded shares:238,336 Main shareholders: Recordati Family 56.2%; Free float 43.8%; All share prices at 19/05/14. FINANCIAL CALENDAR (Source: Precise) PRICE (SHORT & LONG AVERAGE) titre 14 13 12 11 10 9 8 Profile: REC is an Italian mid-sized specialty pharmaceutical operator engaged in the research, manufacturing, development and marketing of pharmaceuticals (around 95.0% of sales). Though the headquarters are located in Milan, the group has a European reach, with operations in the main European countries and in North Africa (Germany, France, Spain, Portugal, UK, Ireland, Greece Turkey, Tunisia, Czech Republic, Romania, Russia and other C.I.S. countries). Recordati’s original research is currently focused on the cardiovascular and urological fields in order to discover new chemical compounds for the treatment of urogenital conditions and to develop new combinations of lercanidipine; furthermore, thanks to the acquisition of Orphan Europe, the group entered the growing niche of drugs for rare diseases. In addition to the new combo lercanidipine+enalapril, the group has been launching two new interesting molecules (silodosin for the treatment the benign prostatic hyperplasia, BPH; pitavastatin for the treatment of hypercholesterolaemia). Lastly, the group is strengthening its OTC products portfolio. SWOT Analysis Strengths Weaknesses • Solid distribution network in the mature European • Increase in R&D expenses (by 20% per year) may weaken markets margins • Good presence in the countries in Eastern Europe and • Potential risk of paying multiples that are too high for Middle East that are characterised by interesting growth future acquisitions rates • Successful track record in acquiring and integrating • Potential risk that new molecules in R&D pipeline fail to pharmaceutical businesses obtain the necessary approvals • Strong cash generation and sound financial structure to support new product/company acquisitions Opportunities Threats • Steady internationalisation (from Italy to emerging • Possible further price cuts on reimbursable drugs across markets/eastern Europe) and diversification of its product Europe portfolio new product launches • Furtherthrough strengthening and growth in the segment of rare • Strong growth in generic drugs in Europe may weaken diseases margins • Potential positive repercussions on Rec, the European licensee, in caso of the approval of NX-1207 (new product for the treatment of BHP) in USA As previously announced, Q1 14 sales grew by +6.5%. Despite the negative impact from the exchange rates (Turkish Lira EUR 6.2m + Russian Rouble EUR 3.2m) and the temporary sales decrease in Russia due to the distribution network reorganisation, the group achieved positive sales growth thanks to: 1) positive sales trend in Italy (+4.0%Y/Y) and in Germany (+7.8% Y/Y); 2) good sales growth of the new US portfolio (+9.7% Y/Y); 3) the positive contribution of the last two acquisitions in Spain and Tunisia. EBIT grew by 18.1%, higher than our estimates (EUR 55.2m); the growth was especially due to: 1) the improvement in the gross margin (Q1 14 66.6% vs 65.1% in Q1 13) owing to the higher profitability of the last acquired product; 2) the lower incidence of SG&A expenses on sales. 2013-2015 business plan: this business plan, which updated the previous plan (May 2011), confirms the growing sales trend (organically and through bolt-on acquisitions 2013-15e sales CAGR +10%) and stable profitability targets for the next three years (sustainable EBIT margin around 22-23%). FY 14 guidance confirmed: the management slightly revised FY 14 sales guidance due to the strong negative forex impact (EUR <1,000), but they confirmed the strong improvement in profitability (EUR >220m). Potential growth drivers not yet priced in: the current price the stock does not reflect the potential upside from: 1 ) steady internationalisation (from Italy to emerging markets/Eastern Europe) and diversification of its product portfolio through new product launches; 2 ) further strengthening and growth in the segment of rare diseases and in the OTC market. Recommendation: given the expected strong improvement in profitability, we confirm our Target Price of EUR 14.00 per share calculated based on our DCF Model (WACC 7.5% and 2.0% perpetual growth rate). Accumulate recommendation confirmed. 7 Target Price: EUR 14.00 6 5 Mar 11 Source : Factset Jun 11 Sep 11 Dec 11 Mar 12 Jun 12 Sep 12 Dec 12 Mar 13 Jun 13 Sep 13 Dec 13 Mar 14 Jun 14 Analyst(s) Paola Saglietti Banca Akros +39 02 4344 4287 [email protected] 159 Italy SMALL & MID CAPS SELECTION EUR 57.00 Hold REPLY REY.MI/REY IM Market capitalisation: EUR 526m Software & Computer Services EUR Sales (m) EBITDA (m) EBITDA margin EBIT (m) EBIT margin Net profit (reported) (m) Net profit (adj.) (m) Cash Flow from Ops.bef. chg in NWC (m) Net debt (Cash) (m) Net Debt/Equity Net Debt/EBITDA Interest cover (EBITDA/Fin. interest) ROCE (adj.) ROCE (adj.)/WACC EV / CE EV / Sales EV / EBITDA EV / EBIT P/E (adj.) P/BV OpFCF yield Dividend yield EPS (adj.) EPS (adj.) growth BVPS DPS Abs. Performances(12m,6m,3m,1m): 12 month High/low: EUR66.15 / 32.70 12/12 495 62.4 12.6% 55.5 11.2% 30.4 27.1 38.4 0.4 0.0 0.0 31.5 22.2% 2.7 1.0 0.5 3.9 4.3 7.1 1.1 10.2% 2.4% 2.94 12.1% 19.06 0.50 82.0% 12/13 12/14e 12/15e 563 623 654 72.6 80.9 86.9 12.9% 13.0% 13.3% 64.7 72.6 78.1 11.5% 11.6% 11.9% 34.9 37.3 41.3 34.5 37.3 41.3 43.5 46.9 51.3 -5.0 -26.7 -37.8 0.0 -0.1 -0.1 -0.1 -0.3 -0.4 29.8 53.9 96.5 23.1% 24.2% 23.8% 2.8 2.9 2.9 2.0 1.8 1.6 1.0 0.9 0.8 7.7 6.7 6.1 8.7 7.5 6.8 15.2 14.1 12.7 2.5 2.2 1.9 1.5% 3.7% 2.5% 1.0% 1.2% 1.2% 3.74 4.04 4.47 27.3% 8.2% 10.6% 23.05 26.40 30.17 0.57 0.70 0.70 11.7% -8.1% -13.5% Avg. Daily nb traded shares:54,036 Main shareholders: Rizzante Mario 53.7%; Free float 31.6%; Kairos Partners SGR 4.8%; Highclere International Investors 3.6%; Anima SGR 3.1%; Lodigiani Riccardo 2.3%; Other institutional investors 0.9%; All share prices at 19/05/14. FINANCIAL CALENDAR (Source: Precise) PRICE (SHORT & LONG AVERAGE) Profile: Founded in 1996, Reply is a leading system integrator and business process operator/outsourcer; it is specialized in the creation and implementation of solutions based on new communication networks and digital media. Reply operates in three main markets: Italy (75% of group sales in FY 13), Germany (15%), and the UK (12%) where the group entered in July 08 through the acquisition of Glue: Ltd, specialized in Enterprise and Service-Oriented architectures. Corporate action. In Nov-11, Reply acquired an 80% stake in the English consulting firm Portaltech for GBP 1.6m. In Oct-2012, Reply acquired Arlanis Software AG, a German company specialized in consulting and data integration, leader in Continental Europe on Salesforce.com solutions. A small deal, more relevant from a strategic point of view, given the rising importance of cloud computing and Software as a service solutions. In Dec-2012, Reply announced the acquisition of Avvio Design Associates Ltd, a UK company specialised in consulting and implementation of Brand engagement and Internal Communication solutions, based on Corporate Social Networking. Reply paid GBP 1.2m cash, the acquisition adds to the presence of Reply in the UK a centre of excellence on the themes of Social Media. In July 2013, Reply announced the acquisition of a small German digital consulting company “Triplesense Gmbh” for EUR 3.4m. Reply operates through a business model based on: a) established proprietary products; b) strategic partnerships with leading vendors; c) considerable knowledge of the end market and d) a deep knowledge of the customer business model. FY 2013 results were solid and broadly in line with our estimates through the P&L. Revenue growth were the main positive surprise, as Q4 accelerated on a sequential basis and exceeded our forecasts. Germany delivered the largest sequential sales improvement which was also coupled with margin increase (>4pp Y/Y to 10.7% in Q4, +1pp to 8.7% in the full year). In Italy, top-line growth was also strong, while EBITDA increased by just 5.5% as margin declined by 0.7pp to 12.7% in FY 2013. UK margin was up by 4.4pp in the 12 months (to 16.6%) in spite of a Y/Y decline in Q4, out of a sales growth of almost 50%. The net financial position was also in line with expectations implying EUR 5.5m cash generation in the year, EUR 5m cash burn in Q4. The board proposed a DPS of EUR 0.7 up by 22% Y/Y (we were expecting a stable distribution). The cash outlay for the company is EUR 6.5m, the yield offered is c 1.2%. SWOT Analysis Strengths • Promising portfolio of reference customers Weaknesses • High dependence on the Italian IT market • Well-implemented vertical offering • Business in Germany is highly dependent on banking sector IT spending • Experienced management team Opportunities • Self financed expansion through acquisitions and partnerships • Gain mkt share from global operators (IBM, Accenture), thanks to flexibility and prices. Threats • Firms could reduce their IT budget due to the deterioration of the macroeconomic context • Maturing technologies can reduce the need for additional IT spending titre Recommendation: solid results in Q4 2013,, characterized by a positive surprise in German top-line growth. Modest impact on our estimates (c +2/3% at the EBITDA level in FY 2014/15). Large impact on Fair Value from more favourable valuation parameters and the roll-over of DCF; we reflect the lower risks from country specific and company specific perspective with a WACC reduction of 100bp to 8.2%. TP increased to EUR 60 70 60 50 40 Target Price: EUR 60.00 30 20 10 Mar 11 Source : Factset 160 Jun 11 Sep 11 Dec 11 Mar 12 Jun 12 Sep 12 Dec 12 Mar 13 Jun 13 Sep 13 Dec 13 Mar 14 Jun 14 Analyst(s) Andrea Devita, CFA Banca Akros +39 02 4344 4031 [email protected] Belgium SMALL & MID CAPS SELECTION EUR 60.50 Hold RETAIL ESTATES RETE.BR/RET BB Market capitalisation: EUR 461m Real Estate EUR 03/12 36 31 86.2% 9 (13) 27 18 18.01 272 537 533 3.39 2.80 44.39 8.0% 49.20 7.1% 5.8% 17.3 14 2.4 272 49.0% 10.4% 03/14e 03/15e 47 50 EBITDA (m) 40 43 EBITDA margin 85.5% 85.6% Portfolio Result (m) 5 8 Net Financial Result (16) (16) Net Profit (reported)(m) 29 35 Net Profit (adj.)(m) 24 27 Funds From Operations 23.96 26.68 Net Debt (m) 318 323 Portfolio Value (m) 721 759 Enterprise Value (m) 748 784 EPS (adj.) 3.66 3.58 DPS 3.00 3.00 IFRS NAVPS 48.72 50.67 Premium/(discount) 20.9% 19.4% EPRA NAVPS 48.72 50.67 Earnings adj. yield 6.0% 5.9% Dividend yield 5.0% 5.0% EV/EBITDA 18.6 18.2 P/E (adj.) 16 17 Int. cover(EBITDA/Fin.int) 2.5 2.7 Net debt/(cash) (m) 318 323 Net Debt/Total Assets 43.1% 41.9% Abs. Performances(12m,6m,3m,1m): 5.1% 5.4% 12 month High/low: EUR60.50 / 52.25 Avg. Daily nb traded shares:3,288 Main shareholders: Free float 54.6%; FPIM 11.3%; Het Torentje (Leasinvest) 10.0%; Gross Rental Income (m) 03/13 42 36 86.0% 9 (15) 30 21 20.70 345 676 673 3.62 2.90 46.38 21.7% 51.55 6.0% 4.8% 18.6 16 2.4 345 50.2% 8.0% KBC 9.2%; Axa 5.3%; All share prices at 19/05/14. Profile: Retail Estates is a Belgian REIT that specializes in peripheral retail parks and retail warehouses that are located along access roads to urban centres in Belgium. The portfolio has a fair value of EUR 743.7m and consists of 551 retail properties with a typical size of about 1000 sqm. Retail Estates has a long experience in redeveloping its properties to respond to tenants’ demand. The 3-6-9 leases are indexed to the Belgian Health Index (an adjusted consumer price index). The company operates in an advantageous legal and fiscal framework offered by the status of Belgian REIT (= Sicafi or Bevak). SWOT Analysis Strengths • High portfolio yield of 6.96% despite its quality • Pure player in Belgian retail warehouses, which benefit from strong demand (cf. Low rents and good accessibility) limited offer (regulation) •and Conservative average rental level of the portfolio • Low cyclicality as Belgian retail sales are not volatile thanks to high & solid purchasing power Opportunities • Capturing the reversionary potential • Growth opportunities in Belgium thanks to large market share private investors (60%) • Development experience Weaknesses • Limited size of single asset makes portfolio expansion a labour-intensive process • Limited liquidity, but active OTC market Threats • E-commerce • Depressed consumer spending • Rising interest rates Recommendation: Rental income for 9M13/14 was EUR 34.98m, an increase of 13.2% compared to 9M12/13, driven by portfolio expansion and positive indexations. The net current result of the Group for 9M13/14 amounted to EUR 18.07m, up 19.66% over the year. On a per share basis, the net current result was EUR 2.65, flat over the year and better than 1H13/14 (-1.7%), notwithstanding an increase in the weighted average number of shares by 19.1%. This points to a better 3Q13/14 net current EPS. Retail Estates continues to report solid figures and raised its full year net current EPS (> EUR 3.25) guidance. We maintain our Hold recommendation and EUR 57 TP. FINANCIAL CALENDAR (Source: Precise) PRICE (SHORT & LONG AVERAGE) titre 62 23/05/14 Results 60 2014 Target Price: EUR 57.00 58 56 54 RETAIL ESTATES SMALL & MID CAPS SELECTION Analyst(s) 52 50 48 46 44 Mar 11 Jun 11 Sep 11 Dec 11 Mar 12 Jun 12 Sep 12 Dec 12 Mar 13 Jun 13 Sep 13 Dec 13 Mar 14 Jun 14 Dirk Peeters +32 2 287 97 16 Bank Degroof [email protected] Source : Factset 161 Germany SMALL & MID CAPS SELECTION EUR 47.00 Accumulate RHEINMETALL RHMG.DE/RHM GR Market capitalisation: EUR 1775m Aerospace & Defense EUR Sales (m) EBITDA (m) EBITDA margin EBIT (m) EBIT margin Net profit (reported) (m) Net profit (adj.) (m) Cash Flow from Ops.bef. chg in NWC (m) Net debt (Cash) (m) Net Debt/Equity Net Debt/EBITDA Interest cover (EBITDA/Fin. interest) ROCE (adj.) ROCE (adj.)/WACC EV / CE EV / Sales EV / EBITDA EV / EBIT P/E (adj.) P/BV OpFCF yield Dividend yield EPS (adj.) EPS (adj.) growth BVPS DPS Abs. Performances(12m,6m,3m,1m): 12 month High/low: EUR57.87 / 35.01 12/12 4,704 472 10.0% 278 5.9% 173 201 537 64.0 0.0 0.1 11.0 9.3% 1.1 0.8 0.5 4.6 7.9 6.9 1.0 26.9% 4.9% 5.29 -4.6% 35.54 1.80 23.4% 12/13 12/14e 12/15e 4,613 4,799 5,172 293 414 501 6.4% 8.6% 9.7% 81.0 202 285 1.8% 4.2% 5.5% 28.6 109 162 124 109 162 200 312 401 104 60.1 -23.9 0.1 0.0 0.0 0.4 0.1 0.0 6.2 9.2 11.5 4.5% 5.8% 7.7% 0.5 0.7 0.9 0.9 0.9 0.9 0.5 0.5 0.5 8.4 6.2 5.2 30.2 12.7 9.1 13.7 16.3 10.9 1.4 1.3 1.2 3.9% 2.9% 5.8% 0.9% 2.1% 3.2% 3.27 2.89 4.30 -38.1% -11.7% 48.7% 33.09 35.71 39.01 0.40 1.00 1.50 6.6% -11.2% -6.3% Avg. Daily nb traded shares:254,475 Profile: The Dusseldorf based Rheinmetall runs two main divisions. In the Automotive segment it supplies large OEMs with pumps, components for air supply and emission control, pistons, plain bearings and aluminium motor blocks. Also, Rheinmetall offers aftermarket services in this division. The Defence business is composed of four sub-segments: Land Systems (armoured vehicles and systems), Air Defence Systems, Weapon Munition and Defence Electronics. While Rheinmetall operates facilities for the Automotive segment in a number of worldwide locations, the Defence business is run basically from Germany due to its special character. The company employs currently more than 18,000 people, two thirds of these in Automotive with an increasing emphasis on lower-cost countries. SWOT Analysis Strengths • 2.5 years reach of order backlog in Defence Weaknesses • No real synergies between Automotive and Defence • Leading European land systems producer • Market leading position in some Automotive areas • RHM's Auto division portfolio is completely focused on the combustion engine only • RHM does not earn capital costs at the moment • Rather limited USD influence • Cash flow history has not been sustained Opportunities • New export orders in Defence (e.g. Saudi Arabia, UAE, Northern and Southern Africa) • Attractive acquisitions Threats • Further austerity measures in Europe and the US • Effective Defence restructuring • Ammunition business might not return in the desired magnitude/time frame • Raw material pricing (copper and aluminium) • European Auto recovery Main shareholders: Free float 84.7%; Harris Associates 10.5%; Treasury shares 4.8%; All share prices at 19/05/14. FINANCIAL CALENDAR (Source: Precise) PRICE (SHORT & LONG AVERAGE) titre 65 60 Recommendation: While the Auto division keeps on performing well, RHM was hit by austerity measures in Defence in particular in the high margin ammunition sub-division. Beyond that, RHM had to secure the loading of its MAN JV which appears to have largely improved, however, after bigger contracts from Australia and Scandinavia support here. Downside risks are arising from the government side as the export permissions seem to be treated more strictly. The long-term Defence margin target was recently revised from 10% to 7-9% while in Auto, RHM is on its way to achieve 8% once volumes are sufficient. The valuation is attractive with an EV/EBITDA’15e of 5.2x, but RHM has not been a strong cash flow generator in the past. 55 Target Price: EUR 55.00 50 45 40 Analyst(s) 35 30 Mrz 11 Source : Factset 162 Jun 11 Sep 11 Dez 11 Mrz 12 Jun 12 Sep 12 Dez 12 Mrz 13 Jun 13 Sep 13 Dez 13 Mrz 14 Jun 14 Adrian Pehl, CFA Equinet Bank +49 69 58997 438 [email protected] Germany SMALL & MID CAPS SELECTION EUR 11.55 Buy RIB SOFTWARE RSTA.DE/RSTA GY Market capitalisation: EUR 431m Software & Computer Services EUR Sales (m) EBITDA (m) EBITDA margin EBIT (m) EBIT margin Net profit (reported) (m) Net profit (adj.) (m) Cash Flow from Ops.bef. chg in NWC (m) Net debt (Cash) (m) Net Debt/Equity Net Debt/EBITDA Interest cover (EBITDA/Fin. interest) ROCE (adj.) ROCE (adj.)/WACC EV / CE EV / Sales EV / EBITDA EV / EBIT P/E (adj.) P/BV OpFCF yield Dividend yield EPS (adj.) EPS (adj.) growth BVPS DPS Abs. Performances(12m,6m,3m,1m): 12 month High/low: EUR11.98 / 3.68 12/12 39.2 16.0 40.9% 11.9 30.2% 8.8 8.8 15.7 -89.1 -0.6 -5.6 nm 10.6% 1.1 1.0 2.1 5.3 7.1 19.3 1.1 5.5% 3.2% 0.23 4.2% 3.83 0.14 202.5% 12/13 12/14e 12/15e 57.0 68.7 96.7 18.7 25.4 36.1 32.8% 37.0% 37.4% 13.4 19.6 29.4 23.6% 28.5% 30.5% 9.0 13.8 20.8 9.0 13.8 20.8 18.2 17.3 24.3 -82.1 -83.3 -87.9 -0.6 -0.6 -0.5 -4.4 -3.3 -2.4 46.4 nm nm 11.3% 15.2% 21.0% 1.2 1.6 2.2 2.3 3.8 3.4 3.4 5.1 3.6 10.4 13.8 9.6 14.4 17.9 11.8 30.1 31.1 20.7 1.9 2.9 2.7 4.0% 1.0% 2.2% 0.5% 1.3% 2.2% 0.24 0.37 0.56 4.7% 55.4% 49.9% 3.77 4.04 4.35 0.06 0.15 0.25 59.0% 21.7% 5.0% Avg. Daily nb traded shares:55,340 Profile: RIB sells integrated software solutions for the construction industry. The new software RIB iTWO business suite spans the entire value chain of construction, including project conception, planning, budgeting, tender processing, estimations, procurement, coordination, control and maintenance (5D building model). Hence, the iTWO solution bridges the gap between CAD and ERP. Over the next few years, RIB will seek to become the leading provider of digital software processes to the construction industry on a global basis. Hence, the company will aggressively market iTWO. Additionally, acquisitions and new products like the xTWO cloud should be further growth drivers. SWOT Analysis Strengths • Leading market position in Germany Weaknesses • Country risk China (R&D is located there) • Very solid balance sheet with more than EUR80m net cash • Partnership with Autodesk • Track record in terms of delivering on the guidance was poor after the IPO Opportunities • iTWO business suite could become an industry standard Threats • Acceptance of iTWO might be lower than expected • Customer wins like YIT should attract more potential customers • Strategic acquisitions (MC² and US COST) should accelerate growth especially in the US • Could become member of the TecDAX • Competitors might catch up faster than expected • Strategic acquisitions might fail Main shareholders: Free float 39.8%; Mr. Wolf & associates 32.2%; Sander family 7.3%; Capital Group 6.7%; SAP 4.8%; Schroder 3.3%; UBS 3.0%; Henderson 3.0%; Recommendation: At first glance the Q1 2014 results appear weak. However, this is not the case as none of the achieved three Phase II deals was recognized in the p&l of Q1 2014. RIB confirmed the full year guidance and Q2 2014 should now become a strong quarter. We maintain our price target of EUR15 and reiterate our Buy recommendation. All share prices at 19/05/14. FINANCIAL CALENDAR (Source: Precise) PRICE (SHORT & LONG AVERAGE) Target Price: EUR 17.00 titre 12 05/06/14 AGM 11 2013 10 9 RIB SOFTWARE SMALL & MID CAPS SELECTION Analyst(s) 8 7 6 5 Jochen Rothenbacher, CEFA 4 3 Mar 11 Jun 11 Sep 11 Dec 11 Mar 12 Jun 12 Sep 12 Dec 12 Mar 13 Jun 13 Sep 13 Dec 13 Mar 14 +49 69 58997 415 Equinet Bank [email protected] Jun 14 Source : Factset 163 Netherlands SMALL & MID CAPS SELECTION EUR 3.59 Buy ROYAL BAM GROUP BAMN.AS/BAMNB NA Market capitalisation: EUR 867m Materials, Construction & Infrastructure EUR Sales (m) EBITDA (m) EBITDA margin EBIT (m) EBIT margin Net profit (reported) (m) Net profit (adj.) (m) Cash Flow from Ops.bef. chg in NWC (m) Net debt (Cash) (m) Net Debt/Equity Net Debt/EBITDA Interest cover (EBITDA/Fin. interest) ROCE (adj.) ROCE (adj.)/WACC EV / CE EV / Sales EV / EBITDA EV / EBIT P/E (adj.) P/BV OpFCF yield Dividend yield EPS (adj.) EPS (adj.) growth BVPS DPS Abs. Performances(12m,6m,3m,1m): 12 month High/low: EUR4.73 / 3.09 12/12 7,225 191 2.6% 102 1.4% -184 149 239 480 0.7 2.5 nm 26.9% 2.9 0.7 0.0 1.8 3.4 5.2 1.0 36.7% 3.1% 0.63 17.2% 3.08 0.10 -5.7% 12/13 12/14e 12/15e 7,042 7,138 7,390 160 213 278 2.3% 3.0% 3.8% 3.8 127 189 0.1% 1.8% 2.6% 37.7 78.1 138 101 75.9 136 203 166 229 373 217 -28.6 0.4 0.2 0.0 2.3 1.0 -0.1 nm nm nm 0.5% 15.9% 25.3% 0.1 1.7 2.7 0.7 0.5 0.3 0.1 0.0 0.0 2.6 1.5 0.6 nm 2.5 0.9 9.1 11.4 6.4 1.0 0.9 0.8 2.4% 9.3% 21.7% 1.4% 3.5% 6.3% 0.42 0.31 0.56 -33.5% -24.6% 78.7% 3.85 4.13 4.57 0.05 0.13 0.23 -6.1% -10.6% -7.4% Avg. Daily nb traded shares:2,833,573 Main shareholders: Free float 70.7%; A. van Herk 10.0%; ING 9.8%; Delta Lloyd Deelnemingen 5.0%; Governance for Owners 4.5%; Profile: BAM is the largest construction company in the Netherlands and a top-10 player in Europe with sales of approximately EUR 7bn. Furthermore, the company has strong positions In the UK, Belgium and Germany. With its large land bank it has a strong position on the currently lacklustre Dutch residential property market and in the growing Public Private Partnerships market BAM has also a strong position. SWOT Analysis Strengths • Size is an important driver and BAM is Nr. 1 in The Netherlands/Belgium and top-5 position in the UK • Well positioned in growth areas like PPP • BAM International is benefiting from growth opportunities outside Europe Weaknesses • BAM is a (late) cyclical company and relies heavily on the economic cycle • The way business was done in the sector in the past did not comply with EU/Dutch competition regulations. More not excluded •issues Largeare exposure to residential property Opportunities • Benefitting from a recovery in German construction Threats • Still mixed signals recovery Europe • Budget balancing improves potential for Public Private Partnership projects • Increased investments in Rail Infra structure in Europe • Continued margin pressure as a result of rising raw material costs and higher subcontractor, which can not be to the customer hard to find •passed Skilledon staff is increasingly Recommendation: BAM continues to be our favourite in the Dutch construction universe. The company generates over half of revenues outside The Netherlands. The outlook for the Dutch construction sector remains weak, but there are some early indicators of improvement. Valuation is still on attractive levels, but the very weak outlook for Dutch construction could continue to weigh on investor sentiment We have a Buy rating All share prices at 19/05/14. Target Price: EUR 4.20 FINANCIAL CALENDAR (Source: Precise) PRICE (SHORT & LONG AVERAGE) t i t re 5.0 20/05/14 Dividend Payment 4.5 4.0 3.5 2.5 2.0 1.5 Mar 11 164 ROYAL BAM GROUP SMALL & MID CAPS SELECTION Analyst(s) Edwin de Jong 3.0 Source : Factset 2013 Jun 11 Sep 11 Dec 11 Mar 12 Jun 12 Sep 12 Dec 12 Mar 13 Jun 13 Sep 13 Dec 13 Mar 14 Jun 14 +312 0 5508569 SNS Securities [email protected] Germany SMALL & MID CAPS SELECTION EUR 11.50 Buy SAF-HOLLAND SFQN.DE/SFQ GR Market capitalisation: EUR 522m General Industrials EUR Sales (m) EBITDA (m) EBITDA margin EBIT (m) EBIT margin Net profit (reported) (m) Net profit (adj.) (m) Cash Flow from Ops.bef. chg in NWC (m) Net debt (Cash) (m) Net Debt/Equity Net Debt/EBITDA Interest cover (EBITDA/Fin. interest) ROCE (adj.) ROCE (adj.)/WACC EV / CE EV / Sales EV / EBITDA EV / EBIT P/E (adj.) P/BV OpFCF yield Dividend yield EPS (adj.) EPS (adj.) growth BVPS DPS Abs. Performances(12m,6m,3m,1m): 12 month High/low: EUR12.22 / 6.62 12/12 860 67.7 7.9% 46.8 5.4% 7.4 28.3 24.2 142 0.7 2.1 2.2 8.4% 0.9 1.0 0.5 5.7 8.3 7.7 1.1 -1.5% 0.0% 0.68 -6.8% 4.76 0.00 58.5% 12/13 12/14e 12/15e 857 942 1000 67.1 92.9 112 7.8% 9.9% 11.2% 49.3 67.8 88.0 5.7% 7.2% 8.8% 24.4 38.4 53.0 31.4 42.8 55.8 38.9 63.5 77.0 123 115 83.6 0.6 0.5 0.3 1.8 1.2 0.7 3.8 7.1 9.1 9.0% 11.9% 15.3% 0.9 1.2 1.6 1.7 1.7 1.6 0.7 0.7 0.6 9.5 7.1 5.6 13.0 9.8 7.2 15.6 12.2 9.4 2.2 2.1 1.8 4.8% 5.4% 9.7% 2.3% 3.7% 5.1% 0.69 0.94 1.23 1.7% 36.3% 30.4% 4.90 5.47 6.22 0.27 0.42 0.58 11.5% -5.9% 5.2% Avg. Daily nb traded shares:201,574 Profile: SAF-HOLLAND is one of the leading manufacturers of truck & trailer components. The company was established in 2006 by the merger of two industry leaders: SAF, Europe’s Nr.2 producer of trailer axle systems, and Holland in the US. The company is specialized in trailer axle systems, fifth wheels, suspension systems, kingpins, landing gears and other parts. In addition SAF-HOLLAND maintains a global service network. SWOT Analysis Strengths • Strong market position in most business areas Weaknesses • Relatively low margins in the trailer systems division • Highly flexible production Opportunities • Margin potential in the Trailer Systems division Threats • Potential cyclical downturn of the truck and trailer cycle • Revenue potential in the high margin aftermarket business Recommendation: SAF-Holland is benefitting from the recovery of the truck and trailer market world wide at the moment. The company is significantly better positioned than 2008, with debt reduced significantly, equity strengthened and cost structures even more flexible. We thus see the company as well positioned to master even the current difficult environment in the European market. Buy Main shareholders: Free float 95.4%; Management 4.6%; Target Price: EUR 14.10 All share prices at 19/05/14. SAF-HOLLAND SMALL & MID CAPS SELECTION Analyst(s) FINANCIAL CALENDAR (Source: Precise) PRICE (SHORT & LONG AVERAGE) Tim Schuldt, CFA +49 69 5899 7433 Equinet Bank [email protected] titre 14 13 12 11 10 9 8 7 6 5 4 3 Mar 11 Jun 11 Sep 11 Dec 11 Mar 12 Jun 12 Sep 12 Dec 12 Mar 13 Jun 13 Sep 13 Dec 13 Mar 14 Jun 14 Source : Factset 165 Italy SMALL & MID CAPS SELECTION EUR 15.55 Hold SAFILO SFLG.MI/SFL IM Market capitalisation: EUR 960m Personal Goods EUR Sales (m) EBITDA (m) EBITDA margin EBIT (m) EBIT margin Net profit (reported) (m) Net profit (adj.) (m) Cash Flow from Ops.bef. chg in NWC (m) Net debt (Cash) (m) Net Debt/Equity Net Debt/EBITDA Interest cover (EBITDA/Fin. interest) ROCE (adj.) ROCE (adj.)/WACC EV / CE EV / Sales EV / EBITDA EV / EBIT P/E (adj.) P/BV OpFCF yield Dividend yield EPS (adj.) EPS (adj.) growth BVPS DPS Abs. Performances(12m,6m,3m,1m): 12 month High/low: EUR19.03 / 13.15 12/12 1,175 115 9.8% 73.9 6.3% 25.9 25.7 68.3 215 0.2 1.9 3.9 4.7% 0.5 0.5 0.5 5.0 7.8 16.0 0.5 6.6% 0.0% 0.42 -14.1% 13.89 0.00 14.2% 12/13 12/14e 12/15e 1,122 1,230 1,328 112 116 142 10.0% 9.5% 10.7% 74.7 74.4 99.7 6.7% 6.0% 7.5% 15.5 26.7 51.5 29.6 35.1 51.5 55.0 69.2 94.5 182 183 146 0.2 0.2 0.2 1.6 1.6 1.0 4.9 7.8 10.9 5.0% 4.8% 6.3% 0.5 0.5 0.7 1.2 1.0 1.0 1.1 0.9 0.8 10.7 9.5 7.5 16.0 14.9 10.8 35.5 27.3 18.7 1.2 1.1 1.0 0.0% 7.4% 8.4% 0.0% 0.0% 0.0% 0.48 0.57 0.83 15.2% 18.7% 46.5% 13.65 14.05 14.88 0.00 0.00 0.00 -10.0% -8.3% 7.6% Avg. Daily nb traded shares:194,992 Main shareholders: Free Float 48.5%; Hal Holding 42.2%; Tabacchi Family 9.2%; All share prices at 19/05/14. FINANCIAL CALENDAR (Source: Precise) PRICE (SHORT & LONG AVERAGE) titre 20 18 16 14 12 10 8 Profile: Safilo is the second worldwide player in the eyewear sector. Main licensed brands are Gucci, Dior and Hugo Boss and generate around 30 / 40% of total sales. A new licensing agreement was signed recently (June 2013) with Fendi. Safilo also has proprietary brands: Carrera, Smith, Safilo, Oxydo, Blue Bay and the recently acquired Polaroid. The company designs, manufactures and distributes worldwide mainly sunglasses and prescription frames. It runs 6 manufacturing plants located in Italy, China and Slovenia. Safilo’s main channel is the wholesale. In the last couple of years the company had to adapt its organization to a new brand mix: Diesel, Armani, Valentino, Nine West, Balenciaga licences were not renewed. Tommy Hilfiger and Céline were newly signed while Polaroid was acquired (becoming one of the owned brands). The phasing out of the mentioned licenses is complete with no big issues, Polaroid was launched with success as well as Céline. First deadline for some minor licenses expiration is 2015 but the main licenses such as the Boss galaxy or Gucci and Bottega Veneta are locked until 2019/2020. New managers were hired and Mr. Robert Polet (Gucci’s former CEO) is Safilo’s Chairman. In June a new BoD was appointed and Ms. Luisa Delgado, who was candidate of HAL, became Safilo’s CEO. This appointment will reinforce the position of the main shareholder. Main Shareholder is currently HAL with 42.2% of total shares. HAL Holding, is an international investment company based in Netherlands specialised in the optical retail business (it operates around 4,500 stores) SWOT Analysis Strengths • Leadership in the luxury segment Weaknesses • Business dependant on licences • 2010 financial and business restructuring were successful • Moderate top line growth rate expected for 2014 • Recent phasing out of non-renewed licenses was successful. Opportunities • HAL could strengthen Safilo’s bargaining power toward suppliers, licensors and customers and provide fresh finance if needed • Proprietary brands could grow • Recent management reshuffling Threats • Weak macroeconomic context which penalises discretionary purchases • Risk of brands cannibalization, especially Carrera and Polaroid • Rationalisation of the licence portfolio helps to reduce SKU’s but can spark negative mkt reaction. • Launch of Polaroid as well as polarized lenses, which can be extended also to other brands. Recommendation: Our investment idea is based on: Safilo well replaced lost licenses by new proprietary brands and new luxury licenses. First was Polaroid, acquired thanks to HAL support. The brand is expected to generate higher sales than previously estimated (in the mid run EUR 100 / 150m). Polaroid lenses, produced by Essilor, will give boost to brand awareness and will generate royalties for Safilo. This brand, together with Carrera and other owned brands is targeted to generate 25% of total revenues within few years. This way, Safilo reduces its risk profile thanks to a higher percentage of revenues from owned brands vs. the past. Safilo is regaining reputation in the world of luxury: this is witnessed by the agreements with new licenses (Fendi) and the Marc Jacobs early renewal. HAL, the main shareholder, is supporting SFL strategic decisions and sustaining Safilos’ product distribution through its retail chains (Grand Vision).The risk profile has also reduced thanks to the debt refinancing. Considering the upside potential, our EUR18 price target reflects a buy rather than hold. We believe this could be reached in a shorter time than we expect if the gross margin positive dynamics last also in the following quarters leading to a targeted 11.5% / 12% FY 14E EBITDA margin and to 13.5% FY 15E EBITDA margin. According to the company, the reach of EUR1,250 / 1,300m top line in FY 15 is not a must in order to obtain 13.5% EBITDA margin (and this is coherent with the above mentioned accretive profitability dynamics). Target Price: EUR 18.00 6 4 Mar 11 Source : Factset 166 Jun 11 Sep 11 Dec 11 Mar 12 Jun 12 Sep 12 Dec 12 Mar 13 Jun 13 Sep 13 Dec 13 Mar 14 Jun 14 Analyst(s) Giada Cabrino, CIIA Banca Akros +39 02 4344 4092 [email protected] France SMALL & MID CAPS SELECTION EUR 24.28 S1A.PA/SAFT FP Market capitalisation: EUR 628m General Industrials EUR Sales (m) EBITDA (m) EBITDA margin EBIT (m) EBIT margin Net profit (reported) (m) Net profit (adj.) (m) Cash Flow from Ops.bef. chg in NWC (m) Net debt (Cash) (m) Net Debt/Equity Net Debt/EBITDA Interest cover (EBITDA/Fin. interest) ROCE (adj.) ROCE (adj.)/WACC EV / CE EV / Sales EV / EBITDA EV / EBIT P/E (adj.) P/BV OpFCF yield Dividend yield EPS (adj.) EPS (adj.) growth BVPS DPS Abs. Performances(12m,6m,3m,1m): 12 month High/low: EUR27.29 / 16.76 12/12 598 102 17.0% 68.9 11.5% 34.1 34.1 82.9 108 0.3 1.1 12.7 7.5% 0.9 0.9 0.9 5.4 8.0 13.9 1.1 2.8% 4.2% 1.27 -54.3% 15.72 0.75 27.1% 12/13 12/14e 12/15e 624 670 717 99.1 105 122 15.9% 15.6% 17.1% 61.1 65.9 83.0 9.8% 9.8% 11.6% 36.5 44.3 58.5 36.5 44.3 58.5 80.8 88.3 100 114 81.1 38.1 0.3 0.2 0.1 1.2 0.8 0.3 14.6 16.0 30.7 5.5% 6.7% 8.5% 0.6 0.8 0.9 1.2 1.1 1.1 1.2 1.1 0.9 7.7 6.7 5.4 12.4 10.7 7.9 18.8 15.1 11.4 1.6 1.4 1.3 2.4% 8.5% 10.2% 3.2% 3.3% 3.5% 1.33 1.61 2.13 4.4% 21.3% 32.1% 16.07 17.00 18.47 0.78 0.80 0.85 5.5% -4.2% -2.5% Avg. Daily nb traded shares:41,555 Main shareholders: Free float 97.5%; management and employees 2.5%; All share prices at 19/05/14. FINANCIAL CALENDAR (Source: Precise) PRICE (SHORT & LONG AVERAGE) titre 28 26 24 22 11/06/14 Dividend Payment 2013 19/05/14 Ex Dividend Date 2013 Profile: Global number one for industrial batteries with high market share in several niche markets: global number one in 75% of its sales. Space and defence (16% of sales): portable equipment, tracers, radios, missiles and torpedoes. Civil lithium (25% of sales): automatic meters, etc. Transport (22% of sales): aviation (exclusive supplier to Airbus), trains. Industrial standby (35% of sales): safety batteries for oil-gas, telecom, industries. Principal technologies: nickel-cadmium, primary lithium, rechargeable lithium, nickel– metal hydride, lithium-ion (18% of sales). SWOT Analysis Strengths • Long contracts, products made to client specifications: pricing power • Global number one in 75% of its revenues • Variety of technologies, applications and clients, with different cycles 18 16 Jun 11 Sep 11 Dec 11 Mar 12 Jun 12 Sep 12 Dec 12 Mar 13 Jun 13 Sep 13 Dec 13 Mar 14 Jun 14 Weaknesses • Late cyclical profile • No longer exposed to the automotive sector since the JV with JCI was dissolved • Small-scale companies vs Asian giants for Li-ion batteries Opportunities Threats • Growth of lithium-ion applications in telecoms & military, • Cuts in government spending: defence, grants for as well as storage of renewable energy renewable energy • Stronger competition in lithium-ion than in nickelcadmium • Li-ion will be progressively substituted for Ni-Cd in some applications Recommendation: Saft is the profitable leader of a low-growth activity, Nickel-Cadmium, which is set to lose market share to Lithium-ion, a technology that is expanding fast but in which competition is fierce. The start-up of the Jacksonville plant (sales and profitability) is a risk factor: visibility remains low on the ramp-up of the plant, and breakeven at the EBITDA level has been postponed to 2015. On the Lithium-ion market, the group has exited the main application (automotive) following breakup of the JV with Johnson Controls. Our EUR23.0 price target is based on a DCF method, of which EUR4.60 for the Jacksonville plant. At the current stock price, the EV/EBIT 14e of 11.7x looks high to us, given the lack of visibility on the normalised margins of Li-ion. The performances of H1-14 will be good, both on top-line and margins, on an easy base of comparison. Target Price: EUR 23.00 SAFT SMALL & MID CAPS SELECTION Analyst(s) 20 14 Mar 11 Reduce SAFT Eric Ravary +33 1 45 96 79 53 CM - CIC Securities [email protected] Source : Factset 167 Italy SMALL & MID CAPS SELECTION EUR 4.12 Hold SALINI IMPREGILO SALI.MI/SAL IM Market capitalisation: EUR 1658m Materials, Construction & Infrastructure EUR Sales (m) EBITDA (m) EBITDA margin EBIT (m) EBIT margin Net profit (reported) (m) Net profit (adj.) (m) Cash Flow from Ops.bef. chg in NWC (m) Net debt (Cash) (m) Net Debt/Equity Net Debt/EBITDA Interest cover (EBITDA/Fin. interest) ROCE (adj.) ROCE (adj.)/WACC EV / CE EV / Sales EV / EBITDA EV / EBIT P/E (adj.) P/BV OpFCF yield Dividend yield EPS (adj.) EPS (adj.) growth BVPS DPS Abs. Performances(12m,6m,3m,1m): 12 month High/low: EUR5.14 / 2.66 12/12 2,281 84.3 3.7% -25.5 nm 603 680 713 -567 -0.3 -6.7 2.7 -1.8% -0.2 0.8 0.3 7.8 nm 2.1 0.8 21.7% 42.2% 1.69 nm 4.49 1.49 -7.6% 12/13 12/14e 12/15e 3,970 4,435 5,115 626 474 552 15.8% 10.7% 10.8% 434 272 341 10.9% 6.1% 6.7% 299 129 182 252 129 182 491 330 393 331 244 232 0.2 0.1 0.1 0.5 0.5 0.4 10.7 5.5 7.2 19.4% -28.0% -76.8% 2.2 1.6 1.3 1.1 0.5 0.4 0.3 3.4 3.6 3.1 4.8 6.2 5.0 7.8 12.9 9.1 1.3 1.0 0.9 -20.2% -1.0% 2.0% 0.0% 1.5% 1.9% 0.62 0.32 0.45 -63.0% -48.9% 41.7% 3.73 4.05 4.44 0.00 0.06 0.08 -17.2% -9.5% -7.6% Avg. Daily nb traded shares:251,734 Main shareholders: Salini Spa 89.7%; Free float 10.3%; All share prices at 19/05/14. FINANCIAL CALENDAR (Source: Precise) PRICE (SHORT & LONG AVERAGE) titre Profile: Impregilo is one of the main Italian construction companies and is involved in Infrastructure, engineering, plant construction and concessions. In the Infrastructure sector, the group engages in public works projects. It undertakes construction of dams and hydroelectric plants, roads, bridges, railways, airports and underground railway works. In the Engineering sector, the group builds and provides technical management services for desalination, water treatment and solid waste treatment plants. SWOT Analysis Strengths • Historical leadership in large infrastructural works in many countries • Well recognised engineering technical capacity Weaknesses • Desalination plant business still suffering from lack of new orders • Smaller size compared to competitors Opportunities • Italian market has a sizeable infrastructure deficit vs other European countries • Geographical expansion Threats • The company is exposed to high-risk countries Bid by Salini– In February 2013, Salini made a bid for Impregilo’s ordinary shares at EUR 4.0/sh. At the end of the offer Salini reached 92.08% of Impregilo. Salini decided to keep the company listed. Extraordinary dividend – Impregilo sold its stake in Ecorodovias for a total cash-in of around EUR 940m. The company distributed EUR 600m in dividends (EUR 1.49/sh) in May 2013. Merger of Salini and Impregilo - the boards of Impregilo and Salini approved the merger of the two companies in June 2013. The merger is effective starting from January 2014. Impregilo unveiled its business plan on the merger with Salini in June 2013. The new company will focus on managing large complex projects where margins are expected to be higher and competition lower. The company expects the revenues to almost double in the 2012-2016 period with an EBITDA and EBIT margin to be respectively higher than 13.5% and 9% at the end of the plan. Capital hike to increase free float – the company is going to increase the free float from the present 10% (Salini owns a 89.95% stake) to 30/35%. The management said it was going to reach this goal both through a capital increase without options and through the disposal of some of the shares owned by Salini in Impregilo. The timing of these moves was not disclosed but we believe that both the moves can be finalized in the next few weeks. 5.5 05/08/14 Results 5.0 4.5 4.0 2014H1 Conclusion & Action: the main focus is the increase in the free float which is expected to be finalized in the next few weeks. Target Price: EUR 5.30 3.5 3.0 2.5 2.0 1.5 Mar 11 Source : Factset Jun 11 Sep 11 Dec 11 Mar 12 Jun 12 Sep 12 Dec 12 Mar 13 Jun 13 Sep 13 Dec 13 Mar 14 Jun 14 SALINI IMPREGILO SMALL & MID CAPS SELECTION Analyst(s) Francesco Sala 168 +39 02 4344 4240 Banca Akros [email protected] Germany SMALL & MID CAPS SELECTION EUR 32.17 Buy SALZGITTER SZGG.DE/SZG GR Market capitalisation: EUR 1741m Basic Resources EUR Sales (m) EBITDA (m) EBITDA margin EBIT (m) EBIT margin Net profit (reported) (m) Net profit (adj.) (m) Cash Flow from Ops.bef. chg in NWC (m) Net debt (Cash) (m) Net Debt/Equity Net Debt/EBITDA Interest cover (EBITDA/Fin. interest) ROCE (adj.) ROCE (adj.)/WACC EV / CE EV / Sales EV / EBITDA EV / EBIT P/E (adj.) P/BV OpFCF yield Dividend yield EPS (adj.) EPS (adj.) growth BVPS DPS Abs. Performances(12m,6m,3m,1m): 12 month High/low: EUR33.82 / 24.78 12/12 10,397 390 3.8% 25.2 0.2% -102 -102 347 -241 -0.1 -0.6 3.1 1.6% 0.2 0.6 0.3 8.2 nm nm 0.6 -1.5% 0.6% -1.89 -chg 67.20 0.25 3.6% 12/13 12/14e 12/15e 9,244 10,176 10,439 165 411 557 1.8% 4.0% 5.3% -364 68.5 220 nm 0.7% 2.1% -499 24.4 140 -492 24.4 140 -93.7 433 429 -126 -196 -318 0.0 -0.1 -0.1 -0.8 -0.5 -0.6 2.1 3.5 4.6 -7.6% 1.2% 3.9% -0.8 0.1 0.4 0.6 0.6 0.5 0.3 0.3 0.2 16.6 6.8 4.7 nm 40.6 11.8 nm nm 12.4 0.5 0.5 0.5 -5.8% 3.8% 6.8% 0.6% 0.8% 1.1% -9.10 0.45 2.60 -chg +chg nm 58.76 59.01 61.35 0.20 0.25 0.35 -0.3% 0.7% 5.4% Avg. Daily nb traded shares:473,505 Profile: Salzgitter AG holds more than 200 domestic and international subsidiaries active in the steel and technology industry. The company operates through five divisions. The Steel division manufactures flat steel and profiles, plate, sheet piles, components for roofing and cladding, blanks and tailored blanks for a variety of applications. The Trading division covers the Group's sales network for large-scale, medium-sized and small end customers. The Tubes division offers large-diameter tubes, high-frequency inductive (HFI) welded line pipes, cold-finished and seamless stainless steel tubes. The Services division caters for the needs of other areas within the group and offers supply chain, logistics, research services and information technology services to external clients. The Technology division comprises the Kloeckner Group, a supplier of plant solutions for the food industry. SWOT Analysis Strengths • SZG is one of Europe's largest flat steel makers and cost leader in European pig-iron production • Market leading position in large-diameter pipes and precision tubes • Healthy balance sheet vs. peers (eFY13 gearing: -12% / equity-ratio: 37%) Weaknesses • With above 70% of sales in Steel/Trading, SZG is heavily exposed to downturns in the steel sector • Limited integration implies dependency on third parties and comparably high sourcing costs • High exposure to Europe makes SZG susceptible to downturns in this region Opportunities • Net cash of eEUR370m provides financial stability and leaves a wide range of strategic opportunities (i.e. M&A) • High exposure to cyclical sectors offers earnings swing potential during economic recovery • The SZGA 2015 program should improve the company's profitability and internal efficien Threats • European capacity overhang in long steel paired with weak demand from the construction sector weighs on •margins SZG relies on external supply implying significant problems if one of its suppliers does not deliver • Despite operational improvements, price pressure is likely to stay at 'Technology' weighing on margins Main shareholders: Free float 59.4%; State of Lower Saxony 26.5%; Treasury shares 10.0%; Blackrock 4.1%; All share prices at 19/05/14. FINANCIAL CALENDAR (Source: Precise) PRICE (SHORT & LONG AVERAGE) Recommendation: We continue to see SZG as an interesting restructuring story, with some additional help from the improving steel cycle. 1Q14 results have provided strong evidence on the management’s successful efforts to turn the company into a profitable business. Our new PT of EUR37 values the stock in line with its closest EU steel peer ArcelorMittal (BUY, PT EUR16.10) at 5.1x (was 4.9x) FY15 EV/EBITDA. This reflects a significant ‘restructuring discount’ to the EU steel sector which currently trades at 7.3x FY14 and 6.3x FY15. We confirm Buy. Target Price: EUR 37.00 titre 55 50 45 14/08/14 Analyst Meeting 2014H1 13/08/14 Analyst Meeting 2014H1 40 22/05/14 AGM 35 SALZGITTER SMALL & MID CAPS SELECTION Analyst(s) Stefan Freudenreich, CFA 30 25 Mar 11 2013 Jun 11 Sep 11 Dec 11 Mar 12 Jun 12 Sep 12 Dec 12 Mar 13 Jun 13 Sep 13 Dec 13 Mar 14 +49 69 58997 437 Equinet Bank [email protected] Jun 14 Source : Factset 169 Finland SMALL & MID CAPS SELECTION EUR 5.09 Accumulate SANOMA SAA1V.HE/SAA1V FH Market capitalisation: EUR 828m Media EUR Sales (m) EBITDA (m) EBITDA margin EBIT (m) EBIT margin Net profit (reported) (m) Net profit (adj.) (m) Cash Flow from Ops.bef. chg in NWC (m) Net debt (Cash) (m) Net Debt/Equity Net Debt/EBITDA Interest cover (EBITDA/Fin. interest) ROCE (adj.) ROCE (adj.)/WACC EV / CE EV / Sales EV / EBITDA EV / EBIT P/E (adj.) P/BV OpFCF yield Dividend yield EPS (adj.) EPS (adj.) growth BVPS DPS Abs. Performances(12m,6m,3m,1m): 12 month High/low: EUR7.24 / 4.52 12/12 2,379 557 23.4% 232 9.8% 115 115 446 1,241 0.8 2.2 9.7 5.8% 0.8 0.8 1.0 4.2 10.1 10.5 0.7 29.9% 8.1% 0.71 -11.6% 10.00 0.60 -23.3% 12/13 12/14e 12/15e 2,084 1,886 1,803 790 409 420 37.9% 21.7% 23.3% 155 128 140 7.4% 6.8% 7.8% 105 35.2 70.6 105 35.2 70.6 727 316 351 1,038 848 822 0.9 0.6 0.6 1.3 2.1 2.0 14.9 7.9 8.2 5.3% 4.4% 4.7% 0.7 0.6 0.7 0.8 0.7 0.6 0.9 0.8 0.8 2.3 3.5 3.3 11.8 11.1 10.0 9.9 23.5 11.7 0.9 0.6 0.6 62.2% 27.1% 33.1% 2.0% 3.9% 3.9% 0.64 0.22 0.43 -9.1% -66.3% 100.5% 7.24 8.38 8.62 0.10 0.20 0.20 -25.5% -4.8% 9.4% Avg. Daily nb traded shares:117,647 Main shareholders: Free float 54.0%; Aatos Erkko 23.0%; Langenskiöld Robin 7.5%; Profile: Sanoma specialises in consumer media and learning solutions and is one of the leading European magazine publishers and learning materials providers. Recently, the company has made fast progress in restructuring by divesting meagrely growing operations, and the company has focused on advancing organic growth. SWOT Analysis Strengths • Strong market position in main product areas/countries of operation • Business not entirely dependent on advertising markets as learning materials create stability • Acquisition of SBS increased debt load substantially • Low free float • Exceptionally weak outlook for magazine advertising Opportunities • Further streamlining Threats • Structural issues in print media (circulation declining) • Cost savings potential • Low barriers to entry in digital media • Investment in digital media • Media spending focuses increasingly on social media • Inability to handle the debt load Recommendation: Sanoma has undergone an extensive structural change and will spend the next few years integrating its operations. The weakness of media advertising in Europe is having a full-blown impact on Sanoma’s profits, but the company’s ongoing savings programmes (EUR 100m, 2013–2015) limits profit drop. Minor bright spots have emerged particularly on the TV market and, after Q1 results, we raised our recommendation for the share to Accumulate. The share price is close to its all-time low and we expect the worst decline to be over. Seppälä Rafaela 6.3%; All share prices at 19/05/14. Target Price: EUR 5.70 FINANCIAL CALENDAR (Source: Precise) PRICE (SHORT & LONG AVERAGE) Weaknesses • Unimpressive organic growth titre 14 13 25/07/14 Results 2014Q2 25/07/14 Analyst Meeting 2014Q2 12 11 10 9 Kimmo Stenvall 8 7 6 5 4 Mar 11 Source : Factset 170 SANOMA SMALL & MID CAPS SELECTION Analyst(s) Jun 11 Sep 11 Dec 11 Mar 12 Jun 12 Sep 12 Dec 12 Mar 13 Jun 13 Sep 13 Dec 13 Mar 14 Jun 14 +358 10 252 4561 Pohjola [email protected] Portugal SMALL & MID CAPS SELECTION EUR 10.30 Hold SEMAPA SEM.LS/SEM PL Market capitalisation: EUR 1219m Basic Resources EUR Sales (m) EBITDA (m) EBITDA margin EBIT (m) EBIT margin Net profit (reported) (m) Net profit (adj.) (m) Cash Flow from Ops.bef. chg in NWC (m) Net debt (Cash) (m) Net Debt/Equity Net Debt/EBITDA Interest cover (EBITDA/Fin. interest) ROCE (adj.) ROCE (adj.)/WACC EV / CE EV / Sales EV / EBITDA EV / EBIT P/E (adj.) P/BV OpFCF yield Dividend yield EPS (adj.) EPS (adj.) growth BVPS DPS Abs. Performances(12m,6m,3m,1m): 12 month High/low: EUR11.03 / 6.29 12/12 1,953 495 25.3% 295 15.1% 127 127 361 1,601 1.4 3.2 7.9 6.7% 0.8 0.7 1.2 4.6 7.7 5.3 0.8 39.7% 2.5% 1.07 1.9% 6.73 0.26 46.2% 12/13e 12/14e 12/15e 1,965 1,849 1,905 398 356 357 20.2% 19.3% 18.7% 249 209 208 12.7% 11.3% 10.9% 78.7 60.5 58.1 78.7 60.5 58.1 260 229 228 1,601 1,660 1,646 1.4 1.4 1.4 4.0 4.7 4.6 4.4 3.9 3.7 5.7% 4.6% 4.6% 0.7 0.6 0.6 0.8 0.9 0.9 1.3 1.6 1.5 6.4 8.1 8.0 10.3 13.8 13.8 12.2 20.1 21.0 1.2 1.5 1.4 13.0% -0.6% 5.3% 2.5% 2.5% 2.5% 0.67 0.51 0.49 -37.8% -23.1% -4.0% 6.80 7.06 7.29 0.26 0.26 0.26 31.4% 0.5% 2.3% Avg. Daily nb traded shares:53,298 Main shareholders: Cimigest 51.1%; Free float 22.6%; BPI 10.6%; Bestinver 10.5%; Profile: Semapa is a holding company with exposure to pulp and paper (with a significant interest in Portucel) and cement (via Secil). Semapa’s value should be closely linked to that of Portucel, and in the sense that Portucel is a listed company it makes it easier for investors to determine part of the overall market implicit NAV and the performance of Semapa’s stock price versus its asset portfolio at market prices. The main source of value of Semapa continues to come from its stake in Portucel, a pulp and paper company. Semapa is a holding that aggregates 76% of Portucel and 100% of Secil (Semapa is now the sole shareholder of Secil after buying CRH’s 49% of the company), amongst other small stakes in other areas. With Secil now fully consolidated and the bet on Brazil’s Supremo, the company is pursuing its desire to develop a growth strategy for the cement business. This strategy should be backed by the dividends from the pulp and paper area (Portucel), endogenous cash from cement activities and debt, but very much supported by Semapa’s stake in the first. SWOT Analysis Strengths • Portucel is one of the largest and most efficient pulp and paper producers in Europe • Very significant cash flow profile through its stake in Portucel • Leadership position in office paper through its stake in Portucel • One of the major cement players in Portugal Weaknesses • Heavily dependent on the economic cycle Opportunities • Investment in pulp capacity in Africa or LatAm cuts the distance to Chinese market and enhances margin • Development of biomass, namely acknowledging the potential for an upgrade revision in pricing policy • Expansion of cement production to high growth markets Threats • Economic slowdown • Portuguese cement market is approaching full maturity • Construction spending in Portugal very dependent on State investment programmes • Lower construction activity in its cement markets • Decrease in paper prices All share prices at 19/05/14. Recommendation: We reach a YE14 fair value of EUR 9.60 per share and a Hold recommendation. FINANCIAL CALENDAR (Source: Precise) PRICE (SHORT & LONG AVERAGE) titre 11 23/05/14 AGM 10 Target Price: EUR 9.60 2013 9 SEMAPA SMALL & MID CAPS SELECTION Analyst(s) 8 7 6 5 4 mar 11 jun 11 set 11 dez 11 mar 12 jun 12 set 12 dez 12 mar 13 jun 13 set 13 dez 13 mar 14 jun 14 Carlos Jesus +351 21 389 6812 Caixa-Banco de Investimento [email protected] Source : Factset 171 Italy SMALL & MID CAPS SELECTION EUR 8.47 Buy SIAS SIS.MI/SIS IM Market capitalisation: EUR 1928m Materials, Construction & Infrastructure EUR Sales (m) EBITDA (m) EBITDA margin EBIT (m) EBIT margin Net profit (reported) (m) Net profit (adj.) (m) Cash Flow from Ops.bef. chg in NWC (m) Net debt (Cash) (m) Net Debt/Equity Net Debt/EBITDA Interest cover (EBITDA/Fin. interest) ROCE (adj.) ROCE (adj.)/WACC EV / CE EV / Sales EV / EBITDA EV / EBIT P/E (adj.) P/BV OpFCF yield Dividend yield EPS (adj.) EPS (adj.) growth BVPS DPS Abs. Performances(12m,6m,3m,1m): 12 month High/low: EUR9.01 / 6.22 12/12 998 570 57.1% 310 31.0% 493 138 768 1,521 0.8 2.7 5.1 6.8% 1.0 0.6 2.7 4.7 8.6 11.6 0.9 4.2% 5.8% 0.61 -4.7% 7.58 0.41 15.1% 12/13 12/14e 12/15e 1,047 1,037 1,109 566 605 650 54.1% 58.4% 58.6% 308 324 341 29.4% 31.2% 30.7% 139 142 152 139 142 152 420 448 487 1,670 1,798 1,889 0.8 0.9 0.9 3.0 3.0 2.9 7.7 7.8 7.8 7.4% 7.3% -7.3% 1.1 1.1 0.7 0.7 0.7 2.7 3.2 3.1 5.0 5.5 5.3 9.2 10.2 10.1 11.8 13.6 12.7 1.0 1.1 1.1 -6.4% -4.0% -0.7% 14.2% 4.1% 4.8% 0.61 0.62 0.67 0.3% 2.1% 7.4% 7.38 7.65 7.91 1.20 0.35 0.40 11.1% 4.6% 0.5% Avg. Daily nb traded shares:163,195 Main shareholders: Gavio Group 73.3%; Free float 18.0%; Lazard AM 5.0%; Generali Group 3.6%; Profile: SIAS is the second largest national operator in motorways, managing 9 highway concessions in Italy for a total network of more than 1,000km. The average expiry for the motorway concessions is 2026. The company also operates in the technology sector through subsidiaries SINELEC and Euroimpianti Electronic and in the construction sector (motorway infrastructure maintenance and expansion services primarily for group concession operators) through subsidiary ABC Costruzioni and Itinera. SWOT Analysis Strengths • Long term duration of the concession portfolio • New focus only on highway management-core business Weaknesses • Economic slowdown could negatively affect group’s results • Capex profile will remain at peak level for 2-3 years and this can drain FCF generation Opportunities • New law on concessions Threats • high oil price could hit light vehicles traffic • Acquisition of other concessions • A rise in interest rates • Increased regulatory risk Lengthening of concessions - It is our understanding the Italian government is considering approving a new regulation on concessions. The Italian government in order to lower the impact of the investments on tariff increases could approve a decree aimed at incentivizing the merger of concessions (according to some statements by the Minister of Infrastructure). The goal of this law would be to smooth the tariff increases which can be particularly high because of a prolonged period of weak traffic and because of a close concession expiry. The main features of the foregoing law, according to press rumours, would be the alignment of the concession expiry to the longest one between the companies involved in the merger and the chance to spread the tariff increases among different concessions. Tem/Brebemi – Sias invested around EUR 270m in the projects «BreBeMi» and «Tem». Once completed these two new motorways could sizeably increase the company’s revenues and EBITDA (around EUR 400m cumulated per year once completed). All share prices at 19/05/14. FINANCIAL CALENDAR (Source: Precise) PRICE (SHORT & LONG AVERAGE) titre Italian traffic is improving - the traffic on Italian network was up 1.5% y/y in the first four months of the year with the “heavy” component rising 2.3% y/y. 9.0 8.5 Recommendation: We confirm our positive view on the stock on the back of better traffic and higher tariffs. 8.0 7.5 Target Price: EUR 10.00 7.0 6.5 6.0 Analyst(s) 5.5 Francesco Sala 5.0 4.5 Mar 11 Source : Factset 172 Jun 11 Sep 11 Dec 11 Mar 12 Jun 12 Sep 12 Dec 12 Mar 13 Jun 13 Sep 13 Dec 13 Mar 14 Jun 14 Banca Akros +39 02 4344 4240 [email protected] Switzerland SMALL & MID CAPS SELECTION CHF 158.00 Buy SIEGFRIED HOLDING AG SFZN.S/SFZN SW Market capitalisation: CHF 620m General Industrials CHF Sales (m) EBITDA (m) EBITDA margin EBIT (m) EBIT margin Net profit (reported) (m) Net profit (adj.) (m) Cash Flow from Ops.bef. chg in NWC (m) Net debt (Cash) (m) Net Debt/Equity Net Debt/EBITDA Interest cover (EBITDA/Fin. interest) ROCE (adj.) ROCE (adj.)/WACC EV / CE EV / Sales EV / EBITDA EV / EBIT P/E (adj.) P/BV OpFCF yield Dividend yield EPS (adj.) EPS (adj.) growth BVPS DPS Abs. Performances(12m,6m,3m,1m): 12 month High/low: CHF170.00 / 123.40 12/12 368 44.2 12.0% 16.8 4.6% 20.9 20.9 70.4 -25.8 -0.1 -0.6 22.0 12/13 375 64.9 17.3% 40.1 10.7% 53.7 47.6 64.3 -50.4 -0.1 -0.8 nm 12/14e 371 72.0 19.4% 42.0 11.3% 42.0 42.0 75.0 -6.7 0.0 -0.1 24.0 12/15e 397 78.5 19.8% 45.5 11.5% 46.5 46.5 81.5 -21.7 -0.1 -0.3 39.3 Profile: Siegfried is a contract manufacturing organization offering the manufacture of drub substances and drug products to the pharmaceutical and biotechnology industry. Sites in Zofingen (Switzerland), Hal Far (Malta), Pennsville (New Jersey), Irvine (California); a site in Nantong near Shanghai is under construction. SWOT Analysis Strengths • Servcie offering comprises drug substances as well as drug products • Broad customer base Weaknesses • Relatively low margins • Relative lack of "anchor" investors • Balanced portfolio of services 1.0 8.3 21.8 20.5 1.4 5.9% 0.8% 5.56 117.8% 84.20 0.97 23.5% 1.3 7.8 12.6 13.3 1.7 3.7% 0.7% 12.14 118.2% 92.40 1.09 2.3% 1.6 1.5 8.3 7.5 14.2 12.9 14.8 13.4 1.6 1.5 -6.8% 3.9% 0.9% 1.1% 10.71 11.82 -11.8% 10.4% 99.62 107.64 1.50 1.80 -3.7% -2.5% Avg. Daily nb traded shares:1,471 Main shareholders: Free float 74.6%; Tweedy Browne 9.9%; Rainer Marc Frey 9.5%; KSK Biberach 3.6%; • Profitable operations, strong balance sheet Opportunities • Growth of the contract manufacturing market Threats • Operational risks • Capacity expansion • Long-term risks related to the pharmaceutical market • Margin expansion Recommendation: We rate Siegfried shares a Buy, as we expect a 15% basic EPS CAGR 2012-2020 on the basis of strong top-line growth, operating leverage and various efficiency measures. We set a DCFderived price target of CHF202. For detail, please refer to our 32-page fundamental report published on January 7, 2014. All share prices at 19/05/14. Target Price: CHF 202.00 FINANCIAL CALENDAR (Source: Precise) PRICE (SHORT & LONG AVERAGE) titre 180 170 160 150 SIEGFRIED HOLDING AG SMALL & MID CAPS SELECTION Analyst(s) Marietta Miemietz CFA 140 130 +49-69-58997-439 Equinet Bank [email protected] 120 110 100 90 80 Mar 11 Jun 11 Sep 11 Dec 11 Mar 12 Jun 12 Sep 12 Dec 12 Mar 13 Jun 13 Sep 13 Dec 13 Mar 14 Jun 14 Source : Factset 173 Belgium SMALL & MID CAPS SELECTION EUR 63.50 Hold SIPEF SIFB.BR/SIP BB Market capitalisation: EUR 568m Food & Beverage USD Sales (m) EBITDA (m) EBITDA margin EBIT (m) EBIT margin Net profit (reported) (m) Net profit (adj.) (m) Cash Flow from Ops.bef. chg in NWC (m) Net debt (Cash) (m) Net Debt/Equity Net Debt/EBITDA Interest cover (EBITDA/Fin. interest) ROCE (adj.) ROCE (adj.)/WACC EV / CE EV / Sales EV / EBITDA EV / EBIT P/E (adj.) P/BV OpFCF yield Dividend yield EPS (adj.) EPS (adj.) growth BVPS DPS Abs. Performances(12m,6m,3m,1m): 12 month High/low: EUR63.60 / 50.00 12/12 242 78.5 32.4% 68.6 28.4% 49.8 44.3 55.7 -13.3 0.0 -0.2 nm 12.1% 1.4 1.3 2.3 6.9 7.9 11.4 1.5 -1.7% 2.7% 4.95 -28.2% 38.48 1.59 15.4% 12/13 213 69.9 32.8% 57.8 27.2% 40.8 34.0 46.8 23.3 0.1 0.3 nm 9.0% 1.0 1.2 2.7 8.2 10.0 15.3 1.4 -3.9% 1.9% 3.80 -23.3% 41.37 1.21 15.1% 12/14e 12/15e 230 230 85.3 84.4 37.0% 36.6% 72.3 70.6 31.4% 30.6% 47.6 46.8 40.2 38.6 56.1 55.4 21.9 20.2 0.1 0.0 0.3 0.2 37.8 50.1 10.3% 9.4% 1.2 1.1 1.2 1.1 2.7 2.7 7.3 7.4 8.7 8.8 14.1 14.7 1.4 1.3 2.4% 2.6% 2.0% 2.0% 4.49 4.32 18.3% -3.9% 45.80 49.77 1.26 1.26 9.5% 2.7% Avg. Daily nb traded shares:3,387 Profile: Sipef's primary activity consists in taking stakes in palm oil, natural rubber, banana and tea plantations. These activities generally include downstream industrial as well as commercial activities. Sipef markets its own products and at times those of other producers, enabling it to earn commission income. Its holdings are concentrated mainly in southeast Asia. Sipef has holdings in nine plantations in Indonesia and two in Papua New Guinea (PNG). These plantations mainly produce crude palm oil (CPO), palm kernels, rubber and tea, and account together for ca. 93% of the group's gross profit. Sipef aims to increase its planted acreage from 52,280 ha (group’s share) at the end of FY13 to 100,000 ha in 2020, through the expansion of its existing plantations, the buy-out of minorities and new projects. SWOT Analysis Strengths • Management’s skills for tropical plantations • Favourable cost base of the Indonesian plantations • All plantations are vertically integrated • 100% of the crude palm oil production is Roundtable on Sustainable Palm Oil (RSPO) certified Opportunities • Expansion of planted areas & acquisitions of other plantations / green fields • Acquisition of minority interests in plantation managed by Sipef • Demand from Asian emerging markets like China and India + demand from bio-diesel industry All share prices at 19/05/14. PRICE (SHORT & LONG AVERAGE) FINANCIAL CALENDAR titre 75 Recommendation: 1Q14 crude palm oil production was particularly strong in North Sumatra as well as in Papua New Guinea, with double digit growth. However, the comparison base was very favourable for both Tolan Tiga and Hargy Oils. 62% of the expected CPO sales have already been placed on the market at an average price equivalent to USD 948/t CIF Rotterdam. In addition, 41% of rubber volumes were sold at an average of USD 2,179/t FOB and a third of the tea volumes at ±USD 2,330/t FOB. Given the potential risk associated to El Niño, we do not change our production estimate for FY14 (+9% for the own CPO production). However, given the higher than expected proportion of CPO volumes already sold at slightly better terms, we have further increased our average CPO price for FY14 by USD 11/t. HOLD. 11/06/2014: AGM 70 Target Price: EUR 65.00 65 21/08/2014: 1H14 results 60 55 23/10/2014: 3Q14 trading update 50 45 Mar 11 Source : Factset 174 Threats • Mainly active in countries with a political risk (Indonesia and Papua New Guinea) • Weakness of the USD versus EUR or versus IDR and/or PGK (50% of the production costs are in local currency) • Substitution risk of the natural rubber by synthetic rubber • Strong increase in labour costs both in Indonesia and in Papua New Guinea Main shareholders: Free float 49.7%; Baron Bracht family + AVH 39.6%; FIM Belgium 5.5%; Alcatel Pensioenfonds 5.3%; Weaknesses • High dependence on one crop (palm oil accounted for ca. 80% of the gross profit) • Negative image of the crude palm oil in some regions due to the deforestation in Indonesia • Size of the market capitalisation and low liquidity of the share Jun 11 Sep 11 Dec 11 Mar 12 Jun 12 Sep 12 Dec 12 Mar 13 Jun 13 Sep 13 Dec 13 Mar 14 Jun 14 SIPEF Analyst(s) Bernard Hanssens Bank Degroof +32 (0) 2 287 9689 [email protected] Netherlands SMALL & MID CAPS SELECTION EUR 30.50 Buy SLIGRO SLIGR.AS/SLIGR NA Market capitalisation: EUR 1331m Food & Drug Retailers EUR Sales (m) EBITDA (m) EBITDA margin EBIT (m) EBIT margin Net profit (reported) (m) Net profit (adj.) (m) Cash Flow from Ops.bef. chg in NWC (m) Net debt (Cash) (m) Net Debt/Equity Net Debt/EBITDA Interest cover (EBITDA/Fin. interest) ROCE (adj.) ROCE (adj.)/WACC EV / CE EV / Sales EV / EBITDA EV / EBIT P/E (adj.) P/BV OpFCF yield Dividend yield EPS (adj.) EPS (adj.) growth BVPS DPS Abs. Performances(12m,6m,3m,1m): 12 month High/low: EUR31.17 / 25.50 12/12 2,467 142 5.8% 88.5 3.6% 68.6 68.6 119 73.1 0.1 0.5 26.9 10.3% 1.4 1.6 0.4 7.2 11.6 13.9 1.7 8.7% 4.8% 1.56 -12.4% 12.64 1.05 18.0% 12/13 2,498 142 5.7% 88.5 3.5% 68.0 68.0 115 37.8 0.1 0.3 31.2 10.7% 1.4 2.0 0.5 9.0 14.4 18.2 2.2 7.2% 3.4% 1.55 -0.6% 13.02 1.05 12.6% 12/14e 12/15e 2,615 2,723 153 163 5.9% 6.0% 98.8 108 3.8% 4.0% 74.9 83.2 74.9 83.2 126 134 10.0 -26.8 0.0 0.0 0.1 -0.2 33.6 47.9 11.7% 13.0% 1.6 1.7 2.1 2.0 0.5 0.5 8.8 8.0 13.6 12.0 17.8 15.9 2.2 2.1 6.2% 6.6% 3.9% 4.3% 1.72 1.92 10.7% 11.7% 13.66 14.36 1.20 1.30 4.3% -0.4% Avg. Daily nb traded shares:6,345 Main shareholders: Free float 34.2%; St. adm. kantoor Slippens 34.0%; Darlin 6.1%; ING Groep 5.4%; FMR 5.2%; Arkelhave 5.1%; Boron Investments 5.0%; T. van Wettum 5.0%; All share prices at 19/05/14. FINANCIAL CALENDAR (Source: Precise) PRICE (SHORT & LONG AVERAGE) t i t re 32 Profile: Sligro Food Group is active on the Dutch market as a food service company and as a food retailer. In food retail, Sligro has a market share of about 3%. It operates the Em-Té format. Sligro is the leader in the foodservice market in the Netherlands operating >40 cash-and-carry stores and >10 distribution centres. Its market share in foodservice amounts to c. 20%. In the sub-segment cash-and-carry, market share is 35%. SWOT Analysis Strengths • Strong and dedicated management team Weaknesses • Profitability of Sligro's food retail format • Membership of larger buying consortium • Price/quality positioning of food retail • Competitive advantage from a vertically integrated business model in fresh ranges • Large marketleadership in cash-and-carry • Small market share food retail Opportunities • Improve the positioning of Em-Té in order to improve floor productivity • Apply best practices from food retail in foodservice and vice versa • Benefit from consolidation in the foodservice market Threats • Sligro is more cyclical than a pure food retailer due to the foodservice activities • Competitive pricing environment • Execution regarding conversion of all stores to the new Em-té format Recommendation: We rate Sligro shares Buy with a target price of EUR 35. Our recommendation is based on 1) Continued growth despite continued difficult market conditions in the Netherlands, where consumers’ disposable income is under pressure and unemployment is high in a historical context. As a consequence, competition in the industry is fierce. 2) Sligro’s foodservice business remains the star performer of the company. We expect it to continue gaining market share due to its focus on specific customer segments and operational excellence. Still, market circumstances in this part of the business also remain difficult. 3) The food retail segment is under scrutiny as it needs to improve profitability. 4) We believe Sligro is a good example of a company with a management team that has a clear focus on long-term goals. 5) Integration of acquisitions is a core competence. 6) Conditions in 2014 are incidentally very positive as good weather 1H14 supports sales, and the bankruptcy of competitor De Kruidenier adds 4% to growth for Sligro Group. Based on our DCF outcome, we rate the stock a BUY. Target Price: EUR 35.00 30 28 26 SLIGRO SMALL & MID CAPS SELECTION Analyst(s) 24 22 20 18 Mar 11 Jun 11 Sep 11 Dec 11 Mar 12 Jun 12 Sep 12 Dec 12 Mar 13 Jun 13 Sep 13 Dec 13 Mar 14 Jun 14 Gerard Rijk + 31 (0)20 550 8572 SNS Securities [email protected] Source : Factset 175 Italy SMALL & MID CAPS SELECTION EUR 3.94 Accumulate SOGEFI SGFI.MI/SO IM Market capitalisation: EUR 460m Automobiles & Parts EUR Sales (m) EBITDA (m) EBITDA margin EBIT (m) EBIT margin Net profit (reported) (m) Net profit (adj.) (m) Cash Flow from Ops.bef. chg in NWC (m) Net debt (Cash) (m) Net Debt/Equity Net Debt/EBITDA Interest cover (EBITDA/Fin. interest) ROCE (adj.) ROCE (adj.)/WACC EV / CE EV / Sales EV / EBITDA EV / EBIT P/E (adj.) P/BV OpFCF yield Dividend yield EPS (adj.) EPS (adj.) growth BVPS DPS Abs. Performances(12m,6m,3m,1m): 12 month High/low: EUR4.98 / 2.17 12/12 1,319 121 9.2% 62.8 4.8% 29.3 32.5 90.9 296 1.4 2.4 7.3 9.7% 1.5 1.1 0.4 4.2 8.2 7.0 1.2 16.8% 7.6% 0.28 11.9% 1.68 0.15 76.2% 12/13 12/14e 12/15e 1,355 1,379 1,459 126 137 166 9.3% 9.9% 11.4% 69.1 73.6 99.4 5.1% 5.3% 6.8% 21.1 26.0 41.1 32.0 38.8 45.9 82.0 92.1 113 305 325 322 1.6 1.5 1.3 2.4 2.4 1.9 4.4 4.9 5.8 10.6% 11.2% 12.4% 1.6 1.7 1.9 1.7 1.5 1.4 0.6 0.6 0.6 6.6 6.0 4.9 12.1 11.1 8.2 15.9 11.9 10.0 3.0 2.4 2.1 2.3% -0.7% 4.0% 0.0% 3.2% 0.0% 0.27 0.33 0.39 -1.5% 21.2% 18.5% 1.44 1.67 1.89 0.00 0.13 0.00 -5.4% -4.6% -16.9% Avg. Daily nb traded shares:148,642 Profile: Sogefi is a TIER 1 automotive component supplier; the company is the EU leader in the automotive filtration system market with a ~60% share; Sogefi has also a strong positioning in LAT AM in this business (~40% of market share). Sogefi also produces suspension systems with significant shares both in Europe and Latin America. Sogefi recorded ~64% of its FY13 revenues in Europe (~-2% Y/Y), ~17% of them in Latin America (~-3% Y/Y), 14% in the NAFTA area (~+24% Y/Y) and ~5% in Asia (+6% Y/Y). After years of growth through acquisitions, the recently-appointed CEO intends to focus more on organic growth and on boosting/developing the internal technological skills of the company; Sogefi has sped-up the European footprint restructuring in 2013 and 2014 and the company's margins should benefit from both the ongoing European recovery and a more efficient cost base. SWOT Analysis Strengths • Good client/geographic diversification Weaknesses • Sogefi relies for ~60% of its revenues on Europe • Skilled management team • Sogefi is much smaller than many competitors • Good ability for product innovation Opportunities • Growth in developing countries • Launch of the first composite suspensions • A recovery in the truck market may grant a margin expansion Threats • Competition from low cost countries, especially in the filtration business • EU-South Korea free-trade agreement is likely to increase the competitive pressure • Mature and very competitive reference market Main shareholders: CIR 56.3%; Free float 35.9%; JP MORGAN AM 5.0%; Giovanni Germano 2.7%; All share prices at 19/05/14. FINANCIAL CALENDAR (Source: Precise) PRICE (SHORT & LONG AVERAGE) titre 5.0 4.5 4.0 Recommendation: Sogefi revenues came in at EUR 1.3bn in 2013 (~+1% Y/Y), EBITDA reached EUR 126m (~+4% Y/Y, at 9.5% of revenues), while EBIT was ~EUR 69m (+10% Y/Y, at 5.2% of revenues); the bottom line recorded a EUR 21m net profit (-28% Y/Y, due to higher restructuring costs), while the NFP came in at EUR -305m (EUR -296m as at the end of 2012). The European car and heavy truck market is recovering and Sogefi is set to benefit from this trend; the company is posting strong growth rates in North America and Asia, while Latin American operations may suffer in the short term. We expect Sogefi’s top line to grow moderately, with slightly improving operating margin: we expect a stronger growth next year. Sogefi trades at 11.9x in terms of P/E, when the European industry trades at ~13.5x; our DCF model gives us a EUR 5.0 target price; we advise to accumulate the stock. Target Price: EUR 5.00 3.5 3.0 SOGEFI SMALL & MID CAPS SELECTION Analyst(s) 2.5 2.0 1.5 Mar 11 Source : Factset 176 Jun 11 Sep 11 Dec 11 Mar 12 Jun 12 Sep 12 Dec 12 Mar 13 Jun 13 Sep 13 Dec 13 Mar 14 Jun 14 Gabriele Gambarova +39 02 43 444 289 Banca Akros [email protected] Italy SMALL & MID CAPS SELECTION EUR 2.17 Accumulate SORIN SORN.MI/SRN IM Market capitalisation: EUR 1039m Healthcare EUR Sales (m) EBITDA (m) EBITDA margin EBIT (m) EBIT margin Net profit (reported) (m) Net profit (adj.) (m) Cash Flow from Ops.bef. chg in NWC (m) Net debt (Cash) (m) Net Debt/Equity Net Debt/EBITDA Interest cover (EBITDA/Fin. interest) ROCE (adj.) ROCE (adj.)/WACC EV / CE EV / Sales EV / EBITDA EV / EBIT P/E (adj.) P/BV OpFCF yield Dividend yield EPS (adj.) EPS (adj.) growth BVPS DPS Abs. Performances(12m,6m,3m,1m): 12 month High/low: EUR2.31 / 1.90 12/12 731 96.7 13.2% 36.9 5.1% 23.0 12/13 12/14e 12/15e 738 767 794 131 138 143 17.8% 18.0% 18.0% 70.1 82.0 92.5 9.5% 10.7% 11.6% 49.9 61.8 68.6 49.9 61.8 68.6 111 118 119 68.7 13.1 -52.3 0.1 0.0 -0.1 0.5 0.1 -0.4 12.7 20.7 36.1 9.7% 11.2% 12.5% 1.0 1.5 1.7 1.6 1.6 1.4 1.5 1.5 1.3 8.7 8.2 7.5 16.3 13.8 11.6 16.8 16.8 14.7 1.6 1.5 1.4 3.3% 5.1% 5.9% 0.0% 0.0% 0.0% 0.12 0.13 0.15 157.5% 4.5% 14.3% 1.27 1.40 1.55 0.00 0.00 0.00 5.1% -3.6% 3.0% Avg. Daily nb traded shares:906,212 82.8 87.8 0.2 0.9 6.8 5.4% 0.6 1.4 1.3 10.1 26.4 35.0 1.4 6.7% 0.0% 0.05 -60.3% 1.17 0.00 2.3% Main shareholders: Free float 70.0%; Bios 18.9%; Equinox two 6.6%; Unipol 4.5%; All share prices at 19/05/14. FINANCIAL CALENDAR (Source: Precise) PRICE (SHORT & LONG AVERAGE) titre 2.4 30/07/14 Results 2.2 2.0 1.8 1.6 1.4 2014H1 Profile: Sorin is currently one of the main players in the manufacture of medical devices for the treatment of cardiovascular diseases. It develops, manufactures and markets medical technologies for cardiac surgery and for the treatment of cardiac rhythm disorders. The group focuses on 3 major therapeutic areas 1) cardiopulmonary (global market leader with 40% market share); 2) HV - heart valve repair and replacement (global market share above 10% due to a large market share of around 30% in mechanical valves and growing opportunities in tissue valves, especially thanks to the penetration of the US market and the launch of an innovative satureless biological valve); 3) CRM - cardiac rhythm management (with strong presence in some key European countries and in Japan). SWOT Analysis Strengths • Global leadership in Heart-lung machines Weaknesses • High R&D costs to maintain its competitiveness • Strong relationship with cardiac surgeons • Strong impact of exchange rates • Good management track-record in restructuring • Sudden changes in the health regulation • Stable profitability and strong cash flow generation • Potential risk of delay in obtaining approval of new products by Medical Authorities Threats • Increasing competition in the future due to the continuous growth of minimally invasive procedures • Further strengthening of big US competitors through potential consolidation processes Opportunities • Further penetration in the emerging markets • Further expansion in the USA (especially in HV and CRM) • New acquisitions to increase its critical mass • Development of new technological platforms Feasible strategic plan (2013-2018): the business plan presented last November, which updates the previous plan (September 2012), confirms the growth trend of sales (organic and through bolt-on acquisitions) and shows that there is room to significantly improve the group’s net profit (FY18 EPS >20 and cumulated FCF at EUR 350-400m). FY2013: it was the year in which sales and profitability completely recovered after the negative impact of the earthquake in May/June 2012. 2014/15: these will be the years in which the group will consolidate its market position and continue to grow in the base businesses and, at the same time, invest in the new growth platforms and in the emerging markets. 2016/18: this is when growth will accelerate thanks to the market launch of new technologies (oxygenators Inspire, valve Perceval, SonR and KORA in CRM) and an increase in emerging market penetration. Recommendation: we confirm our Accumulate recommendation and our target price of EUR 2.70 per share (valuation based on DCF model - WACC 7.4% and 1.5% perpetual growth rate). Speculative appeal: we remind investors that the main shareholders are currently financial investors: the shareholders pact signed in October 2009 expired on 18th November 2013; so, after two placements in the last few months for about 51.5m shares, the current free float is 70.0% from 52.6% in 2010. Considering that financial investors are normally targeting their return on investment over a shorter period, compared to industrial owners, we see a speculative potential for the stock. We do not believe the remaining stake held by Unipol (4.5%), the last stakeholder of the old pact, can represent any drag on the stock performance. Target Price: EUR 2.70 1.2 1.0 Mar 11 Source : Factset Jun 11 Sep 11 Dec 11 Mar 12 Jun 12 Sep 12 Dec 12 Mar 13 Jun 13 Sep 13 Dec 13 Mar 14 Jun 14 Analyst(s) Paola Saglietti Banca Akros +39 02 4344 4287 [email protected] 177 Finland SMALL & MID CAPS SELECTION EUR 3.71 Hold SPONDA SDA1V.HE/SDA1V FH Market capitalisation: EUR 1050m Real Estate EUR 12/12 258 177 66.9% 41 (68) 91 105 105.04 1,698 3,345 2,717 0.37 0.17 4.44 (19.0%) 4.84 10.3% 4.7% 15.4 10 2.6 1,698 48.2% -13.7% 12/13 12/14e 12/15e 257 241 222 EBITDA (m) 177 160 144 EBITDA margin 67.1% 65.2% 65.1% Portfolio Result (m) (11) (4) 0 Net Financial Result (60) (55) (54) Net Profit (reported)(m) 102 79 69 Net Profit (adj.)(m) 114 103 88 Funds From Operations 113.72 102.67 87.58 Net Debt (m) 1,762 1,654 1,680 Portfolio Value (m) 3,342 3,098 3,143 Enterprise Value (m) 2,730 2,705 2,730 EPS (adj.) 0.40 0.36 0.31 DPS 0.18 0.18 0.18 IFRS NAVPS 4.64 4.73 4.80 Premium/(discount) (26.2%) (21.5%) (22.7%) EPRA NAVPS 5.29 5.41 5.45 Earnings adj. yield 10.8% 9.8% 8.3% Dividend yield 4.9% 4.9% 4.9% EV/EBITDA 15.4 16.9 18.9 P/E (adj.) 9 10 12 Int. cover(EBITDA/Fin.int) 3.0 2.9 2.7 Net debt/(cash) (m) 1,762 1,654 1,680 Net Debt/Total Assets 50.8% 48.4% 48.6% Abs. Performances(12m,6m,3m,1m): 0.3% -3.1% -1.9% 12 month High/low: EUR4.40 / 3.34 Avg. Daily nb traded shares:81,803 Main shareholders: Free float 85.1%; Oy Palsk Ab 14.9%; Keskinäinen Työeläkevakuutusyhtiö Varma 10.3%; Gross Rental Income (m) Keskinäinen Eläkevakuutusyhtiö Ilmarinen 9.6%; Profile: Sponda is a real estate investment company focused on office space in the Helsinki central business district and Ruoholahti. In addition to owning office space in Finland and Russia, the company has retail and logistics properties in Finland. The Finnish properties are in the Helsinki metropolitan area, Oulu, Tampere and Turku, and the Russian properties in St. Petersburg and Moscow. The company has decided to exit from Russia, logistics and Turku within 3–5 years and to focus on retail and office space in the Helsinki metropolitan area and Tampere. SWOT Analysis Strengths • Focuses on prime office and retail properties in Helsinki and Tampere Weaknesses • High vacancy rate • Property portfolio includes several weaker holdings Opportunities • Successful implementation of strategy to sell logistics and Russian portfolio • Increasing volume of property development Threats • Weak trend in office demand persisting for long • Abruptly rising interest rates increasing financing costs Recommendation: While Sponda's P/NAV and P/E ratios are among the sector’s lowest, EBITDA/EV15e is at 5.5%, which we consider fair for Sponda's current assets. Further upside would require recycling of capital from high-yield non-core to low-yield core in accordance with strategy, with no impact on cash flow. All share prices at 19/05/14. Target Price: EUR 3.90 FINANCIAL CALENDAR (Source: Precise) PRICE (SHORT & LONG AVERAGE) titre 4.4 01/08/14 Results 4.2 4.0 3.8 3.6 3.2 3.0 2.8 2.6 Mar 11 178 SPONDA SMALL & MID CAPS SELECTION Analyst(s) Matias Rautionmaa 3.4 Source : Factset 2014Q2 Jun 11 Sep 11 Dec 11 Mar 12 Jun 12 Sep 12 Dec 12 Mar 13 Jun 13 Sep 13 Dec 13 Mar 14 Jun 14 +358 10 252 4408 Pohjola [email protected] France SMALL & MID CAPS SELECTION EUR 56.20 Hold STALLERGÈNES GENP.PA/GENP FP Market capitalisation: EUR 755m Healthcare EUR Sales (m) EBITDA (m) EBITDA margin EBIT (m) EBIT margin Net profit (reported) (m) Net profit (adj.) (m) Cash Flow from Ops.bef. chg in NWC (m) Net debt (Cash) (m) Net Debt/Equity Net Debt/EBITDA Interest cover (EBITDA/Fin. interest) ROCE (adj.) ROCE (adj.)/WACC EV / CE EV / Sales EV / EBITDA EV / EBIT P/E (adj.) P/BV OpFCF yield Dividend yield EPS (adj.) EPS (adj.) growth BVPS DPS Abs. Performances(12m,6m,3m,1m): 12 month High/low: EUR61.92 / 50.08 12/12 240 69.4 28.9% 55.6 23.2% 37.4 37.4 56.8 -90.4 -0.5 -1.3 nm 36.9% 3.7 4.9 2.0 7.0 8.8 15.5 3.1 5.3% 1.3% 2.77 1.2% 13.91 0.75 9.6% 12/13e 245 71.3 29.2% 57.2 23.4% 40.4 40.4 54.5 -120 -0.6 -1.7 nm 37.7% 3.8 6.1 2.5 8.5 10.7 18.2 3.4 5.5% 1.3% 2.99 8.0% 16.16 0.75 2.1% 12/14e 12/15e 264 284 80.3 86.8 30.5% 30.5% 65.9 72.0 25.0% 25.3% 45.2 49.4 45.2 49.4 59.6 64.1 -155 -193 -0.6 -0.7 -1.9 -2.2 nm nm 43.4% 47.3% 4.4 4.8 6.0 5.6 2.3 2.0 7.5 6.5 9.1 7.8 16.8 15.4 3.0 2.6 6.0% 6.5% 1.4% 1.8% 3.34 3.65 11.9% 9.2% 18.77 21.65 0.80 1.00 0.3% -2.4% Avg. Daily nb traded shares:1,159 Main shareholders: ArŠs Life Sciences 73.2%; Free float 22.8%; Personal and managers 4.0%; Profile: Specialist in Specific ImmunoTherapy (SIT), a desensitisation method of treating allergies, tailored to individual patients. The allergy market is worth over EUR16bn; SIT is a fast-growing niche (~10% per annum) worth roughly EUR800m. Few players are present on this highly concentrated market: the top three account for two-thirds of total sales. Stallergènes, market leader in terms of the number of patients treated, makes just about all its sales in Europe, and half in its home market (France). Change in this market is being driven by innovation (galenic forms, packaging, etc.). Stallergènes has been leading the way in SIT: it was the first to introduce sublingual treatments, which are more easily administered than subcutaneous ones. The next stage, the tablet formulation of Oralair, should allow Stallergènes to change dimension by extending its market considerably due to a more convenient formulation. SWOT Analysis Strengths • SIT is a highly concentrated niche market, led by StallergŠnes • Expertise acknowledged by sector professionals (practitioners and medical authorities) • Tablets are a more convenient formulation Weaknesses • Significant marketing effort needed to promote Oralair in the US • The company is mainly focused in Europe Opportunities • Tablet formulations are set to broaden the SIT market considerably. • The SIT market is set to double in size by 2020 and exceed EUR2bn. • American market is as big as the European one Threats • Alk-Abell¢ signed a partnership with Merck & Co to launch Grazax in the US • FDA decision • Greer's commitment to commercial success of Oralair • Asthma market: SIT should make it possible to better control this pathology Treasury stocks 0.1%; All share prices at 19/05/14. FINANCIAL CALENDAR (Source: Precise) PRICE (SHORT & LONG AVERAGE) Recommendation: Although performance for Q1 2014 fell slightly short of expectations, Stallergenes confirmed its FY target of low single-digit growth. After the recent approval of Oralair by the FDA in early April 2014, the group is now focused on marketing Oralair in the US, a market that is twice as big as Europe. However, the ramp-up of Oralair in the US will likely only gradually feed through to Stallergènes’ results. Target Price: EUR 60.00 titre 60 17/06/14 Analyst Meeting 55 27/05/14 AGM 50 45 40 35 Mar 11 2013 STALLERGÈNES SMALL & MID CAPS SELECTION Analyst(s) Arsène Guekam Jun 11 Sep 11 Dec 11 Mar 12 Jun 12 Sep 12 Dec 12 Mar 13 Jun 13 Sep 13 Dec 13 Mar 14 +33 1 45 96 78 76 CM - CIC Securities [email protected] Jun 14 Source : Factset 179 Finland SMALL & MID CAPS SELECTION EUR 10.11 Reduce STOCKMANN STCBV.HE/STCBV FH Market capitalisation: EUR 728m General Retailers EUR Sales (m) EBITDA (m) EBITDA margin EBIT (m) EBIT margin Net profit (reported) (m) Net profit (adj.) (m) Cash Flow from Ops.bef. chg in NWC (m) Net debt (Cash) (m) Net Debt/Equity Net Debt/EBITDA Interest cover (EBITDA/Fin. interest) ROCE (adj.) ROCE (adj.)/WACC EV / CE EV / Sales EV / EBITDA EV / EBIT P/E (adj.) P/BV OpFCF yield Dividend yield EPS (adj.) EPS (adj.) growth BVPS DPS Abs. Performances(12m,6m,3m,1m): 12 month High/low: EUR13.94 / 10.04 12/12 2,116 162 7.6% 87.5 4.1% 52.5 52.5 127 813 0.9 5.0 4.9 3.8% 0.6 1.0 0.8 11.0 20.2 18.7 1.1 8.0% 4.4% 0.73 68.2% 12.40 0.60 -12.7% 12/13 12/14e 12/15e 2,037 2,002 2,050 129 124 151 6.3% 6.2% 7.4% 54.5 50.6 76.8 2.7% 2.5% 3.7% 48.5 12.4 38.1 48.5 12.4 38.1 123 86.1 112 781 781 757 0.9 0.9 0.9 6.1 6.3 5.0 4.7 4.6 5.4 2.5% 2.3% 3.5% 0.4 0.3 0.5 0.9 0.9 0.9 0.8 0.7 0.7 12.0 12.0 9.7 28.5 29.4 19.1 16.4 nm 19.1 0.9 0.8 0.8 6.4% 4.3% 5.4% 4.0% 1.5% 4.0% 0.67 0.17 0.53 -7.6% -74.4% nm 12.42 12.05 12.29 0.40 0.15 0.40 -10.8% -15.9% -2.1% Avg. Daily nb traded shares:12,113 Main shareholders: Free float 100.0% (0.0%); HTT STC Holding Oy Ab 11.7%; Föreningen Konstsamfundet -ryhmä 9.4%; Svenska litteratursällskapet i Finland r.f. 7.6%; All share prices at 19/05/14. FINANCIAL CALENDAR (Source: Precise) PRICE (SHORT & LONG AVERAGE) Profile: Stockmann's operations comprise the department store business and fashion chain business including two affordable fashion chains, Lindex and Seppälä. The divisions operate in 13 countries. The Department Store Division with its 16 department stores brings in around 60% of the group's sales, while the Fashion Chains Division represents 40%. Of the most important market areas, Finland accounts for 50%, Sweden and Norway for 26%, Russia and Ukraine for 17%, and the Baltic countries, Czech Republic and Slovakia for 7% of sales. The company's strategy for internationalisation has been to open on average one department store per year in Russia but, after the Ukraine crisis, the planned expansion is on hold. SWOT Analysis Strengths • Strong brands Weaknesses • Ownership structure and two share series reduce the share's liquidity and limit any bigger corporate structuring •projects Large amount of goodwill • Excellently located department stores • Well known in the growing markets of Russia Opportunities • Russia still offers significant growth prospects Threats • Weak consumer confidence and spending in Finland • The sizeable capex programme has been completed cash flow clearly strengthening • Volatile raw material prices • Intensifying competition in the fashion trade • Increasing of internet retail trade Recommendation: Stockmann has suffered from poor consumer demand in Finland. In Russia, too, the economic situation has turned out to be more cautious. Operating result in both of these countries is in the red and, at the moment, basically all earnings are generated in Sweden by Lindex operations. Stockmann’s guidance expects that top-line will be slightly down and operating profit will not exceed last year’s level. Monthly sales figures have been characterised by weak consumer demand in Finland. We believe that cost savings and strategic reorganizations will continue. The major investments have now been completed and therefore the company’s cash flow should remain stable. In our view, the share’s valuation is not attractive and the share lacks short-term drivers. titre 22 Target Price: EUR 10.00 20 18 16 STOCKMANN SMALL & MID CAPS SELECTION Analyst(s) 14 12 10 8 Mar 11 Source : Factset 180 Jun 11 Sep 11 Dec 11 Mar 12 Jun 12 Sep 12 Dec 12 Mar 13 Jun 13 Sep 13 Dec 13 Mar 14 Jun 14 Jari Raisanen +358 10 252 4504 Pohjola [email protected] Germany SMALL & MID CAPS SELECTION EUR 28.40 Hold SURTECO SURG.DE/SUR GR Market capitalisation: EUR 440m Basic Resources EUR Sales (m) EBITDA (m) EBITDA margin EBIT (m) EBIT margin Net profit (reported) (m) Net profit (adj.) (m) Cash Flow from Ops.bef. chg in NWC (m) Net debt (Cash) (m) Net Debt/Equity Net Debt/EBITDA Interest cover (EBITDA/Fin. interest) ROCE (adj.) ROCE (adj.)/WACC EV / CE EV / Sales EV / EBITDA EV / EBIT P/E (adj.) P/BV OpFCF yield Dividend yield EPS (adj.) EPS (adj.) growth BVPS DPS Abs. Performances(12m,6m,3m,1m): 12 month High/low: EUR30.45 / 15.61 12/12 408 51.7 12.7% 29.7 7.3% 15.0 16.0 49.7 113 0.5 2.2 5.9 6.4% 0.8 0.8 0.7 5.7 10.0 10.9 0.8 21.1% 2.9% 1.45 -15.9% 20.12 0.45 70.2% 12/13 12/14e 12/15e 404 635 641 59.9 75.5 75.0 14.8% 11.9% 11.7% 37.3 39.3 38.5 9.2% 6.2% 6.0% 21.9 19.6 20.2 10.3 21.0 25.8 99.8 56.0 57.0 162 155 138 0.5 0.5 0.4 2.7 2.0 1.8 6.5 6.8 8.1 5.4% 3.7% 5.6% 0.7 0.5 0.7 1.0 1.2 1.2 1.3 1.0 0.9 8.8 8.0 7.8 14.2 15.4 15.3 34.6 21.0 17.1 1.2 1.4 1.3 6.8% 7.1% 6.1% 2.3% 2.3% 2.3% 0.67 1.35 1.67 -54.0% 103.1% 23.1% 20.04 20.65 21.30 0.65 0.65 0.65 24.0% -1.0% 1.4% Avg. Daily nb traded shares:14,386 Profile: SURTECO is engaged in the design, production and sale of plastic and paper based decorative surfaces. The company’s core products are edgebandings, flat foils, skirtings and decorative printings. SUR’s products are sold mainly to the furnishing and interior construction industry in Germany and the rest of Europe. SWOT Analysis Strengths • Global £d£1 in paper edgebandings with >50% mshare and £d£2 in plastic edgebandings with 22% mshare • Mmost profitable players within its industry. Management with long-standing experience in the industry • Only player active in both, the paper and plastic decorative surfaces market, giving SUR a unique selling position Weaknesses • Ccapital intense business model (tangible CE/sales of 60%), low growth and increasingly cost driven industry • Underrepresented in faster growing geographic markets e.g. Eastern Europe, Russia, Asia-Pacific or Latin America • Low organic growth and negative margin trend over the past 10 years Opportunities • Underpenetrated markets (America, Eastern Europe), become global TOP 5 , expansion into production relatedopportunities business fields •technology External growth / Up to EUR 24m p.a. synergery form the integration of the recent SÜDDEKOR •acquisition Margin upside from an overall economic recovery or industry consolidation Threats • The European economic crisis may escalate again and reduce demand for SURTECO’s products • Furniture imports to Europe may reduce SUR’s global market share • Maring pressure from the consolidation of the furnishing industry, new competitors in emerging markets, the of existing players across •vertical/horizontal Technology risk - integration digital printing may replace gravure printing in some market segments Recommendation: We rate SURTECO ‘Hold’ with a price target of EUR 29. Following the company’s strong share price performance (+80% since the announcement of the acquisition of Süddekor), we expect the share price to consolidate around current levels. Whereas the Süddekor acquisition, an improved free float and the SDAX listing should largely be discounted in the share price, further upside may come from 1/ a recovery of the European furniture market, 2/ more favourable industry dynamics following industry consolidation, and 3/ most importantly a successful integration of Süddekor. Main shareholders: Pool and Family Shareholders 54.7%; Free float 45.4%; All share prices at 19/05/14. FINANCIAL CALENDAR (Source: Precise) PRICE (SHORT & LONG AVERAGE) Target Price: EUR 29.00 titre 32 14/08/14 Results 30 2014H1 28 26 SURTECO SMALL & MID CAPS SELECTION Analyst(s) 24 22 20 18 Konrad Lieder 16 14 Mrz 11 Jun 11 Sep 11 Dez 11 Mrz 12 Jun 12 Sep 12 Dez 12 Mrz 13 Jun 13 Sep 13 Dez 13 Mrz 14 +49 69 5899 7436 Equinet Bank [email protected] Jun 14 Source : Factset 181 Finland SMALL & MID CAPS SELECTION EUR 4.42 Accumulate TECHNOPOLIS TPS1V.HE/TPS1V FH Market capitalisation: EUR 470m Real Estate EUR 12/12 93 55 51.6% (6) (14) 25 30 30.21 608 1,014 865 0.43 0.20 5.16 (34.0%) 5.60 12.5% 5.9% 15.6 8 4.1 608 56.2% 7.9% 12/13 12/14e 12/15e Profile: Technopolis offers business premises and services to companies in business parks in Finland, 112 149 152 Norway, Baltics and Russia. 68% of the property portfolio is located in Finland, 15% in Norway, 12% in EBITDA (m) 64 88 91 Baltics and 5% in Russia. The business idea is to combine premises and services into an offering that EBITDA margin 50.4% 53.6% 54.3% supports growth and success of customers. The company’s roots lie in the technology sector as well as Portfolio Result (m) (18) 1 0 Nokia in Oulu, the biggest city in Northern Finland. Nowadays ITC represents 21 % of revenues. Net Financial Result (21) (21) (22) The company aims at annual growth of 15% in sales and EBITDA to lever its sound business concept. The Net Profit (reported)(m) 19 56 57 track is convincing, 17% CAGR achieved in the last 10 years. Net Profit (adj.)(m) 36 49 51 Funds From Operations 36.33 49.30 51.27 Net Debt (m) 862 843 823 SWOT Analysis Portfolio Value (m) 1,437 1,443 1,458 Strengths Weaknesses Enterprise Value (m) 1,325 1,313 1,294 • A business model that combines space with services • Growth can be too fast EPS (adj.) 0.40 0.46 0.48 DPS provides for a longer value chain and competive advantage 0.10 0.14 0.15 IFRS NAVPS 5.87 6.22 6.55 • Effective leasing operations • Market uncertainties may negatively affect the property Premium/(discount) (25.9%) (29.0%) (32.6%) market’s yield requirements EPRA NAVPS 4.93 5.21 5.54 • Solid platform for leveraging the business model in • Abruptly rising interest rates may increase financing costs Earnings adj. yield 9.0% 10.5% 10.9% acquisitions as a result of low hedges Dividend yield 2.3% 3.2% 3.4% EV/EBITDA 20.8 14.9 14.2 P/E (adj.) 11 10 9 Opportunities Threats Int. cover(EBITDA/Fin.int) 3.0 4.2 4.2 • Economic uncertainty and lack of funding gives plenty of • Still dependent on the city of Oulu, IT and software Net debt/(cash) (m) 862 843 823 opportunities in the acquisition market industries, and small businesses Net Debt/Total Assets 55.3% 53.0% 51.2% • Premises mostly in non-prime locations Abs. Performances(12m,6m,3m,1m): 6.5% -3.3% 5.2% 12 month High/low: EUR4.88 / 3.71 Avg. Daily nb traded shares:47,769 • Ambitious growth target requires equity injections from Main shareholders: Free float 100.0%; Keskinäinen työeläkevakuutusyhtiö Varma 24.1%; Keskinäinen eläkevakuutusyhtiö Ilmarinen 10.5%; time to time Gross Rental Income (m) Oulun kaupunki 4.8%; • Rental contracts are short All share prices at 19/05/14. FINANCIAL CALENDAR (Source: Precise) PRICE (SHORT & LONG AVERAGE) titre 5.0 Recommendation: We see Technopolis as a company with a sustainable competitive advantage and promising growth opportunities, which translates into a ROE of around one percentage point higher than in its Nordic peer group. Despite the weak Finnish economy, we believe that Technopolis can still outperform the market. The company can still add value by developing existing campuses or acquiring new campuses and by taking advantage of the scalable concept. 4.5 Target Price: EUR 5.00 4.0 3.5 3.0 2.5 Mar 11 Source : Factset 182 Jun 11 Sep 11 Dec 11 Mar 12 Jun 12 Sep 12 Dec 12 Mar 13 Jun 13 Sep 13 Dec 13 Mar 14 Jun 14 TECHNOPOLIS SMALL & MID CAPS SELECTION Analyst(s) Matias Rautionmaa +358 10 252 4408 Pohjola [email protected] Netherlands SMALL & MID CAPS SELECTION EUR 7.25 Buy TELEGRAAF MEDIA GROEP TLGNc.AS/TMG NA Market capitalisation: EUR 336m Media EUR Sales (m) EBITDA (m) EBITDA margin EBIT (m) EBIT margin Net profit (reported) (m) Net profit (adj.) (m) Cash Flow from Ops.bef. chg in NWC (m) Net debt (Cash) (m) Net Debt/Equity Net Debt/EBITDA Interest cover (EBITDA/Fin. interest) ROCE (adj.) ROCE (adj.)/WACC EV / CE EV / Sales EV / EBITDA EV / EBIT P/E (adj.) P/BV OpFCF yield Dividend yield EPS (adj.) EPS (adj.) growth BVPS DPS Abs. Performances(12m,6m,3m,1m): 12 month High/low: EUR14.58 / 6.77 12/12 577 34.3 5.9% -42.1 nm -16.3 31.8 6.8 70.2 0.2 2.0 9.0 -4.2% -0.5 0.3 0.3 4.7 nm 11.7 0.9 -1.4% 0.0% 0.69 -4.7% 9.20 0.00 -26.6% 12/13 542 21.1 3.9% -10.3 nm 178 19.2 5.2 -26.8 -0.1 -1.3 4.8 7.0% 0.8 0.9 0.7 18.7 nm 22.0 1.4 -9.0% 89.7% 0.41 -39.6% 6.45 6.50 -22.1% 12/14e 12/15e 527 518 68.0 71.0 12.9% 13.7% 36.6 39.6 6.9% 7.6% 29.5 31.5 29.0 30.9 35.4 44.8 -37.5 -35.2 -0.1 -0.1 -0.6 -0.5 nm nm 7.0% 7.9% 0.8 1.0 0.7 0.8 0.6 0.6 4.4 4.2 8.2 7.6 11.6 10.9 1.0 1.0 5.3% 8.3% 6.9% 6.9% 0.63 0.67 50.8% 6.8% 7.07 7.24 0.50 0.50 0.3% -1.4% Avg. Daily nb traded shares:3,926 Main shareholders: Free float 32.3%; Family Puijenbroek 30.5%; Cyrte 20.1%; Profile: Telegraaf Media Group (TMG) is a Dutch media group with its principal activities being national, regional and door-to-door newspapers (together contributing more than 65% of sales). Other activities are the publication of puzzle magazines, radio via its stake in Sky Radio Group and several digital media platforms. Almost all revenues are derived from the Netherlands, with some international exposure with its puzzle activities. In 2013, 52% of revenues came from circulation, 37% from advertising, 3% from printing and distribution and 8% from other income. SWOT Analysis Strengths • Owner of the largest newspaper in the Netherlands Weaknesses • Large exposure to the Dutch media market • Sky Radio is top 3 radio station • Weak acquisition track record • Puzzles are highly profitable • Strategic uncertainty Opportunities • Further cost reductions Threats • Structural decline in newspaper sales • Acquisitions to further diversify from newspaper publishing • Optimize position of strong brands • Pressure on advertising income • Risk of overpaying for acquisitions Recommendation: Both advertising and subscription income are still in decline. Increased promotions have put pressure on margins in the first quarter of 2014 whilst the benefits are not expected before the second half of the year. Cost savings are second half weighted and in the first quarter only partly compensated for the lower revenues and higher selling expenses. We expect results to improve throughout the year. We have a Buy rating with the company valued at a 2014E EV/EBITDA of only 4.5. Delta Lloyd 7.1%; Navitas 5.0%; Boekhoorn 5.0%; All share prices at 19/05/14. Target Price: EUR 11.00 FINANCIAL CALENDAR (Source: Precise) PRICE (SHORT & LONG AVERAGE) t i t re 15 01/08/14 Results 14 13 12 11 10 2014H1 TELEGRAAF MEDIA GROEP SMALL & MID CAPS SELECTION Analyst(s) Johan van den Hooven 9 8 +312 0 5508518 SNS Securities [email protected] 7 6 Mar 11 Jun 11 Sep 11 Dec 11 Mar 12 Jun 12 Sep 12 Dec 12 Mar 13 Jun 13 Sep 13 Dec 13 Mar 14 Jun 14 Source : Factset 183 Netherlands SMALL & MID CAPS SELECTION EUR 20.66 Buy TEN CATE NTCN.AS/KTC NA Market capitalisation: EUR 564m Industrial Engineering EUR Sales (m) EBITDA (m) EBITDA margin EBIT (m) EBIT margin Net profit (reported) (m) Net profit (adj.) (m) Cash Flow from Ops.bef. chg in NWC (m) Net debt (Cash) (m) Net Debt/Equity Net Debt/EBITDA Interest cover (EBITDA/Fin. interest) ROCE (adj.) ROCE (adj.)/WACC EV / CE EV / Sales EV / EBITDA EV / EBIT P/E (adj.) P/BV OpFCF yield Dividend yield EPS (adj.) EPS (adj.) growth BVPS DPS Abs. Performances(12m,6m,3m,1m): 12 month High/low: EUR24.61 / 17.82 12/12 1,049 89.1 8.5% 37.5 3.6% 19.6 36.8 61.4 230 0.5 2.6 7.4 4.0% 0.5 1.2 0.8 9.1 21.7 14.0 1.2 15.8% 2.5% 1.42 -49.5% 17.27 0.50 8.8% 12/13 12/14e 12/15e 1,012 1,048 1,113 89.4 101 119 8.8% 9.6% 10.7% 41.5 52.5 70.0 4.1% 5.0% 6.3% 18.9 31.0 45.4 36.7 44.1 58.5 66.1 83.3 95.5 189 165 157 0.4 0.3 0.3 2.1 1.6 1.3 8.9 11.1 14.7 4.7% 6.0% 7.7% 0.5 0.7 1.3 1.2 1.1 0.8 0.7 0.7 9.4 7.6 6.5 20.3 14.6 11.0 16.6 12.7 9.7 1.3 1.1 1.1 10.8% 6.5% 3.5% 2.4% 2.6% 3.4% 1.38 1.63 2.12 -3.1% 18.4% 30.2% 17.70 18.00 18.62 0.50 0.54 0.70 -12.6% -15.8% -8.8% Avg. Daily nb traded shares:100,790 Profile: From its high-technology core in combining textiles and chemistry, Ten Cate is exploiting niches in various materials markets. Key to Ten Cate‘s approach is the development of products in close cooperation with the end user such as the US Army, Boeing, Airbus and FIFA. In its advanced textiles and composites division, the company does not own most of the manufacturing chain, focusing on added value in processes, development and marketing as suppliers, assemblers and end users tend to be highly sophisticated. The geosynthetics and artificial grass division is much more vertically integrated, reflecting the need to protect the technological advantages in the application process and to capture the related added value. In all businesses, managing the value chain is crucial to the success. SWOT Analysis Strengths • IP base in technology and processes, not products • Leading market shares in narrowly defined niches Weaknesses • Vulnerability of working capital requirements to lumpy business • Concentrated customer roster per division • Intimate relationships with end users£pv£ high switching costs • Brand value depends on partners‘ performance (note the difficulties in artificial grass) Opportunities • Extending the product portfolio through new applications of existing technology • Widening the client roster geographically Threats • Raw material price volatility • Substitute products and technologies • Government budgets shrinking and subsidies waning Main shareholders: Free float 71.0%; Delta Lloyd 15.8%; Allianz 5.1%; Ameriprise 4.7%; Norges Bank 3.4%; All share prices at 19/05/14. FINANCIAL CALENDAR (Source: Precise) PRICE (SHORT & LONG AVERAGE) Recommendation: On 8x EV/EBITDA 2014E, the market is not paying enough for the medium-term structural growth in the various Ten Cate niches. The grass activities, with their short term raw material vulnerability and recent strategic hurdles, appear to be weighing on the stock‘s multiples despite being only 20% of group revenues. We have set a EUR 27 target price based on discounted cash flow. Target Price: EUR 27.00 titre 32 30 28 TEN CATE SMALL & MID CAPS SELECTION Analyst(s) 26 24 22 20 Gert Steens 18 16 Mar 11 Source : Factset 184 Jun 11 Sep 11 Dec 11 Mar 12 Jun 12 Sep 12 Dec 12 Mar 13 Jun 13 Sep 13 Dec 13 Mar 14 Jun 14 +312 0 5508639 SNS Securities [email protected] Belgium SMALL & MID CAPS SELECTION EUR 22.15 Hold TESSENDERLO TESB.BR/TESB BB Market capitalisation: EUR 703m Chemicals EUR Sales (m) EBITDA (m) EBITDA margin EBIT (m) EBIT margin Net profit (reported) (m) Net profit (adj.) (m) Cash Flow from Ops.bef. chg in NWC (m) Net debt (Cash) (m) Net Debt/Equity Net Debt/EBITDA Interest cover (EBITDA/Fin. interest) ROCE (adj.) ROCE (adj.)/WACC EV / CE EV / Sales EV / EBITDA EV / EBIT P/E (adj.) P/BV OpFCF yield Dividend yield EPS (adj.) EPS (adj.) growth BVPS DPS Abs. Performances(12m,6m,3m,1m): 12 month High/low: EUR23.75 / 16.68 12/12 2,130 38.9 1.8% -163 nm -199 40.0 38.1 314 0.9 8.1 2.0 5.9% 0.7 1.4 0.5 30.1 nm 19.0 2.3 -12.8% 5.4% 1.31 -35.5% 10.95 1.33 3.5% 12/13 12/14e 12/15e 1,790 1,460 1,506 52.1 83.4 137 2.9% 5.7% 9.1% -18.7 19.5 72.9 nm 1.3% 4.8% -64.0 1.1 39.1 16.7 20.1 43.5 34.6 65.1 103 259 250 247 1.1 1.0 0.9 5.0 3.0 1.8 3.4 5.0 8.5 4.1% 4.2% 7.0% 0.5 0.5 0.9 1.4 1.5 1.4 0.5 0.7 0.7 18.3 12.5 7.6 nm 53.6 14.3 36.2 35.0 16.2 2.5 3.0 2.5 2.1% -2.3% 0.5% 0.0% 0.0% 0.0% 0.53 0.63 1.37 -59.8% 20.5% 116.4% 7.46 7.49 8.73 0.00 0.00 0.00 31.0% 9.1% 6.7% Avg. Daily nb traded shares:26,367 Main shareholders: Free float 70.8%; Verbrugge NV (Group Picanol) 27.5%; Employees 1.7%; All share prices at 19/05/14. Profile: Originally active in basic chemicals, Tessenderlo Chemie (TC) is embarked since 2007 in an indepth revamping process of its activities, with the aim of transforming itself into an international speciality group providing solutions for global needs in food, agriculture, water management and efficient (re)use of natural resources. To achieve these goals, the group focuses its efforts on the disposal of non-core assets while the resources available for development are allocated in priority to two business areas: 1. In gelatine, with the aim of maintaining its position among the leaders by reinforcing its international presence (mainly in Latin America and in Asia); 2. In businesses combining service and valorisation of by-products, which are activities close to customers, drawing on TC’s strong experience in this area (Kerley Akiolis). SWOT Analysis Strengths • Good track record, market positioning and profitability of core activities, before the price war in the French rendering started in 1Q13 style: more business oriented than •that New management previous management • Management strongly focuses on costs optimisation at all levels (activities and overheads) Weaknesses • Very strong US dollar exposure post disposal of non-core assets • Very weak visibility of the market on the mains activities of the group (Akiolis, Gelatines and Kerley) • Size of the market capitalisation and low liquidity of the share Opportunities • Kerley: expansion of the mining and industrial pillar, a model to be expanded into Europe, Middle East & LatAm • Akiolis: acquisition opportunities in South and Eastern Europe. • Re-rating of the share post disposal of remining non-core assets and post profitability Threats • Possible new European fine in the pipes and fittings activities • Regulatory risks in crop protection businesses in the USA • Price war in the French rendering market since early 2013 Recommendation: 1Q14 results came in ahead of expectations with Rebitda at EUR 39.7m, up 34% Y-oY and largely above our and consensus estimates. Rebitda was supported by stronger results at Kerley and in pipes and cost improvement initiatives. The current strategy to focus on costs control is likely to mitigate the poor market environment in Gelatine & Akiolis and in Inorganics (here due to a technical issue). This combined with a better environment for Kerley and in the pipes activities, led us to review upwards our FY14 Rebitda to about EUR 108m. FINANCIAL CALENDAR) PRICE (SHORT & LONG AVERAGE) Although short term multiples are demanding, we maintain our HOLD rating with a TP at EUR 21.5. titre 34 Target Price: EUR 21.50 32 03/06/2014: AGM 30 28 26 27/08/2014: 1H14 results 24 22 20 29/10/2014: 3Q14 trading update 18 16 Mar 11 Jun 11 Sep 11 Dec 11 Mar 12 Jun 12 Sep 12 Dec 12 Mar 13 Jun 13 Sep 13 Dec 13 Mar 14 Jun 14 TESSENDERLO SMALL & MID CAPS SELECTION Analyst(s) Bernard Hanssens +32 (0) 2 287 9689 Bank Degroof [email protected] Source : Factset 185 France SMALL & MID CAPS SELECTION EUR 12.37 Hold TF1 TFFP.PA/TFI FP Market capitalisation: EUR 2613m Media EUR Sales (m) EBITDA (m) EBITDA margin EBIT (m) EBIT margin Net profit (reported) (m) Net profit (adj.) (m) Cash Flow from Ops.bef. chg in NWC (m) Net debt (Cash) (m) Net Debt/Equity Net Debt/EBITDA Interest cover (EBITDA/Fin. interest) ROCE (adj.) ROCE (adj.)/WACC EV / CE EV / Sales EV / EBITDA EV / EBIT P/E (adj.) P/BV OpFCF yield Dividend yield EPS (adj.) EPS (adj.) growth BVPS DPS Abs. Performances(12m,6m,3m,1m): 12 month High/low: EUR14.80 / 8.16 12/12 2,621 295 11.2% 210 8.0% 136 136 176 -238 -0.1 -0.8 high -5.8% -0.5 1.0 0.6 5.0 7.0 13.7 1.1 11.4% 6.2% 0.65 -25.0% 8.00 0.55 51.8% 12/13 12/14e 12/15e 2,085 2,090 2,114 241 289 265 11.6% 13.8% 12.5% 147 206 185 7.0% 9.9% 8.8% 137 198 142 137 198 142 131 71.1 136 -185 -363 -330 -0.1 -0.2 -0.2 -0.8 -1.3 -1.2 nm nm nm -4.9% -5.6% -4.8% -0.4 -0.5 -0.4 2.7 1.6 1.5 1.3 0.9 0.9 11.2 6.7 7.5 18.5 9.4 10.7 21.5 13.2 18.4 1.7 1.5 1.4 0.3% 0.7% 3.2% 4.4% 4.4% 4.4% 0.65 0.94 0.67 0.8% 44.0% -28.1% 8.10 8.49 8.61 0.55 0.55 0.55 -7.2% -11.8% -2.5% Avg. Daily nb traded shares:279,666 Main shareholders: Free float 49.5%; Bouygues 43.5%; Employees 7.0%; All share prices at 19/05/14. FINANCIAL CALENDAR (Source: Precise) PRICE (SHORT & LONG AVERAGE) Profile: TF1 is France’s leading free-to-air TV network, with a 32.6% audience share among women under 50 in 2013 (including channels TMC, NT1 and HD1); the M6 group ranks number two with a 21.0% share. TF1's share of TV advertising market was 46%. Advertising on TF1’s core channel will generate 63% of 2014 est. group revenues. In diversified businesses, TF1 is present in free DTT with TMC, NT1 and HD1, which was launched at end-2012; TF1 now owns 49% of Eurosport (broadcast in Europe and Asia), after it sold 51% to Discovery in two steps. The group is also present in publishing and distribution, production, broadcasting rights, e-commerce and the Internet. SWOT Analysis Strengths • Still the favourite French channel, 52% watch TF1 channel daily • Leader in audience share on all targets • TV ad market share close to 50%, cross media strategy • Secured content in sport, film and fiction Opportunities • Integration of TMC and NT1 Threats • New ways of content consumption • Ongoing cost cutting programme • Canal+ ambitions on free-to-air TV • Disposal of Eurosport at a good price • Price pressure from M6 • Stabilising audience Recommendation: The French TV advertising market outlook remains bleak, in an uncertain macroeconomic environment, and with new DTT channels putting pressure on prices. However, the Q1 figures showed a stabilisation of TF1 ad revenues, on a favourable basis, and thanks to stabilised audiences. We believe that TF1 advertising will outperform M6 in 2014, thanks to better audiences and the football World Cup. We prefer TF1 to M6 also because it offers more cost-cutting prospects, especially in 2015 with the full integration of TMC and NT1 (integration of media selling and programming). The group will probably distribute a part of its EUR1bn war chest in 2015, after the full disposal of Eurosport. We have a SOP at EUR13.50. Target Price: EUR 13.50 titre 15.0 25/07/14 Results 14.0 Weaknesses • Full exposure to the mature French advertising market 2014H1 13.0 12.0 TF1 SMALL & MID CAPS SELECTION Analyst(s) 11.0 10.0 9.0 8.0 7.0 6.0 5.0 Mar 11 Source : Factset 186 Jun 11 Sep 11 Dec 11 Mar 12 Jun 12 Sep 12 Dec 12 Mar 13 Jun 13 Sep 13 Dec 13 Mar 14 Jun 14 Eric Ravary Emmanuel Chevalier +33 1 45 96 79 53 +33 1 45 96 77 42 CM - CIC Securities [email protected] [email protected] Italy SMALL & MID CAPS SELECTION EUR 1.37 Reduce TI MEDIA TCM.MI/TME IM Market capitalisation: EUR 153m Media EUR Sales (m) EBITDA (m) EBITDA margin EBIT (m) EBIT margin Net profit (reported) (m) Net profit (adj.) (m) Cash Flow from Ops.bef. chg in NWC (m) Net debt (Cash) (m) Net Debt/Equity Net Debt/EBITDA Interest cover (EBITDA/Fin. interest) ROCE (adj.) ROCE (adj.)/WACC EV / CE EV / Sales EV / EBITDA EV / EBIT P/E (adj.) P/BV OpFCF yield Dividend yield EPS (adj.) EPS (adj.) growth BVPS DPS Abs. Performances(12m,6m,3m,1m): 12 month High/low: EUR2.32 / 1.02 12/12 222 -44.4 nm -263 nm -241 -79.1 -30.1 260 nm -5.9 nm -86.0% -10.1 2.9 2.4 nm nm nm nm -51.1% 0.0% -0.76 -chg -0.35 0.00 -4.4% 12/13 12/14e 12/15e 75.7 69.0 71.1 30.2 29.3 32.6 39.9% 42.4% 45.9% -132 1.7 5.9 nm 2.5% 8.3% -132 -3.3 1.3 3.6 -1.7 1.5 24.3 24.3 28.0 260 230 227 -4.3 -3.6 -3.6 8.6 7.9 6.9 5.2 5.9 10.9 -40.4% 0.7% 2.2% -5.1 0.1 0.3 2.4 2.5 2.5 6.2 5.9 5.7 15.5 13.9 12.4 nm nm 68.4 nm nm nm nm nm nm -26.6% 20.6% 1.9% 0.0% 0.0% 0.0% 0.03 -0.02 0.01 +chg -chg +chg -0.57 -0.57 -0.56 0.00 0.00 0.00 -26.6% -26.4% -24.6% Avg. Daily nb traded shares:53,969 Main shareholders: Telecom Italia 77.7%; Free float 22.3%; Profile: TI Media is the television arm of Telecom Italia Group; the company was created with the spin-off of the directories business into SEAT in 2004, it subsequently disposed Office Products and Internet business lines. After the long-awaited disposal of La7 channel, TME operates MTV Italy, a Free-to-Air music channel jointly owned with Viacom (partner with 49%). The ownership of three DTT multiplexes has allowed TME to focus on the infrastructure side of the TV business, by renting bandwidth to other publishers in both FtA and Pay-TV. TME originally intended to sell the Network Operator unit (TIMB) for EUR 0.4bn in order to offset its EUR 0.35bn debt; the failure to finalize a deal led to a EUR 240m capital increase successfully concluded in June 10, also thanks to the support of the parent co. Given the perpetual losses of La7, TME has struggled to generate a positive EBITDA until the first half of 2010. On March 4, 2013, TI Media finalized the sale of La7 to Cairo Communication. The deal conditions were: a) disposal at token value against a positive NFP of EUR 88m at the time of the finalization; b) lock up-clause for 2 years; c) favourable conditions for Mux rent. TI waived EUR 100m intra-group debt. The “gift” was basically equal to the cash paid to Cairo, plus interim losses. In Sept 2013, TME also completed the disposal of its 51% stake in MTV to its JV partner Viacom for EUR 13m. FY 2013: Sport needed to support the EBITDA. Q4 was weaker than expected, due to a 5% decline in TIMB revenues, which the company attributes to the discontinuation of the legacy services for La7 and MTV. The EBITDA disappointed, as the lower revenue base combined with new provisions for risks and bad debt. We understand these are related with the former SportItalia channels, which have closed at the end of last year. On the other hand, we note the reduction in holding costs, with personnel expenses down by EUR 4.5m Y/Y. In any case, the EBITDA sequence for TIMB is rather poor with EUR 12/8/6m in the past three quarters respectively. The net loss for the year was EUR 132m, affected by the capital loss on La7 disposal. On the positive, deleveraging was better than expected in Q4 with EUR 13m; the NFP was stable vs. last year as the disposal costs of La7 were completely covered by the parent company TI. Corporate action. TME and L’Espresso finally agreed the combination of their respective Muxes in a newCO in which the partners will control 70% and 30% respectively. TME will have an option to acquire the right of use of one of the five frequencies that will be controlled by the vehicle. The MuxCo will generate around EUR 100m annual revenues, with an EBITDA that we estimate in the region of EUR 35m. The companies said the deal will generate relevant industrial synergies, which have not however been disclosed. TIMedia will be entitled to appoint the majority of Directors including the CEO, whilst Gruppo Espresso will appoint the company’s Chairman. SWOT Analysis All share prices at 19/05/14. FINANCIAL CALENDAR (Source: Precise) PRICE (SHORT & LONG AVERAGE) titre 3.5 Strengths • Ownership of scarce resource in TV broadcasting Weaknesses • Fragile balance sheet • Financial backing of Telecom Italia • Better defined business model a Mux operator • Unclear strategy of parent company Opportunities • Growing needs of Bandwidth in DTT • Attribution of new muxes Threats • Competition from satellite • Other alternative video delivery media 3.0 Recommendation: The 14:1 reverse share split led to the adjustment of our Target Price to EUR 1.68. We further trim our valuation by c 20%, to EUR 1.35, to take into account the lower quality of current tenants resulting into a lower yield and higher risk attached to the mux portfolio. 2.5 2.0 1.5 Target Price: EUR 1.35 1.0 Mar 11 Source : Factset Jun 11 Sep 11 Dec 11 Mar 12 Jun 12 Sep 12 Dec 12 Mar 13 Jun 13 Sep 13 Dec 13 Mar 14 Jun 14 Analyst(s) Andrea Devita, CFA Banca Akros +39 02 4344 4031 [email protected] 187 Finland SMALL & MID CAPS SELECTION EUR 19.63 Sell TIETO TIE1V.HE/TIE1V FH Market capitalisation: EUR 1407m Software & Computer Services EUR Sales (m) EBITDA (m) EBITDA margin EBIT (m) EBIT margin Net profit (reported) (m) Net profit (adj.) (m) Cash Flow from Ops.bef. chg in NWC (m) Net debt (Cash) (m) Net Debt/Equity Net Debt/EBITDA Interest cover (EBITDA/Fin. interest) ROCE (adj.) ROCE (adj.)/WACC EV / CE EV / Sales EV / EBITDA EV / EBIT P/E (adj.) P/BV OpFCF yield Dividend yield EPS (adj.) EPS (adj.) growth BVPS DPS Abs. Performances(12m,6m,3m,1m): 12 month High/low: EUR20.17 / 14.35 12/12 1,825 180 9.9% 63.0 3.5% 31.1 94.3 148 72.7 0.1 0.4 35.3 80.5% 11.8 1.8 0.6 5.9 16.9 11.3 1.9 10.2% 5.6% 1.31 29.9% 7.73 0.83 17.8% 12/13 12/14e 12/15e 1,609 1,638 1,694 170 212 248 10.6% 13.0% 14.6% 85.8 123 159 5.3% 7.5% 9.4% 62.3 85.4 112 105 104 112 146 173 199 80.3 -4.6 -54.2 0.2 0.0 -0.1 0.5 0.0 -0.2 23.0 29.5 34.4 79.0% 98.5% 90.1% 11.6 14.5 13.2 2.1 2.6 2.5 0.8 0.8 0.8 7.2 6.4 5.2 14.2 10.9 8.1 11.4 13.5 12.6 2.3 2.7 2.5 3.4% 10.3% 9.4% 4.6% 5.2% 5.6% 1.45 1.45 1.56 10.1% 0.3% 7.5% 7.06 7.34 7.87 0.90 1.02 1.09 20.8% 7.9% 6.1% Avg. Daily nb traded shares:76,141 Profile: Tieto is the largest Nordic IT services company providing full life-cycle services for both private and public sectors. The company has a global presence through its product development business and delivery centres. Founded in 1968 and headquartered in Helsinki, Finland, Tieto operates in over 20 countries. The current core market is the Nordics, and the company is building on its strong position in Finland (45% of sales) and Sweden (35% of sales). In product development services, Tieto serves its customers worldwide, but its core markets are the Nordic countries. Public, Healthcare and Welfare is the biggest customer sector with a 25% share. At the end of Q1 2014, Tieto had 14,102 employees, with 31% of them based in Finland and 19% in Sweden. The offshoring rate is over 45%. Tieto’s biggest competitors in the Nordic markets include CGI, IBM, HP and Evry. SWOT Analysis Strengths • Strong market position in Finland Weaknesses • Large government holding • Long-term relationships with major Finnish corporations, especially in finance and the public sector • Mature markets of Finland and Sweden, which account for the bulk of Tieto's sales Opportunities • New business areas (in consulting and system integration) Threats • Cost pressures especially in Finland and Sweden • More focused organisations increase competiveness • Global competition and cloud services • Cloud services Main shareholders: Free float 100.0%; Cevian Capital 15.3%; Solidium Oy 10.2%; Keskinäinen Eläkevakuutusyhtiö Etera 4.1%; Recommendation: Tieto estimates that 2014 operating profit excluding one-off items will increase from the level of 2013 (EUR 141.2m). IT services market growth is still estimated at approximately 2%. Tieto’s growth estimate is in line with its Nordic peers’ market estimates. On our forecasts, Tieto’s valuation multiples have already reached the level of its large international peers, and we see no grounds for this. All share prices at 19/05/14. Target Price: EUR 16.00 FINANCIAL CALENDAR (Source: Precise) PRICE (SHORT & LONG AVERAGE) titre 20 18/07/14 Results 18 27/05/14 Capital Markets Day 16 12 10 8 Mar 11 188 TIETO SMALL & MID CAPS SELECTION Analyst(s) Hannu Rauhala 14 Source : Factset 2014Q2 Jun 11 Sep 11 Dec 11 Mar 12 Jun 12 Sep 12 Dec 12 Mar 13 Jun 13 Sep 13 Dec 13 Mar 14 Jun 14 +358 10 252 4392 Pohjola [email protected] Finland SMALL & MID CAPS SELECTION EUR 18.92 Hold TIKKURILA TIK1V.HE/TIK1V FH Market capitalisation: EUR 835m Chemicals EUR Sales (m) EBITDA (m) EBITDA margin EBIT (m) EBIT margin Net profit (reported) (m) Net profit (adj.) (m) Cash Flow from Ops.bef. chg in NWC (m) Net debt (Cash) (m) Net Debt/Equity Net Debt/EBITDA Interest cover (EBITDA/Fin. interest) ROCE (adj.) ROCE (adj.)/WACC EV / CE EV / Sales EV / EBITDA EV / EBIT P/E (adj.) P/BV OpFCF yield Dividend yield EPS (adj.) EPS (adj.) growth BVPS DPS Abs. Performances(12m,6m,3m,1m): 12 month High/low: EUR20.89 / 16.49 12/12 672 91.6 13.6% 66.5 9.9% 40.5 45.6 65.6 99.6 0.5 1.1 12.6 19.2% 2.9 2.5 1.1 7.9 10.9 14.2 3.2 7.1% 5.2% 1.03 24.9% 4.67 0.76 12.0% 12/13 653 93.8 14.4% 71.5 10.9% 50.0 50.9 72.3 49.6 0.2 0.5 20.9 20.6% 3.1 3.3 1.4 9.7 12.7 17.3 4.2 7.8% 4.2% 1.15 11.5% 4.72 0.80 -7.6% 12/14e 12/15e 653 672 96.6 99.1 14.8% 14.7% 75.6 78.1 11.6% 11.6% 53.1 56.8 52.5 56.8 74.1 77.8 27.9 16.1 0.1 0.1 0.3 0.2 21.2 31.0 21.8% 22.1% 3.3 3.3 3.2 3.1 1.3 1.2 8.7 8.4 11.1 10.6 15.9 14.7 3.7 3.4 6.8% 5.9% 4.4% 4.7% 1.19 1.29 3.2% 8.1% 5.12 5.57 0.84 0.88 -4.7% 8.9% Avg. Daily nb traded shares:5,933 Main shareholders: Free float 82.0%; Oras Invest Oy 18.1%; Ilmarinen Mutual Pension Insurance Co 10.5%; Varma Mutual Pension Insurance Co 8.6%; All share prices at 19/05/14. Profile: Tikkurila is a provider of paints to consumers and industrial users. The company makes more than half of its sales in Eastern Europe and the rest in Finland and Scandinavia. It is the market leader in Finland (over 50% of the market), Sweden (40%) and Russia (18%), one of the leading companies in the Baltic countries and the fourth biggest in Poland (12%). Decorative paints account for some 80% of its sales and industrial coatings for 20%. SWOT Analysis Strengths • Solid market shares: no 1 in Russia, Finland and Sweden Weaknesses • Raw material volatility • Large proportion of business in emerging markets • No growth in mature markets of Finland and Scandinavia • Outstanding pricing power • Growth in Russia has clearly decelerated Opportunities • Recovering growth of Russian paint markets Threats • Increasing competition • Establishment of a position in the CEE region • Increasing popularity of wallpapers • A potential acquisition target • Brand weakening Recommendation: Paint markets in Eastern Europe are facing clear softness due to weakening consumer confidence at the same time as paint manufacturing capacity is increasing in Russia. This together with rising expenses will put both margins are volumes under pressure for Tikkurila. Historically, Tikkurila's growth has based on continuously rising sales prices as the company's pricing power has been outstanding. However, increased competition has started to erode Tikkurila's market share and therefore we see that this growth model will hardly function in the coming years. Considering the weak growth outlook, we do not believe Tikkurila’s multiples (P/E, EV/EBITDA) should be above their historical median. Target Price: EUR 18.50 FINANCIAL CALENDAR (Source: Precise) PRICE (SHORT & LONG AVERAGE) titre 21 20 TIKKURILA SMALL & MID CAPS SELECTION Analyst(s) 19 18 17 16 Antti Saari 15 14 +358 10 252 4359 Pohjola [email protected] 13 12 Mar 11 Jun 11 Sep 11 Dec 11 Mar 12 Jun 12 Sep 12 Dec 12 Mar 13 Jun 13 Sep 13 Dec 13 Mar 14 Jun 14 Source : Factset 189 Netherlands SMALL & MID CAPS SELECTION EUR 24.95 Hold TKH GROUP TWKNc.AS/TWEKA NA Market capitalisation: EUR 961m General Industrials EUR Sales (m) EBITDA (m) EBITDA margin EBIT (m) EBIT margin Net profit (reported) (m) Net profit (adj.) (m) Cash Flow from Ops.bef. chg in NWC (m) Net debt (Cash) (m) Net Debt/Equity Net Debt/EBITDA Interest cover (EBITDA/Fin. interest) ROCE (adj.) ROCE (adj.)/WACC EV / CE EV / Sales EV / EBITDA EV / EBIT P/E (adj.) P/BV OpFCF yield Dividend yield EPS (adj.) EPS (adj.) growth BVPS DPS Abs. Performances(12m,6m,3m,1m): 12 month High/low: EUR27.18 / 18.99 12/12 1,102 106 9.6% 65.3 5.9% 41.3 62.2 83.8 196 0.5 1.9 8.7 7.7% 0.9 1.4 0.9 9.3 15.0 11.8 2.0 6.5% 3.3% 1.65 -7.8% 9.75 0.65 20.7% 12/13 12/14e 12/15e 1,198 1,310 1,388 119 140 152 10.0% 10.7% 11.0% 74.7 94.4 106 6.2% 7.2% 7.6% 43.0 55.6 63.2 68.1 80.7 88.3 96.1 117 122 194 142 82.9 0.4 0.3 0.2 1.6 1.0 0.5 7.8 11.5 16.6 8.4% 9.8% 10.6% 1.0 1.1 1.2 1.7 1.6 1.6 1.0 0.9 0.8 10.2 8.3 7.3 16.3 12.3 10.5 14.2 11.9 11.0 2.5 2.3 2.1 5.4% 7.4% 8.2% 3.0% 3.2% 3.3% 1.79 2.10 2.26 8.5% 17.0% 8.0% 9.97 10.92 12.00 0.75 0.80 0.82 -1.7% -1.4% -1.4% Avg. Daily nb traded shares:47,099 Profile: TKH Group specializes in the development and delivery of systems and networks for the IT, telecommunication, engineering and industrial production industry. TKH Group consists of three divisions: Telecom, Building and Industrial and is active mainly in Europe. Telecom is mainly aimed at the telecom operators, alternative carriers and their installers. Building services specific niches as well as distributors that service construction and other markets. Industrial services specific industries (such as automotive and robotic) while the division also manufactures production systems for the tyre and metal packaging industry. SWOT Analysis Strengths • Strong positions in selected growth markets Weaknesses • § Continued partial exposure to commodity products • High margins on value added solutions • Limited scale in regional markets • Solutions approach gives higher client loyalty Opportunities • Growing need for security products Threats • Cyclical exposure in Building • Ageing population increases home care demand • Limited scale in regional markets • Continuing high demand for high speed data- and telecommunication products • Big 5 tyre producers opening up for external machine producers Main shareholders: Free float 65.0%; Delta Lloyd 10.1%; Fidelity 9.3%; Darlin 5.3%; BreedInvest 5.2%; ASR 5.1%; Recommendation: We appreciate TKH’s strategy to expand downstream into suppliers of integrated systems in specialist niches. The valuation of TKH, 8x EV/EBITDA, would be undemanding for the “new” business, but appears to deny the weight of the still existing volume-sensitive cable-making units. Hold. All share prices at 19/05/14. Target Price: EUR 22.00 FINANCIAL CALENDAR (Source: Precise) PRICE (SHORT & LONG AVERAGE) titre 32 30 28 26 Gert Steens 24 22 20 18 16 14 12 Mar 11 Source : Factset 190 TKH GROUP SMALL & MID CAPS SELECTION Analyst(s) Jun 11 Sep 11 Dec 11 Mar 12 Jun 12 Sep 12 Dec 12 Mar 13 Jun 13 Sep 13 Dec 13 Mar 14 Jun 14 +312 0 5508639 SNS Securities [email protected] Netherlands SMALL & MID CAPS SELECTION EUR 5.21 Hold TOMTOM TOM2.AS/TOM2 NA Market capitalisation: EUR 1158m Software & Computer Services EUR Sales (m) EBITDA (m) EBITDA margin EBIT (m) EBIT margin Net profit (reported) (m) Net profit (adj.) (m) Cash Flow from Ops.bef. chg in NWC (m) Net debt (Cash) (m) Net Debt/Equity Net Debt/EBITDA Interest cover (EBITDA/Fin. interest) ROCE (adj.) ROCE (adj.)/WACC EV / CE EV / Sales EV / EBITDA EV / EBIT P/E (adj.) P/BV OpFCF yield Dividend yield EPS (adj.) EPS (adj.) growth BVPS DPS Abs. Performances(12m,6m,3m,1m): 12 month High/low: EUR6.10 / 3.67 12/12 1,057 181 17.1% 70.2 6.6% 129 175 157 82.7 0.1 0.5 15.1 13.1% 1.3 0.8 0.9 5.3 13.7 4.8 1.0 13.6% 0.0% 0.79 44.4% 3.77 0.00 39.0% 12/13e 12/14e 12/15e 963 882 909 143 148 172 14.8% 16.8% 19.0% 25.5 35.4 64.5 2.7% 4.0% 7.1% 19.5 24.5 46.9 66.0 71.0 93.4 206 58.6 97.0 -84.3 -108 -154 -0.1 -0.1 -0.2 -0.6 -0.7 -0.9 48.5 74.0 high 2.1% 2.5% 4.7% 0.2 0.3 0.5 1.1 1.1 1.0 1.1 1.2 1.1 7.7 7.4 6.0 42.9 30.7 16.2 17.3 16.3 12.4 1.3 1.3 1.3 15.3% 2.0% 7.0% 0.0% 0.0% 3.1% 0.30 0.32 0.42 -62.4% 7.4% 31.3% 3.84 3.99 4.08 0.00 0.00 0.16 -6.8% 14.2% 13.2% Avg. Daily nb traded shares:689,702 Main shareholders: Free float 52.8%; P.Geelen 11.8%; P.F. Pauwels 11.8%; C.Goddijn 11.8%; H.Goddijn 11.8%; All share prices at 19/05/14. FINANCIAL CALENDAR (Source: Precise) PRICE (SHORT & LONG AVERAGE) t i t re 6.0 Profile: TomTom is a provider of personal navigation products, content and services to consumer mass markets, businesses and governmental agencies. Its main products are the TomTom Go, Via and One series, devices allowing for dynamic navigation and connectivity. It is a market leader in Europe and has the number two position in North America and has recently entered the In-car market in a deal with Renault. It has also entered the smart phone market by means of its deal with Apple. The acquisition of Tele Atlas (2007) has added a key ingredient for navigation: the digital database on which maps are based. This has allowed the company to branch out in various ways, including providing traffic services both the corporations and public entities. SWOT Analysis Strengths • Market leader in PND, Maps & Traffic Weaknesses • High R&D cost base • Strong balance sheet • Limited product range • Quality of software and content • No strategic view management Opportunities • Grow Fleet management Threats • Google expanding in Automotive • Expand in Automotive • Increased competition in Fleet management • Increase presenence in Fitness • Acceleration in decline in PND Recommendation: The consumer business is stabilizing and Telematics continues to grow rapidly. However, in Licensing TomTom continues to see revenues decline (despite the Apple contract) while in Automotive the phasing out of certain contracts will also result in declining revenues in FY14. The continued high investment levels is also a cause for concern, especially as the competition also increases spend, turning it into a rat race about who has the highest quality and richest map database. This will hamper both EBITDA and cash flow going forward. TomTom may have a strategic asset because of its map database but we do not see the founders (48%) looking at the available options (sale of minority stake in map business, IPO of TomTom telematics). As a result, we rate the shares Hold. 5.5 Target Price: EUR 5.00 5.0 4.5 4.0 TOMTOM SMALL & MID CAPS SELECTION Analyst(s) 3.5 3.0 2.5 2.0 Mar 11 Source : Factset Jun 11 Sep 11 Dec 11 Mar 12 Jun 12 Sep 12 Dec 12 Mar 13 Jun 13 Sep 13 Dec 13 Mar 14 Jun 14 Martijn den Drijver +312 0 5508636 SNS Securities [email protected] 191 Italy SMALL & MID CAPS SELECTION EUR 7.13 Hold TREVI TFI.MI/TFI IM Market capitalisation: EUR 501m Materials, Construction & Infrastructure EUR Sales (m) EBITDA (m) EBITDA margin EBIT (m) EBIT margin Net profit (reported) (m) Net profit (adj.) (m) Cash Flow from Ops.bef. chg in NWC (m) Net debt (Cash) (m) Net Debt/Equity Net Debt/EBITDA Interest cover (EBITDA/Fin. interest) ROCE (adj.) ROCE (adj.)/WACC EV / CE EV / Sales EV / EBITDA EV / EBIT P/E (adj.) P/BV OpFCF yield Dividend yield EPS (adj.) EPS (adj.) growth BVPS DPS Abs. Performances(12m,6m,3m,1m): 12 month High/low: EUR8.48 / 5.80 12/12 1,155 132 11.4% 60.4 5.2% 0.5 11.5 91.7 398 0.9 3.0 4.1 7.1% 1.0 0.9 0.7 6.1 13.3 24.7 0.7 14.1% 3.2% 0.16 -57.2% 5.97 0.13 12.1% 12/13 12/14e 12/15e 1,276 1,311 1,373 144 147 161 11.3% 11.2% 11.7% 80.3 76.4 89.4 6.3% 5.8% 6.5% 10.1 11.2 18.3 13.8 14.8 21.9 98.9 96.9 105 442 430 419 1.0 1.0 0.9 3.1 2.9 2.6 4.8 4.8 5.0 9.2% 8.7% 10.1% 1.2 1.2 1.4 1.2 1.2 1.2 0.8 0.8 0.8 7.0 7.2 6.6 12.5 13.9 11.8 32.1 33.7 22.9 1.1 1.2 1.2 12.9% 6.5% 5.9% 1.8% 1.8% 1.8% 0.20 0.21 0.31 19.7% 7.8% 47.6% 5.78 5.86 6.05 0.13 0.13 0.13 9.9% 2.4% -12.6% Avg. Daily nb traded shares:83,824 Main shareholders: Trevi family 50.2%; Free Float 49.8%; All share prices at 19/05/14. FINANCIAL CALENDAR (Source: Precise) PRICE (SHORT & LONG AVERAGE) titre 11 10/07/14 Dividend Payment 10 9 8 7 6 2013 Profile: the group is a world-wide leader in the field of soil engineering (special foundations, tunnel excavations, soil consolidation and the production and marketing of special rigs and equipment relevant to this engineering sector); the group is also active in the drilling sector (oil, gas and water), both in the production of plant and the supply of services. Its success is due to the vertical integration of its 4 divisions: Trevi, that supplies special services in the field of soil engineering and drilling; Petreven, the oil drilling division of the Group; Soilmec, that produces and develops rigs and equipment for soil engineering; and Drillmec, the division that produces and develops drilling rigs (oil, gas and water). SWOT Analysis Strengths • Strong interaction between equipment and service divisions • Strong track record and high technological level • High entry barriers (only 4 world players specialized in the soil foundation work) • High geographical diversification Opportunities • Strong increase expected in the Exploration and Production activity so in the drilling equipment sector • Potential big projects in the infrastructure in Middle East Weaknesses • Major competition in infrastructure andgeopolitical risks • difficulties in generating cash flow in view of sustained level capex to keep the business running and unbalances in NWC management •the USD exposure (50% of total sales) • Potential size problems (managers, technicians) Threats • Slowdown in the oil & gas prices entails low orders in the drilling equipment • A longer-than expected economic stagnation entail a further sales drop in the foundation division (especially in Europe) Q1 14 revenues decrease was due to a weak sales performance both in the foundation and drilling division (-8.6% Y/Y) and in the mechanical division (-19.1% Y/Y). The sales decrease negatively impacted the profitability (EBITDA margin moved from 12.5% in Q1 13 to 11.7% in Q1 14). Sound order book: thanks to the important orders in the drilling equipment obtained in the last few months, the order book at the end of March 2014 was of EUR 1,092m, +24.4% compared to EUR 877.4m at the end of December 2013 and in line with EUR 1,109m at the end of March 2013.. Perspectives for 4 group’s divisions: Foundation Services – despite a still difficult situation in some European markets, especially in Italy, a positive sales trend and stable margins should be achieved thanks to the long-term visibility of the order backlog and the several opportunities in some key markets. Foundation equipment – the continuous strong demand for construction and infrastructure in South and North America and in the Middle East and the recovery in some European key markets should allow the group to improve the profitability. Drilling service – after the postponement of some contracts in 2013, currently all 14 rigs of the group are in use; furthermore, one or two drilling works should begin during the current year. So, the profitability should benefit from the expected positive sales growth. Oil & gas Drilling equipment – the orders received in the last few months and the current negotiations confirm the current positive momentum in the oil and gas equipment market. The group has good perspectives to sign new contracts in onshore and off-shore sectors in Russia & CIS, Far East and America. FY 14 guidance: based on Q1 order book and on the current visibility, the management said that the group should achieve FY 14 sales around EUR 1.3bn (vs FY 13 sales of EUR 1.28bn), a FY 14 EBIT of approximately EUR 70m (vs FY 13 EBIT of EUR 80m) and FY 14 NFP in line with the previous year. We have factored the new guidance into our FY 14e estimates. Recommendation: based on the current visibility, we confirm our Hold recommendation and our target price of EUR 8.20 per share, which is calculated based on the DCF model valuation (WACC 7.4%, 1.5% perpetual growth rate). Target Price: EUR 8.20 5 Analyst(s) 4 3 Mar 11 Source : Factset 192 Jun 11 Sep 11 Dec 11 Mar 12 Jun 12 Sep 12 Dec 12 Mar 13 Jun 13 Sep 13 Dec 13 Mar 14 Jun 14 Paola Saglietti Banca Akros +39 02 4344 4287 [email protected] Spain SMALL & MID CAPS SELECTION EUR 3.61 Hold TUBACEX TUBA.MC/TUB SM Market capitalisation: EUR 479m Basic Resources EUR Sales (m) EBITDA (m) EBITDA margin EBIT (m) EBIT margin Net profit (reported) (m) Net profit (adj.) (m) Cash Flow from Ops.bef. chg in NWC (m) Net debt (Cash) (m) Net Debt/Equity Net Debt/EBITDA Interest cover (EBITDA/Fin. interest) ROCE (adj.) ROCE (adj.)/WACC EV / CE EV / Sales EV / EBITDA EV / EBIT P/E (adj.) P/BV OpFCF yield Dividend yield EPS (adj.) EPS (adj.) growth BVPS DPS Abs. Performances(12m,6m,3m,1m): 12 month High/low: EUR3.61 / 2.27 12/12 532 45.8 8.6% 26.5 5.0% 11.9 11.9 31.3 262 1.0 5.7 3.4 3.9% 0.4 1.1 1.0 11.8 20.3 22.3 1.0 -11.9% 1.5% 0.09 nm 1.89 0.03 43.3% 12/13 12/14e 12/15e 554 573 611 51.3 62.4 70.1 9.3% 10.9% 11.5% 31.5 39.6 46.4 5.7% 6.9% 7.6% 15.0 19.4 24.8 15.0 19.4 24.8 34.4 42.6 49.1 196 187 180 0.7 0.7 0.6 3.8 3.0 2.6 3.8 4.9 5.7 5.4% 6.7% 7.6% 0.6 0.7 0.8 1.4 1.5 1.5 1.1 1.2 1.1 11.6 10.9 9.6 18.8 17.2 14.5 25.6 24.7 19.3 1.5 1.7 1.6 20.8% 2.7% 2.8% 1.0% 1.2% 1.4% 0.11 0.15 0.19 26.6% 29.2% 27.8% 1.95 2.07 2.21 0.03 0.04 0.05 26.3% 19.6% 7.3% Avg. Daily nb traded shares:1,116,396 Main shareholders: Free float 62.0%; J.M Aristrain 11.0%; Amber 7.0%; Profile: Tubacex is specialized in the production of seamless stainless steel tubes. World production of seamless stainless steel tubes is only around 0.3 million tonnes. Tubacex is the second producer worldwide in what is an extremely concentrated market (80% of output in the hands of the top four manufacturers). Tubacex tubes are extruded to withstand extreme pressures and temperature conditions. The company's main clients are in industries like oil, petrochemicals, chemicals, energy, nuclear power, aeronautics, automobiles. Its business is primarily export-led. SWOT Analysis Strengths • SBER and TTI's specialised added value products Weaknesses • Moderate growth sector • Entrance barriers in the sector • Highly dependent on the projects market • Large investments in the petrochemical sector • Highly cyclical Opportunities • Better product mix Threats • The volatility of nickel prices is not positive. • Potential to increase market share • A strong fall in nickel price could affect the P&L account • High free float • Growing supply • Prolonged economic weakness Recommendation: 1Q14 results slightly better than expected in 1Q’14. The reactivation of nickel prices is giving the market a boost and the Oil & Gas sector continues very active, as demonstrated by engineering companies backlog. EBITDA margin reached 11.8%, above the 11% target for this period. At the end of 1Q’14, working capital fell a little compared to 2013, and is now at 39% o/sales 12m, below the first phase target (<45%). Net debt reached EUR176.7m, below 2013 (3.3x net debt/EBITDA’12m). By the end of the year we expect the company to near the target of <3x.. Ecofin Ltd. 4.9%; All share prices at 19/05/14. Target Price: EUR 3.70 FINANCIAL CALENDAR (Source: Precise) PRICE (SHORT & LONG AVERAGE) titre 4.0 28/05/14 AGM 2013 27/05/14 AGM 2013 3.5 3.0 2.5 Iñigo Recio Pascual 2.0 1.5 Mar 11 TUBACEX SMALL & MID CAPS SELECTION Analyst(s) Jun 11 Sep 11 Dec 11 Mar 12 Jun 12 Sep 12 Dec 12 Mar 13 Jun 13 Sep 13 Dec 13 Mar 14 +34 91 436 7814 BEKA Finance [email protected] Jun 14 Source : Factset 193 France SMALL & MID CAPS SELECTION EUR 14.26 Hold UBISOFT UBIP.PA/UBI FP Market capitalisation: EUR 1490m Media EUR Sales (m) EBITDA (m) EBITDA margin EBIT (m) EBIT margin Net profit (reported) (m) Net profit (adj.) (m) Cash Flow from Ops.bef. chg in NWC (m) Net debt (Cash) (m) Net Debt/Equity Net Debt/EBITDA Interest cover (EBITDA/Fin. interest) ROCE (adj.) ROCE (adj.)/WACC EV / CE EV / Sales EV / EBITDA EV / EBIT P/E (adj.) P/BV OpFCF yield Dividend yield EPS (adj.) EPS (adj.) growth BVPS DPS Abs. Performances(12m,6m,3m,1m): 12 month High/low: EUR14.26 / 8.19 03/13 1,256 461 36.7% 87.9 7.0% 64.8 68.4 451 -111 -0.1 -0.2 99.5 9.4% 1.0 1.0 0.6 1.5 8.0 14.6 1.0 0.4% 0.0% 0.58 62.0% 8.73 0.00 45.8% 03/14e 03/15e 03/16e 1,007 1,518 1,638 307 618 691 30.5% 40.7% 42.2% -97.9 158 195 nm 10.4% 11.9% -67.2 100.0 129 -67.2 100.0 129 300 570 635 13.3 -67.2 -170 0.0 -0.1 -0.2 0.0 -0.1 -0.2 41.1 nm nm -5.8% 14.3% 16.6% -0.6 1.5 1.7 1.8 1.8 1.6 1.4 0.9 0.8 4.5 2.3 1.9 nm 9.1 6.8 nm 15.7 12.2 1.7 1.6 1.4 -12.0% 5.4% 6.9% 0.0% 0.0% 0.0% -0.61 0.91 1.17 -chg +chg 29.0% 7.75 8.71 9.94 0.00 0.00 0.00 43.0% 19.8% 13.7% Avg. Daily nb traded shares:507,913 Main shareholders: Free float 89.4% (81.6%); FrŠres Guillemot 10.6% (18.4%); All share prices at 19/05/14. Profile: Ubisoft is a key player in video games (No. 4 in Europe and in the US), active in high-end games for core gamers as well as casual games and mobile/tablets. Breakdown of sales in 2012-13: 26% casual, 74% HD, 12% online, with the main platforms being Nintendo Wii 15%, Xbox 360 34%, PS3 30%. SWOT Analysis Strengths • Strong brands: 4 key franchises for the next cycle (Assassin's Creed, Just Dance, Far Cry, Watch Dogs) • Creative capability in casual games (Just Dance) • Know how on "open world" games, key feature of next gen consoles • Lack of regularity in game releases (eg WatchDogs) Opportunities • Success of next gen consoles Threats • High-end games for the new consoles: very competitive market, there will be an inflation of thedeveloment costs cycle •over Fallthe of Nintendo Wii casual segment • Development of digital games Recommendation: The stock price recovered strongly after the warning last October due to the delay for Watch Dogs. The stock is now trading at an EV/Sales of 0.9x, compared to 1.5x for EA, and EV/EBIT of 9.6x, higher than Activision (8.8x) and EA (9.4x). This multiple is based on the company’s 2014-15 guidance of EBIT at EUR150m, assuming solid successes for Watch Dogs and Assassin’s Creed, and no bad surprises! We therefore believe that the risk/reward is unattractive at the current share price, as Ubisoft clearly deserves a discount to its two major competitors, which have stronger brands and advantages in terms of size, profitability and being more advanced in the move toward digital distribution and mobile (EA). FINANCIAL CALENDAR (Source: Precise) PRICE (SHORT & LONG AVERAGE) Weaknesses • Size vs US majors (sales EUR1.0bn vs USD4.3bn for Activision and USD3.9bn for EA) • Weak presence in certain genres, most notably sport and cars • Still small in online distribution, free-to-play and mobile Target Price: EUR 12.50 titre 16 01/07/14 AGM 14 10 8 Eric Ravary 6 4 2 Mar 11 Source : Factset 194 2014 UBISOFT SMALL & MID CAPS SELECTION Analyst(s) 12 Jun 11 Sep 11 Dec 11 Mar 12 Jun 12 Sep 12 Dec 12 Mar 13 Jun 13 Sep 13 Dec 13 Mar 14 Jun 14 +33 1 45 96 79 53 CM - CIC Securities [email protected] Finland SMALL & MID CAPS SELECTION EUR 14.00 Buy UPONOR UNR1V.HE/UNR1V FH Market capitalisation: EUR 1025m Materials, Construction & Infrastructure EUR Sales (m) EBITDA (m) EBITDA margin EBIT (m) EBIT margin Net profit (reported) (m) Net profit (adj.) (m) Cash Flow from Ops.bef. chg in NWC (m) Net debt (Cash) (m) Net Debt/Equity Net Debt/EBITDA Interest cover (EBITDA/Fin. interest) ROCE (adj.) ROCE (adj.)/WACC EV / CE EV / Sales EV / EBITDA EV / EBIT P/E (adj.) P/BV OpFCF yield Dividend yield EPS (adj.) EPS (adj.) growth BVPS DPS Abs. Performances(12m,6m,3m,1m): 12 month High/low: EUR15.74 / 11.00 12/12 812 86.9 10.7% 57.7 7.1% 32.9 32.9 62.1 94.1 0.4 1.1 10.5 14.4% 1.6 2.5 0.9 8.8 13.2 21.4 3.4 2.9% 4.0% 0.45 40.0% 2.87 0.38 12.9% 12/13 12/14e 12/15e 906 1,036 1,097 83.2 114 134 9.2% 11.0% 12.3% 50.2 77.9 97.0 5.5% 7.5% 8.8% 28.1 44.9 56.8 28.1 44.9 56.8 60.1 84.4 99.1 96.9 68.3 50.2 0.3 0.2 0.2 1.2 0.6 0.4 11.9 12.2 15.1 9.6% 15.3% 18.9% 1.1 1.7 2.1 2.8 2.7 2.7 1.2 1.0 1.0 13.4 9.3 7.8 22.1 13.7 10.8 37.0 22.8 18.0 4.7 4.3 4.0 0.9% 5.8% 5.8% 2.7% 3.6% 3.9% 0.38 0.61 0.78 -14.6% 59.8% 26.6% 3.00 3.24 3.51 0.38 0.50 0.54 -7.9% 11.6% 7.9% Avg. Daily nb traded shares:18,239 Profile: Uponor provides plastic pipe systems to international building markets. Main demand drivers are new residential construction and residential renovation in Europe and in North-America. The company provides plumbing and indoor climate solutions as well as infrastructure systems. Plastic resins are the key raw material in production. Plastic pipe systems continue to gain ground both in new build and renovation, thanks to their handling properties, easy installation and durability. The largest countries by sales are Germany, USA, Finland, Sweden, Norway, Canada and Denmark. SWOT Analysis Strengths • Brand loyalty Weaknesses • Large role of wholesalers in the distribution chain • Pricing power • Raw material costs driven by oil prices • Sustainability and energy efficiency foster the company's offering • Plastic systems continue to replace copper Opportunities • Energy efficiency favours hydronic heating and cooling systems • Revival of construction markets in the US and especially in Europe • Possible entry into Asia Threats • Tightening competition, Private label, Asian manufacturers • European construction volumes suffering for a long time • Consolidation benefits in Uponor Infra Main shareholders: Free float 75.0%; Oras Invest Oy 22.6%; Varma Mutual Pension Insurance Co 7.1%; Ilmarinen Mutual Pension Insurance Co 1.9%; All share prices at 19/05/14. FINANCIAL CALENDAR (Source: Precise) PRICE (SHORT & LONG AVERAGE) titre 16 15 25/07/14 Results 2014Q2 25/07/14 Results 2014Q2 Recommendation: We see Uponor as an early cyclical company benefitting from European recovery. It has major growth potential in the medium term when new residential construction takes an upward turn in Europe after 7 consecutive years of decline and the low capacity utilisation rate of around 50 % picks up. Stabilisation of the European decline will bolster top-line growth already this year and launching the SACP product innovation will prop up growth through a strengthening market share. Furthermore, Uponor Infra is in a good place to improve its profits through consolidation benefits. The EUR 16 target price is based on our 2015 forecast and the 5-year average EV/EBIT of 12.5. Target Price: EUR 16.00 14 13 12 11 UPONOR SMALL & MID CAPS SELECTION Analyst(s) 10 9 8 7 6 Mar 11 Source : Factset Jun 11 Sep 11 Dec 11 Mar 12 Jun 12 Sep 12 Dec 12 Mar 13 Jun 13 Sep 13 Dec 13 Mar 14 Jun 14 Matias Rautionmaa +358 10 252 4408 Pohjola [email protected] 195 Netherlands SMALL & MID CAPS SELECTION EUR 10.40 Reduce USG PEOPLE USGP.AS/USG NA Market capitalisation: EUR 842m Support Services EUR Sales (m) EBITDA (m) EBITDA margin EBIT (m) EBIT margin Net profit (reported) (m) Net profit (adj.) (m) Cash Flow from Ops.bef. chg in NWC (m) Net debt (Cash) (m) Net Debt/Equity Net Debt/EBITDA Interest cover (EBITDA/Fin. interest) ROCE (adj.) ROCE (adj.)/WACC EV / CE EV / Sales EV / EBITDA EV / EBIT P/E (adj.) P/BV OpFCF yield Dividend yield EPS (adj.) EPS (adj.) growth BVPS DPS Abs. Performances(12m,6m,3m,1m): 12 month High/low: EUR14.10 / 5.00 12/12 2,877 106 3.7% 67.9 2.4% 36.6 45.9 50.1 244 0.5 2.3 8.9 7.2% 0.8 1.2 0.3 7.8 12.1 10.4 1.0 5.1% 2.0% 0.58 -25.6% 6.29 0.12 73.5% 12/13 12/14e 12/15e 2,270 2,397 2,492 82.5 106 118 3.6% 4.4% 4.7% 53.0 78.6 90.6 2.3% 3.3% 3.6% 23.6 44.6 54.5 21.0 58.1 68.0 -5.4 25.5 79.4 178 189 169 0.4 0.4 0.3 2.2 1.8 1.4 8.6 14.0 21.1 6.2% 9.2% 10.4% 0.7 1.7 1.8 1.7 0.5 0.5 0.5 13.0 10.9 9.5 20.3 14.7 12.4 36.9 14.5 12.4 1.7 1.8 1.6 -3.4% -0.3% 4.1% 1.3% 2.3% 3.2% 0.26 0.72 0.84 -54.7% 173.1% 17.0% 5.73 5.90 6.35 0.14 0.24 0.34 9.5% -21.2% -10.7% Avg. Daily nb traded shares:809,545 Main shareholders: Free float 76.0%; Alex Mulder 20.0%; Norges Bank 4.0%; Profile: USG People is a generalist staffing company with a substantial exposure to small and medium sized companies. It also has a relatively high exposure to specialty niches. Approximately 50% of total sales are specialty or professional staffing business. The company is executing a re-invigoration of its business portfolio, with operating command per vertical assumed at the head office. The company is actively going after a multitude of perceived opportunities, and the much-speculated bid-an-break-up scenario is not on the management’s cards. SWOT Analysis Strengths • Exposure to SME market Weaknesses • Exposure to relatively mature Benelux market • Benelux market shares • Lack of strategic clout elsewhere • Secretary+ vertical excellence • Cyclical due to high fixed cost base (multi-brand) • Financial leverage Opportunities • Best-practice know-how transfer amongst divisions • Sell France in the upturn Threats • Aggressive market share strategy from the major staffing companies • Penetration in the Netherlands stagnant Recommendation: We stay on the sidelines as USG’s strategic ambitions are being pursued in the cyclical upswing. Recent performance appears to have exaggerated the impact of momentum on fundamental runner-up value in the Benelux and small shares in France and Germany. On 10x restructured and recovered 2015E EV/EBITDA, the stock’s valuation too easily takes success for granted. Reduce. All share prices at 19/05/14. Target Price: EUR 6.50 FINANCIAL CALENDAR (Source: Precise) PRICE (SHORT & LONG AVERAGE) titre 14 30/07/14 Analyst Meeting 13 2014Q2 12 11 05/06/14 Dividend Payment 10 9 8 7 6 5 4 Mar 11 Source : Factset 196 Jun 11 Sep 11 Dec 11 Mar 12 Jun 12 Sep 12 Dec 12 Mar 13 Jun 13 Sep 13 Dec 13 Mar 14 Jun 14 2013 USG PEOPLE SMALL & MID CAPS SELECTION Analyst(s) Gert Steens +312 0 5508639 SNS Securities [email protected] Finland SMALL & MID CAPS SELECTION EUR 29.04 Reduce VACON VAC1V.HE/VAC1V FH Market capitalisation: EUR 885m Electronic & Electrical Equipment EUR Sales (m) EBITDA (m) EBITDA margin EBIT (m) EBIT margin Net profit (reported) (m) Net profit (adj.) (m) Cash Flow from Ops.bef. chg in NWC (m) Net debt (Cash) (m) Net Debt/Equity Net Debt/EBITDA Interest cover (EBITDA/Fin. interest) ROCE (adj.) ROCE (adj.)/WACC EV / CE EV / Sales EV / EBITDA EV / EBIT P/E (adj.) P/BV OpFCF yield Dividend yield EPS (adj.) EPS (adj.) growth BVPS DPS Abs. Performances(12m,6m,3m,1m): 12 month High/low: EUR31.10 / 23.95 12/12 388 48.3 12.4% 37.7 9.7% 26.6 25.6 37.1 -2.4 0.0 0.0 53.7 27.1% 4.7 5.8 1.5 12.4 15.9 24.0 5.7 5.4% 2.7% 0.84 5.0% 3.55 0.55 3.7% 12/13 403 54.4 13.5% 40.7 10.1% 29.6 29.6 42.5 -7.7 -0.1 -0.1 60.4 29.3% 5.1 8.1 2.2 16.0 21.4 30.1 7.6 2.7% 2.2% 0.97 16.1% 3.85 0.65 2.8% 12/14e 12/15e 423 451 61.6 67.0 14.6% 14.9% 47.6 53.0 11.2% 11.8% 35.7 40.0 35.7 40.0 49.5 53.8 -15.5 -28.0 -0.1 -0.2 -0.3 -0.4 nm high 33.1% 35.2% 5.8 6.1 7.7 7.3 2.0 1.9 13.9 12.6 18.0 15.9 24.8 22.2 6.7 6.0 3.4% 3.7% 2.4% 2.8% 1.17 1.31 20.7% 11.8% 4.31 4.85 0.70 0.80 0.5% -2.0% Avg. Daily nb traded shares:8,604 Main shareholders: Free float 100.0%; Ac Invest Three Bv 13.5%; Ilmarinen Mutual Pension Insurance Company 5.6%; Tapiola Mutual Pension Insurance Company 3.8%; All share prices at 19/05/14. Profile: Vacon develops and manufactures low voltage AC drives that are used for controlling the speed of electric motors and in renewable energy production. Vacon’s R&D and production units are located in Finland, the US, China, India and Italy, and the company has sales offices in 30 countries. The largest industry segments using AC drives are building automation, cranes & hoists, marine & offshore, mining & metals, water & wastewater, elevators & escalators, pulp & paper, food & beverage, solar and wind. In 2013, Vacon made approximately 60% of its sales in the EMEA region, 17% in the Americas and 23% in APAC. Vacon estimates that its share of the global AC drives market is approximately 5%. The low voltage AC driver market is quite fragmented. The company's competitors include ABB, Siemens, Schneider Toshiba and Rockwell. SWOT Analysis Strengths • Strong market position in low frequency AC drives Weaknesses • Small in size • Extensive product selection for different applications and power ranges • Wide and evenly spread clientele • Service business represents a minor portion of sales • Good profitability thanks to a narrow product strategy focus Opportunities • Small market share enables growth through market share gains as well • Renewable energy products offer growth potential • Technological changes, maintaining position at the cutting edge of development Recommendation: Vacon’s Q1 sales were on a par with our estimate, but operating profit missed both our forecast and the optimistic consensus. The broad guidance was reiterated: 5–15% top-line growth, margin between 11% and 13%. Even the mid-point of it will require notable profitability improvement later this year on Q1 and the same period last year. Q1 demonstrated that when sales total less than EUR 100m, margin will be clearly below the target readings. Vacon’s growth, profitability and balance sheet justify a premium, but not as high as currently. In our opinion, the share price reflects future growth/profitability, which is hard to achieve. FINANCIAL CALENDAR (Source: Precise) PRICE (SHORT & LONG AVERAGE) Threats • Increasing competition from low-cost countries Target Price: EUR 25.00 titre 32 30 30/07/14 Results 2014H1 30/07/14 Analyst Meeting 2014H1 28 26 24 22 20 18 Pekka Spolander 16 14 12 Mar 11 VACON SMALL & MID CAPS SELECTION Analyst(s) Jun 11 Sep 11 Dec 11 Mar 12 Jun 12 Sep 12 Dec 12 Mar 13 Jun 13 Sep 13 Dec 13 Mar 14 +358 10 252 4351 Pohjola [email protected] Jun 14 Source : Factset 197 Finland SMALL & MID CAPS SELECTION EUR 23.60 Reduce VAISALA VAIAS.HE/VAIAS FH Market capitalisation: EUR 426m Electronic & Electrical Equipment EUR Sales (m) EBITDA (m) EBITDA margin EBIT (m) EBIT margin Net profit (reported) (m) Net profit (adj.) (m) Cash Flow from Ops.bef. chg in NWC (m) Net debt (Cash) (m) Net Debt/Equity Net Debt/EBITDA Interest cover (EBITDA/Fin. interest) ROCE (adj.) ROCE (adj.)/WACC EV / CE EV / Sales EV / EBITDA EV / EBIT P/E (adj.) P/BV OpFCF yield Dividend yield EPS (adj.) EPS (adj.) growth BVPS DPS Abs. Performances(12m,6m,3m,1m): 12 month High/low: EUR24.98 / 17.75 12/12 293 146 49.7% 30.1 10.3% 21.7 21.7 138 -71.6 -0.4 -0.5 high 20.8% 3.1 1.9 0.7 1.4 7.0 13.2 1.5 49.5% 13.2% 1.20 108.4% 10.55 2.10 9.6% 12/13 273 135 49.3% 18.2 6.7% 11.1 11.1 128 -37.8 -0.2 -0.3 high 12.6% 1.9 3.3 1.4 2.8 20.4 37.8 2.6 28.8% 3.8% 0.61 -48.8% 9.01 0.90 19.2% 12/14e 12/15e 310 344 157 175 50.8% 50.8% 27.4 35.6 8.8% 10.3% 19.6 25.5 19.6 25.5 150 165 -33.8 -42.7 -0.2 -0.2 -0.2 -0.2 high high 17.6% 22.8% 2.6 3.4 3.2 3.1 1.2 1.1 2.4 2.1 14.0 10.5 21.8 16.7 2.6 2.4 28.4% 35.5% 3.8% 4.2% 1.08 1.41 76.3% 30.1% 9.22 9.74 0.90 0.99 -2.3% 0.2% Avg. Daily nb traded shares:1,008 Profile: Vaisala is a globally leading environmental and industrial measurement company established 75 years ago. Vaisala sells and develops observation and measurement products and services for meteorology, weather-dependent businesses (73% of sales) and controlled environments (27% of sales). The customers of the Weather business are meteorological institutes, airports, road and railroad, defence, and the energy industry. The Controlled Environment business offers products and services to life science customers and chosen applications in various industries. Headquartered in Finland, Vaisala employs over 1,400 people. In 2013, exports represented 97% of Vaisala’s sales, with North America contributing 39%, Asia Pacific 25% and Europe 36%. Vaisala does not have any major competitors, only small rivals. SWOT Analysis Strengths • Market leader in several sectors related to weather observation and measurement • Highly fragmented market, competitors are small compared to Vaisala • Strong balance sheet Weaknesses • Customers are very dependent on government budget appropriations • Service business accounts for a minor share of sales Opportunities • The role of environmental measurement is continuously increasing • Expanding the business to selected industry and healthcare sectors Threats • Legislation changes (some products are for defence industry) • New customer industries fail to grow as expected Main shareholders: Free float 100.0%; Novametor Oy 10.2%; Suomalainen Tiedeakatemia 7.3%; Mikko Voipio 3.5%; Recommendation: On our new forecasts, Vaisala’s valuation is still high given the weak visibility into this year. Vaisala is an interesting company in the long term but, over a 12-month horizon, we consider the return potential of the company’s shares limited. All share prices at 19/05/14. Target Price: EUR 22.00 FINANCIAL CALENDAR (Source: Precise) PRICE (SHORT & LONG AVERAGE) titre 25 23/07/14 Results 24 23 22 26/05/14 Capital Markets Day 21 20 19 18 16 15 14 Mar 11 198 VAISALA SMALL & MID CAPS SELECTION Analyst(s) Hannu Rauhala 17 Source : Factset 2014Q2 Jun 11 Sep 11 Dec 11 Mar 12 Jun 12 Sep 12 Dec 12 Mar 13 Jun 13 Sep 13 Dec 13 Mar 14 Jun 14 +358 10 252 4392 Pohjola [email protected] Netherlands SMALL & MID CAPS SELECTION EUR 36.65 Hold VASTNED RETAIL VASN.AS/VASTN NA Market capitalisation: EUR 698m Real Estate EUR 12/12 133 107 80.0% (121) (37) (41) 63 62.55 864 1,981 1,488 3.31 2.55 47.26 (30.7%) 50.55 10.1% 7.8% 13.9 10 3.0 864 43.1% 1.8% 12/13 12/14e 12/15e 123 98 105 EBITDA (m) 98 78 83 EBITDA margin 79.4% 79.2% 79.5% Portfolio Result (m) (131) (50) 0 Net Financial Result (47) (29) (29) Net Profit (reported)(m) (89) (10) 47 Net Profit (adj.)(m) 54 42 47 Funds From Operations 54.20 42.13 47.06 Net Debt (m) 751 670 672 Portfolio Value (m) 1,536 1,561 1,581 Enterprise Value (m) 1,378 1,368 1,370 EPS (adj.) 2.85 2.21 2.47 DPS 2.55 1.88 2.10 IFRS NAVPS 41.57 38.71 39.25 Premium/(discount) (20.7%) (5.3%) (6.6%) EPRA NAVPS 44.47 41.41 41.99 Earnings adj. yield 7.8% 6.0% 6.7% Dividend yield 7.0% 5.1% 5.7% EV/EBITDA 14.1 17.5 16.4 P/E (adj.) 12 17 15 Int. cover(EBITDA/Fin.int) 2.8 2.7 2.9 Net debt/(cash) (m) 751 670 672 Net Debt/Total Assets 43.9% 42.5% 42.2% Abs. Performances(12m,6m,3m,1m): 7.7% 1.2% 4.1% 12 month High/low: EUR38.81 / 29.79 Avg. Daily nb traded shares:17,869 Main shareholders: Free float 77.0% (82.1%); CBRE Clarion Securities 6.9%; Commonwealth Bank of Australia 5.7%; Gross Rental Income (m) Belfius Insurance 5.3%; Stichting Pensioenfonds ABP 5.2%; All share prices at 19/05/14. Profile: Vastned Retail is a Dutch REIT with a property portfolio of EUR 1.7bn invested in high street shops (69.3%) and other retail properties (mainly shopping centres and to a lesser extent retail warehouses). The strategy is to increase the share of high street shops to 65%, with a focus on A-locations in major cities. The portfolio is located in the Netherlands (36.8%), France (21.2%), Belgium (21.3%), Spain/Portgual (7.6%) and Turkey (13.0%). The property portfolio comprises approx. 550 properties, with the top 50 properties representing about 70% of the total portfolio value. Vastned Retail was founded in 1986 listed on Euronext Amsterdam since November 1987 and on Euronext Paris since December 2004. SWOT Analysis Strengths • Well diversified, large retail portfolio • Defensiveness high-street portfolio Weaknesses • Exposure to Spanish retail market, but has been reduced in January 2014 • Limited organic growth track record and potential • Liquid portfolio (a lot of small properties) • Part of properties are secondary • Portfolio rents overall in line with market Opportunities • Strategy of increasing the share of high street shops from 49% to 65% should decrease risk profile and increase growth potential •organic Hands-on tenant management Threats • Marco-economic situation, especially in Spain • E-commerce • CFO is leaving the company at the end of the year Recommendation: The direct result per share for 2013 was EUR 2.85 down 13.9% vs 2012 (EUR 3.31). This is at the upper end of management’s guidance (between EUR 2.75 and EUR 2.85) as at the publication of 9M13 results. EPRA NAV per share was EUR 43.58, down 14.9% over the year. Hence, Vastned Retail is trading at a discount of 16.0%. As a result of divestments at the end of 2013 and beginning 2014, management expects the FY14E direct result per share to range between EUR 2.10 and EUR 2.30. We expect a comparable decline in FY14E dividend. We maintain our Hold recommendation. Target Price: EUR 39.00 FINANCIAL CALENDAR (Source: Precise) PRICE (SHORT & LONG AVERAGE) titre 55 14/08/14 Results 50 29/05/14 Dividend Payment 45 2014H1 2013 40 22/05/14 Results 35 19/05/14 Ex Dividend Date 30 25 Mar 11 Jun 11 Sep 11 Dec 11 Mar 12 Jun 12 Sep 12 Dec 12 Mar 13 Jun 13 Sep 13 Dec 13 Mar 14 2014Q1 VASTNED RETAIL SMALL & MID CAPS SELECTION Analyst(s) Dirk Peeters +32 2 287 97 16 Bank Degroof [email protected] 2013 Jun 14 Source : Factset 199 France SMALL & MID CAPS SELECTION EUR 59.25 Hold VICAT VCTP.PA/VCT FP Market capitalisation: EUR 2602m Materials, Construction & Infrastructure EUR Sales (m) EBITDA (m) EBITDA margin EBIT (m) EBIT margin Net profit (reported) (m) Net profit (adj.) (m) Cash Flow from Ops.bef. chg in NWC (m) Net debt (Cash) (m) Net Debt/Equity Net Debt/EBITDA Interest cover (EBITDA/Fin. interest) ROCE (adj.) ROCE (adj.)/WACC EV / CE EV / Sales EV / EBITDA EV / EBIT P/E (adj.) P/BV OpFCF yield Dividend yield EPS (adj.) EPS (adj.) growth BVPS DPS Abs. Performances(12m,6m,3m,1m): 12 month High/low: EUR63.49 / 45.88 12/12 2,292 437 19.1% 246 10.7% 129 129 327 1,193 0.5 2.7 12.7 4.5% 0.6 0.9 1.5 8.1 14.4 16.1 1.0 2.4% 2.5% 2.94 -21.3% 48.52 1.50 24.3% 12/13e 12/14e 12/15e 2,331 2,382 2,461 446 488 541 19.1% 20.5% 22.0% 255 292 335 10.9% 12.3% 13.6% 136 161 191 136 162 193 324 359 402 1,119 1,012 851 0.4 0.4 0.3 2.5 2.1 1.6 10.6 12.7 16.7 4.6% 5.4% 6.3% 0.7 0.7 nm 0.9 1.0 1.0 1.5 1.6 1.5 8.1 7.7 6.7 14.2 12.9 10.8 17.4 16.0 13.3 1.1 1.2 1.1 6.9% 7.7% 9.8% 2.7% 2.9% 2.9% 3.10 3.71 4.44 5.4% 19.9% 19.6% 49.59 51.10 53.30 1.60 1.70 1.70 7.9% 4.8% -3.2% Avg. Daily nb traded shares:10,550 Main shareholders: Family & Holdings 60.6%; Free Float 31.7%; Employees 4.7%; Treasury stock 3.1%; All share prices at 19/05/14. Profile: Vicat is the third largest cement producer in France (16% of market share), and is vertically integrated in aggregates and ready-mix concrete. The group is present in eight countries, and remains highly exposed to the French market (38% of its 2013 sales), mainly in the Rhône-Alpes and south-west regions. Emerging markets now account for 30% of sales and 65% of cement production capacity. Regional breakdown of 2013 sales: France 37%, US 10%, Switzerland and Italy 19%, Turkey-Kazakhstan and India 20%, Mediterranean Rim/French-speaking West Africa 14%. SWOT Analysis Strengths Weaknesses Excellent management Profitability above the sector average Good industrial network reflected by better environmental performances than the sector average (C02, SOx and NOx emissions, energy savings, etc.). Targeted markets (plans for Kazakhstan, India) Programme to extend cement capacities (+50% by 2010). Specific situation unfavourable in Egypt (the plant is located in the Sinaï region, which is not very secure, and there is market disruption stemming from a new entrant) Plans to install terminals & grinders in France by importers Short-term downturn in African cement prices (ongoing new entrant Dangoté in Sénégal) Opportunities Threats Recommendation: Consolidated sales in the 2013 financial year came to EUR2,286 million, representing growth of 2.9% at constant scope and exchange rates compared with 2012. Net income attributable to equity holders of the parent decreased by 6.9% to EUR120 million. EBITDA of EUR427m declined by 2.2% but was stable on a like-for like basis. Ebitda was affected by 1) adverse pricing conditions in Africa 2) difficult market conditions in Egypt 3) start-up of Vicat Sagar Chatrasala greenfield plant coupled with economic slowdown in India. Conversely, improvement of the Construction sector in the “Sunbelt States” in US pushed North American profitability to positive numbers and strong momentum in Kazakhstan improved the EBITDA of Jambyl Cement by EUR12m. However, we think that after three years “in the wilderness” Vicat’s earnings are likely to improve in 2014-2015. On the back of a more competitive landscape in Sénégal we downgraded Vicat from Accumulate to Hold with a TP of EUR52. FINANCIAL CALENDAR (Source: Precise) PRICE (SHORT & LONG AVERAGE) Target Price: EUR 52.00 titre 65 04/08/14 Results 60 50 45 40 Jean-Christophe Lefèvre-Moulenq 35 30 Mar 11 Source : Factset 200 2014H1 VICAT SMALL & MID CAPS SELECTION Analyst(s) 55 Jun 11 Sep 11 Dec 11 Mar 12 Jun 12 Sep 12 Dec 12 Mar 13 Jun 13 Sep 13 Dec 13 Mar 14 Jun 14 +33 1 45 96 91 04 CM - CIC Securities [email protected] Spain SMALL & MID CAPS SELECTION EUR 36.58 Buy VIDRALA VID.MC/VID SM Market capitalisation: EUR 896m Food & Beverage EUR Sales (m) EBITDA (m) EBITDA margin EBIT (m) EBIT margin Net profit (reported) (m) Net profit (adj.) (m) Cash Flow from Ops.bef. chg in NWC (m) Net debt (Cash) (m) Net Debt/Equity Net Debt/EBITDA Interest cover (EBITDA/Fin. interest) ROCE (adj.) ROCE (adj.)/WACC EV / CE EV / Sales EV / EBITDA EV / EBIT P/E (adj.) P/BV OpFCF yield Dividend yield EPS (adj.) EPS (adj.) growth BVPS DPS Abs. Performances(12m,6m,3m,1m): 12 month High/low: EUR39.63 / 26.35 12/12 458 103 22.6% 65.3 14.3% 46.5 46.5 84.7 160 0.5 1.5 16.8 9.9% 1.3 1.3 1.4 6.4 10.1 11.0 1.5 13.4% 2.5% 1.90 6.5% 13.82 0.53 38.2% 12/13 12/14e 12/15e 474 493 503 110 122 127 23.3% 24.8% 25.2% 72.3 80.0 81.9 15.3% 16.2% 16.3% 52.3 60.9 63.5 52.3 60.9 63.5 90.4 103 108 118 86.9 46.0 0.3 0.2 0.1 1.1 0.7 0.4 27.7 47.7 nm 10.7% 11.9% 12.1% 1.4 1.6 1.6 2.0 1.8 1.7 2.2 2.0 1.8 9.2 7.9 7.3 14.1 12.1 11.3 17.5 14.7 14.1 2.4 2.1 1.9 4.7% 6.0% 6.6% 1.8% 2.0% 2.1% 2.14 2.49 2.59 12.4% 16.4% 4.2% 15.29 17.17 19.01 0.65 0.72 0.75 13.7% 0.8% -3.9% Avg. Daily nb traded shares:13,523 Main shareholders: Free float 48.0%; Familia Delclaux 40.0%; Addvalia 5.0%; Familia Gallo 3.5%; Bestinver 3.5%; All share prices at 19/05/14. Profile: Vidrala is a hollow glass manufacturer with 6 plants (13 furnaces) in 4 countries, and estimated production capacity of 1,125,000 tons/year. It holds a market share of 25% in the Iberian Peninsula, 6% in France, 4% in Italy and 8% in Western Europe. In recent years the companies benefitting most from the hollow-glass market in Europe have been the medium (Vidrala among these) and small sized companies increasing their market share and volumes. This is due to the gradual capacity reduction on behalf of the large players (e.g. O-I and Saint Gobain Verallia). Demand in Europe is still below pre-crisis levels. SWOT Analysis Strengths • Leading position in the Iberian Peninsula Weaknesses • Strong correlation with energy prices • Capacity to increase volumes • Little growth in Italy • Good geographic positioning • Low liquidity Opportunities • Better margins due to progressive start up of capacity Threats • Competition with other containers: Tetra brick, PET • advanced integration of the less efficient plants • Economic crisis • Sector consolidation Recommendation: 1Q14 results in line with forecasts. The fall in sales was due to the weak demand in addition to the programmed stop of a furnace for its renovation. This resulted in EBIT margin reaching 14.2% vs. 15.3% in 4Q’13. Net debt (EUR122.8m) dropped 30% in 1Q’14 vs. 1Q’13, thanks to the substantial cash generation and control of investments, in line with 2013 year end (EUR117.9m). Vidrala points to still weak demand, which limits the visibility in sales, although the cost reduction measures underway will allow operating margins to recover progressively. Although sales growth was low, and we will adjust full year forecasts, our opinion on the company is positive, pointing out the cost reduction policy, high EBIT margins, ongoing net debt reduction, shareholders remuneration. In this sense, at the next AGM, Vidrala will propose a final dividend of EUR0.175/share (July 14th) and 1x20 bonus issue. FINANCIAL CALENDAR (Source: Precise) PRICE (SHORT & LONG AVERAGE) Target Price: EUR 37.10 titre 40 30/05/14 AGM 2013 29/05/14 AGM 2013 35 30 25 Iñigo Recio Pascual 20 15 Mar 11 VIDRALA SMALL & MID CAPS SELECTION Analyst(s) Jun 11 Sep 11 Dec 11 Mar 12 Jun 12 Sep 12 Dec 12 Mar 13 Jun 13 Sep 13 Dec 13 Mar 14 +34 91 436 7814 BEKA Finance [email protected] Jun 14 Source : Factset 201 France SMALL & MID CAPS SELECTION EUR 97.19 Buy VILMORIN VILM.PA/RIN FP Market capitalisation: EUR 1840m Food & Beverage EUR Sales (m) EBITDA (m) EBITDA margin EBIT (m) EBIT margin Net profit (reported) (m) Net profit (adj.) (m) Cash Flow from Ops.bef. chg in NWC (m) Net debt (Cash) (m) Net Debt/Equity Net Debt/EBITDA Interest cover (EBITDA/Fin. interest) ROCE (adj.) ROCE (adj.)/WACC EV / CE EV / Sales EV / EBITDA EV / EBIT P/E (adj.) P/BV OpFCF yield Dividend yield EPS (adj.) EPS (adj.) growth BVPS DPS Abs. Performances(12m,6m,3m,1m): 12 month High/low: EUR101.80 / 84.89 06/12 1,338 269 20.1% 138 10.3% 80.6 86.9 249 316 0.3 1.2 19.6 7.3% 0.9 1.2 1.4 6.9 13.5 17.1 1.4 1.2% 1.8% 4.90 61.3% 58.48 1.50 3.4% 06/13 1,472 302 20.5% 157 10.6% 99.4 86.6 265 337 0.3 1.1 18.5 7.4% 0.9 1.4 1.5 7.2 13.8 20.4 1.6 4.2% 1.7% 4.31 -11.9% 54.17 1.65 3.9% 06/14e 06/15e 1,580 1,660 328 350 20.8% 21.1% 169 181 10.7% 10.9% 101 109 103 111 267 286 306 246 0.2 0.2 0.9 0.7 15.6 17.5 7.9% 8.3% 0.9 1.0 1.4 1.3 1.5 1.4 7.0 6.4 13.6 12.4 19.0 17.5 1.6 1.5 2.5% 4.9% 1.7% 1.8% 5.13 5.54 18.8% 8.1% 59.98 64.10 1.65 1.75 -0.6% 0.4% Avg. Daily nb traded shares:5,150 Main shareholders: Limagrain 61.7% (75.5%); Free float 27.6% (18.0%); CDC 5.0% (6.5%); All share prices at 19/05/14. FINANCIAL CALENDAR (Source: Precise) PRICE (SHORT & LONG AVERAGE) titre 105 July 30th 2014 Q4 2013-2014 October 7th results 2013-2014 100 95 90 Profile: Vilmorin is the fourth biggest global seed player, operating on the professional market and selling vegetable seeds (46% of sales) and cereal seeds (54% of sales). The group is present on all five continents, with Europe accounting for 61% of sales and France 26%. The US accounts for 27% of sales via a 50/50 joint venture with German seed player KWS. Asia accounts for 7% of its activity and the rest of the world 5%. SWOT Analysis Strengths • Growing market Weaknesses • Level on price in emergent country • Very technological market due to the appearance of GMOs and the genomic seed • Sector dominated by europaen and american companies • Level on R&D Opportunities • Significant growth in new profitable markets i.e. India and China • Increasing power of GMOs Threats • Monsanto has today the world leadership of stickers GMOs • Risk in Europe with the ecologist for GMOs technology • Developped on own stickers GMOs (corn and wheat) • Inter connexion between seed company and the governments in emergent country • Price on M&A go up Recommendation: With consolidated sales in Asia already representing 9% of group sales (mainly Japan and China), Vilmorin is pursuing its acquisitions strategy – as announced – in order to enhance its foothold in Asia and its species variety in its arable crops portfolio. The target acquired is based in Thailand and specialised in hybrid tropical corn seeds. Seed Asia has over 80 employees and sales of USD9m with a significant distribution network (200 distributors) spread throughout South East Asia. 40% of its sales are generated through exports: Cambodia, Myanmar, Sri Lanka, etc. This acquisition provides Vilmorin with a new field of activity, i.e. tropical corn, which accounts for nine million hectares of corn in Asia. The technological contribution of this type of seed will enable Vilmorin to expand its presence in southern China and in new regions where the group has recently established a foothold: South America and Africa. Halfyear results are traditionally negative and thus not representative. These numbers do, however, offer insight into the full-year outlook, which is revised up. Guidance is for 2014 organic revenue growth of >+6% (+8.5% CM-CIC and +7% on the actual structure) vs +5%; the operating margin is unchanged at >10.5% (10.82% CM-CIC vs 10.77% in 2013). Target Price: EUR 114.00 85 80 Analyst(s) 75 70 Mar 11 Source : Factset 202 Jun 11 Sep 11 Dec 11 Mar 12 Jun 12 Sep 12 Dec 12 Mar 13 Jun 13 Sep 13 Dec 13 Mar 14 Jun 14 Francis Prêtre CM - CIC Securities +33 4 78 92 02 30 [email protected] Netherlands SMALL & MID CAPS SELECTION EUR 4.35 Accumulate WESSANEN BSWSc.AS/WES NA Market capitalisation: EUR 329m Food & Beverage EUR Sales (m) EBITDA (m) EBITDA margin EBIT (m) EBIT margin Net profit (reported) (m) Net profit (adj.) (m) Cash Flow from Ops.bef. chg in NWC (m) Net debt (Cash) (m) Net Debt/Equity Net Debt/EBITDA Interest cover (EBITDA/Fin. interest) ROCE (adj.) ROCE (adj.)/WACC EV / CE EV / Sales EV / EBITDA EV / EBIT P/E (adj.) P/BV OpFCF yield Dividend yield EPS (adj.) EPS (adj.) growth BVPS DPS Abs. Performances(12m,6m,3m,1m): 12 month High/low: EUR4.50 / 2.62 12/12 711 15.0 2.1% -45.8 nm -49.4 -53.0 22.2 54.9 0.5 3.7 high 8.7% 1.0 0.9 0.3 14.6 nm nm 1.5 5.4% 2.3% -0.70 -chg 1.46 0.05 52.1% 12/13 12/14e 12/15e 516 510 525 25.7 43.7 44.4 5.0% 8.6% 8.5% 11.9 32.5 33.2 2.3% 6.4% 6.3% 1.8 29.2 24.7 -4.5 22.3 23.2 12.2 34.4 34.4 50.7 29.1 9.2 0.5 0.2 0.1 2.0 0.7 0.2 high high high -1.6% 13.7% 14.2% -0.2 1.6 1.7 1.5 2.0 1.9 0.5 0.7 0.6 10.3 8.2 7.6 22.2 11.0 10.2 nm 14.8 14.2 2.0 2.6 2.3 7.1% 8.3% 8.3% 1.1% 1.6% 3.5% -0.06 0.29 0.31 +chg +chg 4.0% 1.39 1.65 1.89 0.05 0.07 0.15 51.6% 30.0% 8.5% Avg. Daily nb traded shares:155,875 Main shareholders: Free float 67.0%; Delta Partners 25.6%; Invesco 4.2%; Sparinvest 3.2%; All share prices at 19/05/14. Profile: Wessanen is a Netherlands-based food company operating mainly on the market for organic products in France, the Netherlands, the UK and Germany. Its organic products are distributed through supermarkets, specialty health food stores and through foodservice outlets. Wessanen recently announced to have sold its frozen snacks business IZICO to Egeria. In the US, Wessanen still owns the kids and pouches business called American Beverage Corporation. SWOT Analysis Strengths • Mid-sized position in European organic and natural products niche • Relationships with major retailers especially in France and the Netherlands • Strong brand names, especially Bjorg, Allos and Bonneterre • New CEO with hand-on approach Weaknesses • Poor strategy execution in the past Opportunities • Take advantage of growing organic food market Threats • Retailers developing own label ranges • Create further focus by divesting ABC • Disintermediation in wholesale • Consolidation opportunities in the European organic products market • Lower the cost base a bit further • Fast moving consumer goods companies moving into the category • Weak financial markets reputation • Product portfolio has too many small brands Recommendation: We rate Wessanen shares Accumulate with a target price of EUR 4.62. Our recommendation is based on 1) Wessanen’s positions on growth markets, 2) a new energetic CEO with hands-on approach, 3) a lower cost base and a lean organisation. 4) Sales growth rates have recently improved and we expect slightly better margins in the next few years, 5) This is in the Brands business, with a rationalized portfolio, 6) The divestment of ABC after the summer gives more focus, 7) An improved balance sheet with reduced risk. Based on a weighted average of DCF (50%) and sum-of-the-parts (50%), we calculate a target price of €4.62. Target Price: EUR 4.62 FINANCIAL CALENDAR (Source: Precise) PRICE (SHORT & LONG AVERAGE) • Failure to divest ABC business t i t re 4.5 4.0 WESSANEN SMALL & MID CAPS SELECTION Analyst(s) 3.5 3.0 Gerard Rijk 2.5 + 31 (0)20 550 8572 SNS Securities [email protected] 2.0 1.5 Mar 11 Jun 11 Sep 11 Dec 11 Mar 12 Jun 12 Sep 12 Dec 12 Mar 13 Jun 13 Sep 13 Dec 13 Mar 14 Jun 14 Source : Factset 203 Germany SMALL & MID CAPS SELECTION EUR 43.33 Buy WINCOR NIXDORF WING.DE/WIN GY Market capitalisation: EUR 1290m Software & Computer Services EUR Sales (m) EBITDA (m) EBITDA margin EBIT (m) EBIT margin Net profit (reported) (m) Net profit (adj.) (m) Cash Flow from Ops.bef. chg in NWC (m) Net debt (Cash) (m) Net Debt/Equity Net Debt/EBITDA Interest cover (EBITDA/Fin. interest) ROCE (adj.) ROCE (adj.)/WACC EV / CE EV / Sales EV / EBITDA EV / EBIT P/E (adj.) P/BV OpFCF yield Dividend yield EPS (adj.) EPS (adj.) growth BVPS DPS Abs. Performances(12m,6m,3m,1m): 12 month High/low: EUR58.07 / 39.90 09/12 2,343 174 7.4% 101 4.3% 62.6 103 180 199 0.6 1.1 18.9 10.6% 1.2 1.2 0.5 6.7 11.5 8.8 2.8 3.6% 3.5% 3.45 -0.8% 10.90 1.05 -1.9% 09/13 09/14e 09/15e 2,465 2,514 2,612 191 210 225 7.8% 8.4% 8.6% 132 150 164 5.3% 6.0% 6.3% 87.1 99.1 110 107 99.1 110 146 167 184 124 75.6 12.7 0.3 0.2 0.0 0.6 0.4 0.1 33.8 35.7 52.6 11.4% 11.1% 11.8% 1.3 1.3 1.4 1.7 1.5 1.4 0.6 0.6 0.5 8.2 7.0 6.3 11.9 9.8 8.6 12.8 13.0 11.8 3.6 3.0 2.6 5.6% 6.5% 7.9% 3.4% 3.9% 4.4% 3.60 3.33 3.68 4.4% -7.5% 10.7% 12.72 14.56 16.54 1.48 1.70 1.90 -11.2% -24.4% -9.2% Avg. Daily nb traded shares:155,056 Profile: Wincor Nixdorf (WIN) provides hardware and software solutions and related services for the segments Banking and Retail. It primarily manufactures a full range of cash dispensing machines and socalled electronic point of sale (EPOS) systems. Taking its growing outsourcing division into account, the company can be considered a full-solution provider. The client base includes almost all renowned key accounts in the afore-mentioned segments. Thanks to close collaboration with clients and innovation leadership, Wincor now has an outstanding position in the international arena after significant market share gains in recent years. Wincor is currently the European and German market leader in Retail. In Banking it is the domestic market leader and among the top players word-wide. SWOT Analysis Strengths • Strong history, high cash generative business model • Profit focused management, high shareholder orientation and attractive remuneration policy • Relatively high entry barriers at the upper end Weaknesses • Competition causes price decline of 6-8% p.a. in the hardware segment • High dependence upon two challenging sectors (Banking and Retail) • Generally low order visibility • Solid balance sheet with limited net debt • Low US market share Opportunities • Wincor could be take over target Threats • IT budgets remain under tight control • Banks could accelerate outsourcing • Banking (branch) consolidation could reduce market potential • Competition in low-end products • Retailers moving more capex into self-check-out • Wincor's cashless activities Main shareholders: Free float 89.6%; Own shares 10.4%; All share prices at 19/05/14. FINANCIAL CALENDAR (Source: Precise) PRICE (SHORT & LONG AVERAGE) titre 60 55 Recommendation: We are betting on a share price rebound and upgraded the stock to ‘Buy’ from ‘Accumulate’ recently on a less dramatic 1H13/14 reporting at second glance. We keep our DCF based PT of EUR 56 unchanged. Actually, we expected a mild profit warning (FY14e sales growth to be revised from 4% to 2% and a 3% lower EBIT) after a softer 2Q13/14 reporting and as fx as well as Russia and Turkey exposure hit (5-10% of sales). We believe however that the share price slump was overdone. EV/EBITDA'15e came down to 6.5x (EV/EBIT'15e to 8.9x). The P/E'15e is now at 12.3x. The dividend yield is around 4% and the operating free cash flow yield at a solid 7%. 50 Target Price: EUR 56.00 45 40 35 30 Analyst(s) 25 20 Mrz 11 Source : Factset 204 Jun 11 Sep 11 Dez 11 Mrz 12 Jun 12 Sep 12 Dez 12 Mrz 13 Jun 13 Sep 13 Dez 13 Mrz 14 Jun 14 Adrian Pehl, CFA Equinet Bank +49 69 58997 438 [email protected] Finland SMALL & MID CAPS SELECTION EUR 7.42 Hold YIT YTY1V.HE/YTY1V FH Market capitalisation: EUR 929m Materials, Construction & Infrastructure EUR Sales (m) EBITDA (m) EBITDA margin EBIT (m) EBIT margin Net profit (reported) (m) Net profit (adj.) (m) Cash Flow from Ops.bef. chg in NWC (m) Net debt (Cash) (m) Net Debt/Equity Net Debt/EBITDA Interest cover (EBITDA/Fin. interest) ROCE (adj.) ROCE (adj.)/WACC EV / CE EV / Sales EV / EBITDA EV / EBIT P/E (adj.) P/BV OpFCF yield Dividend yield EPS (adj.) EPS (adj.) growth BVPS DPS Abs. Performances(12m,6m,3m,1m): 12 month High/low: EUR15.55 / 7.05 12/12 0.0 20.6 nm 0.0 nm -56.7 -56.7 -35.0 616 0.8 29.9 1.5 0.0% 0.0 1.7 nm nm nm nm 2.4 -74.2% 5.1% -0.45 -chg 6.08 0.75 -51.7% 12/13 12/14e 12/15e 1,087 1,169 1,138 122 171 167 11.2% 14.7% 14.7% 104 160 156 9.6% 13.7% 13.7% 70.2 111 109 70.2 111 109 87.8 122 120 782 684 532 1.1 1.0 0.7 6.4 4.0 3.2 13.7 10.5 10.4 6.8% 11.1% 11.5% 0.8 1.3 1.3 1.3 1.1 1.0 1.9 1.3 1.2 16.6 9.2 8.5 19.3 9.8 9.1 18.1 8.4 8.6 1.8 1.3 1.2 -5.0% 20.4% 21.7% 5.1% 6.0% 6.2% 0.56 0.88 0.87 +chg 57.8% -2.0% 5.57 5.72 6.20 0.38 0.44 0.46 -21.3% -13.8% -2.8% Avg. Daily nb traded shares:189,234 Main shareholders: Free float 100.0%; Structor S.A. 12.1%; Varma Mutual Pension Insurance Co 6.1%; Mandatum Life 3.6%; All share prices at 19/05/14. Profile: YIT is one of the largest residential constructors in Europe. In Finland, YIT is the largest residential developer and in Russia and Eastern Europe it is the largest foreign housing construction company. Residential construction has good long-term demand prospects in Russia and Eastern Central Europe, where the rising standard of living allows expanding the small living space per person compared to the West. Development of mortgage markets also offers growth potential in Russia. Finnish housing demand is driven by rising urbanisation rate, which is seemingly below the other Nordic countries. SWOT Analysis Strengths • Strong market position Weaknesses • Cyclicality of the residential development business • Good track record of above-industry growth and profitability • Capital intensity of the development business • Unpredictability of the Russian economy Opportunities Threats • Rising interest rates especially in Finland • Economic growth and political stability in Russia • Sharp increase in Finnish unemployment • Increasing ROI to the over 20% target in International Construction Services • Turbulence in the Russian economy and politics Recommendation: In Finland, YIT is presently adjusting its production portfolio to demand which seems to have stabilised on a lower level. In fact, the outlook for Finnish household income growth appears poor. In the Finnish business, we expect that cash will start to flow in H2, which also gives some comfort to the share. Russia has performed well for now, as devaluation of the rouble has induced a flight from cash to real estate. However, household income there is pressured due to rising inflation and mortgage rates face upward pressure after central bank rate hikes. We therefore expect H2 to be challenging in Russia and the company is forced to cut back start-ups, which will have negative implications for future growth. FINANCIAL CALENDAR (Source: Precise) PRICE (SHORT & LONG AVERAGE) Target Price: EUR 7.50 titre 20 04/06/14 Analyst Meeting 18 YIT SMALL & MID CAPS SELECTION Analyst(s) 16 14 12 10 Matias Rautionmaa 8 6 Mar 11 Jun 11 Sep 11 Dec 11 Mar 12 Jun 12 Sep 12 Dec 12 Mar 13 Jun 13 Sep 13 Dec 13 Mar 14 +358 10 252 4408 Pohjola [email protected] Jun 14 Source : Factset 205 Spain SMALL & MID CAPS SELECTION EUR 2.59 Accumulate ZELTIA ZEL.MC/ZEL SM Market capitalisation: EUR 576m Biotechnology EUR Sales (m) EBITDA (m) EBITDA margin EBIT (m) EBIT margin Net profit (reported) (m) Net profit (adj.) (m) Cash Flow from Ops.bef. chg in NWC (m) Net debt (Cash) (m) Net Debt/Equity Net Debt/EBITDA Interest cover (EBITDA/Fin. interest) ROCE (adj.) ROCE (adj.)/WACC EV / CE EV / Sales EV / EBITDA EV / EBIT P/E (adj.) P/BV OpFCF yield Dividend yield EPS (adj.) EPS (adj.) growth BVPS DPS Abs. Performances(12m,6m,3m,1m): 12 month High/low: EUR2.99 / 1.51 12/12 138 20.4 14.8% 14.6 10.5% 6.6 3.7 20.3 79.2 2.0 3.9 4.0 11.1% 0.8 3.8 2.5 16.9 23.7 nm 6.3 8.6% 0.0% 0.02 -30.7% 0.19 0.00 64.4% 12/13 12/14e 12/15e 142 155 163 23.8 25.9 41.9 16.8% 16.7% 25.7% 19.0 20.4 36.0 13.4% 13.2% 22.1% 11.3 13.6 29.0 11.1 13.6 29.0 17.5 19.3 34.5 60.0 57.2 35.0 1.2 0.9 0.4 2.5 2.2 0.8 4.6 5.7 10.6 15.0% 14.4% 23.8% 1.1 1.1 1.8 6.4 6.3 5.7 4.0 4.1 3.7 23.9 24.3 14.5 30.0 30.9 16.9 46.1 42.4 19.8 9.4 8.4 5.9 4.9% 2.2% 5.6% 0.0% 0.0% 0.0% 0.05 0.06 0.13 199.1% 21.9% 113.6% 0.25 0.31 0.44 0.00 0.00 0.00 11.2% -3.7% 3.6% Avg. Daily nb traded shares:242,405 Main shareholders: Free float 72.0% (50.0%); Fernandez Sousa (family) 21.2%; Rosp Corunna 5.0%; Profile: Zeltia focuses on two different activities. One activity is the group’s biotech unit: a) Pharma Mar, specialised in marine derived anti-cancer drugs, b) Genomica (molecular diagnostics) and c) Sylentis (in Glaucoma). The other activity is chemicals: integrated by Zelnova (insecticides, air fresheners) and Xylazel (wood and metal protection) which produce the recurrent income, whose cash flow is almost completely invested in its biotec R&D. PharmaMar, the group’s key growth driver, currently commercialises Yondelis in Europe for the treatment of Advanced Soft Tissue Sarcoma and ovarian cancer. The company is running a P III trial with Yondelis in 1st Line STS. Besides, Janssen (J&J) is currently financing two P-III trials with Yondelis in the US: in STS and ovarian cancer, the first indication could open a window for Yondelis in the US market during 2015. Zeltia also counts with an important molecule in its pipeline, PM01183 (Lurbinectedin), orphan drug in platinum resistant/refractory ovarian cancer due to the promising PhII results in this indication will be presented during ASCO and ERS Congress this year. SWOT Analysis Strengths • Quality and uniqueness of its pipeline and marine compound library. • Low toxicity of products & long patent protection Weaknesses • Short experience commercialising compounds • Committed management • Current dependence in doxorrubicine for the commercialisation of Yondelis in Ovarian cancer • Weak financial situation (but improving) Opportunities • Out licensing of PM01183 Threats • Not approval of other compounds in the mid term • Sylentis’s pipeline • Adverse clinical trial results • Leverage on R&D (PM01183, Aplidin, Sylentis) • Need of higher investments vs. initially planned • Leveraging the commercial taskforce • Competition of new products All share prices at 19/05/14. FINANCIAL CALENDAR (Source: Precise) PRICE (SHORT & LONG AVERAGE) titre 3.0 2.8 2.6 2.4 Recommendation: We are currently reviewing our estimates and valuation with a positive stance. The potential out-license of PM01183 would imply the collection of an upfront payment of ca.EUR 50m). We keep the positive recommendation on the stock ahead of the intensive newsflow. Among short term drivers we highlight: 1) end Ph II results with PM01183 in platinum resistant/refractory ovarian cancer, relevant positive results should accelerate an out-license agreement 2) Yondelis’ potential approval in STS in the US market mid 2015. We rate the company buy, with TP EUR 3.3/sh. Target Price: EUR 3.30 2.2 2.0 1.8 1.6 1.4 Analyst(s) 1.2 1.0 Mar 11 Source : Factset 206 Jun 11 Sep 11 Dec 11 Mar 12 Jun 12 Sep 12 Dec 12 Mar 13 Jun 13 Sep 13 Dec 13 Mar 14 Jun 14 Ana Isabel González García CIIA BEKA Finance +34 91 436 78 09 [email protected] Small & Mid Caps Selection Price and country index charts Net profit Adj. (m) Current price: used to calculate ratio on current years plus estimated years. Simple yearly average of closing prices (weighted average price): used to calculate ratio on past years. Moving averages are used by numerous chartists and technical analysts as indicators of long- and medium-term trends. They define what are considered to be support (downside) and resistance (upside) levels. As it is not possible to standardise this calculation due to a level of subjectivity it deserves, this item is an analyst input. The adjustments made by the ESN analysts are related mainly to exclude Non Recurrent Items and Discontinued Operations (in the past the adjustments were related to extraordinary items and goodwill amortisation). Definitions and common abbreviations Cash flow Adj. (m) The company codes are from Reuters and Bloomberg. Highs/lows are based on closing prices. nm = not meaningful. Data items Sales (m) Published consolidated net sales, excluding other revenues EBITDA (m) EBITDA = Earnings Before Interest, Tax, Depreciation, Amortisation & Provisions. EBITDA is defined as operating result after operating exceptional items (e.g. restructuring costs, start-up costs, etc.), before Depreciation, Amortisation & Provisions, before Other Operating & Non Operating Expenses (Income), before Interest (also on pension provision for Germany), Associates, Non Recurrent Items & Tax. EBIT Reported (m) EBIT = Earnings Before Interest and Tax. EBIT is defined as operating result after Depreciation, Amortisation & Provisions, after Other Operating & Non Operating Expenses (Income), before Interest (also on pension provision for Germany), Associates, Non Recurrent Items & Tax. Net profit reported (m) Net Profit (Reported) = reported earnings after Non Recurrent Items, after Tax, after Minorities. Net Operating Cash Flow Adj. = Net Profit (adj.) + Minorities + Depreciation, Amortisation & Provisions + other non cash items. This item is Net Operating Cash Flow before Capital Expenditure and before change in NWC. Per share items Current and historic per share items are based on average outstanding ordinary shares. Estimated data are based on averagae diluted ordinary shares. Dilution (due to stock options, warrants, convertible bonds) as defined by the analyst, is always considered when expiration is within the year and in the money at the current price. EPS (Adj.) Earnings per share calculated as Net profit Adj. divided by the weighted average of the outstanding ordinary shares. Gross dividend per share (DPS) Dividend per Share Gross (before tax) calculated as total dividend divided by outstanding Ordinary shares. Book value per share (BVPS) Book value per share calculated as Shareholders’ Equity divided by outstanding number ordinary shares. Valuation Items P/E Adj. (x) Price/Earnings ratio: for historic years calculated as the fiscal year end date closing share price divided by EPS Adj. For current and future years calculated as the current share price divided by EPS Adj. 207 Small & Mid Caps Selection CAGR (Compound average growth rate) (%) Market value (MV) of Preferred Shares (m) Estimated % change in the normative growth rate of an item (i.e. EPS used to calculate PEG ratio). 4 years: last year + current + 2 estimate years (CAGR calculated on 4 years; 3 periods). For historic years calculated as the fiscal year average estimated MV of any preferred shares. For current and future years calculated as the current estimated MV of any preferred shares. Dividend yield (%) For historic years calculated as gross DPS divided by the fiscal year end date closing price. For current and future years calculated as gross DPS divided by the current share price. Price / BV (x) For historic years calculated as the fiscal year end date closing share price divided by BVPS. For current and future years calculated as the current share price divided by BVPS. Capital Employed (m) Capital Employed (or Capital Invested) =Net Fixed Tangible Assets + Net Fixed Intangible Assets (excluding Goodwill) + Goodwill + Net Financial Assets + Net Working Capital. ROCE Adj. (%) EBIT (adj.)*(1-normative tax rate)/ (Capital Employed.- Net Financial Assets) WACC Weighted average cost of capital. Total Market Cap. or Market Cap (adj.) (m) Mkt. cap. (m) + MV Pref. (m). EV Adj. (m) EV = Market cap. Adj. + net debt + off balance sheet items + Provisions (retirement and others related to future cash outs) + Minorities Equity (estimated market value) - Peripheral Assets (market value). EV Adj. / Sales EV Adj. (m) divided by Sales (m). EV Adj. / EBITDA EV Adj. (m) divided by EBITDA (m). This figure can be seen as an ‘operating P/E’. EV Adj. / Capital Employed EV Adj. (m) divided by Gross capital employed (m). Enterprise Value Ratios Market Capitalisation (Market Cap) (m) EPS Growth (%) For historic years calculated as the market capitalisation in millions as the fiscal year end date closing share price of the ordinary shares times the average amount of outstanding ordinary shares. For current and future years calculated as the market capitalisation in millions as the current share price of the ordinary shares times the current total amount of outstanding ordinary shares. 208 Growth in EPS (adj.) on an annual basis. Gearing (%) Net debt (m) divided by total equity (m). When negative this ratio shows cash. ESN Recommendation system The ESN Recommendation System is Absolute. It means that each stock is rated on the basis of a total return, measured by the upside potential (including dividends and capital reimbursement) over a 12 month time horizon. The ESN spectrum of recommendations (or ratings) for each stock comprises 5 categories: Buy, Accumulate (or Add), Hold, Reduce and Sell (in short: B, A, H, R, S). Furthermore, in specific cases and for a limited period of time, the analysts are allowed to rate the stocks as Rating Suspended (RS) or Not Rated (NR), as explained below. Meaning of each recommendation or rating: Buy: the stock is expected to generate total return of over 20% during the next 12 months time horizon Accumulate: the stock is expected to generate total return of 10% to 20% during the next 12 months time horizon Hold: the stock is expected to generate total return of 0% to 10% during the next 12 months time horizon. Reduce: the stock is expected to generate total return of 0% to -10% during the next 12 months time horizon Sell: the stock is expected to generate total return under -10% during the next 12 months time horizon Rating Suspended: the rating is suspended due to a capital operation (take-over bid, SPO, …) where the issuer of the document (a partner of ESN) or a related party of the issuer is or could be involved or to a change of analyst covering the stock Not Rated: there is no rating for a company being floated (IPO) by the issuer of the document (a partner of ESN) or a related party of the issuer ESN Ratings Breakdown Reduce Sell 1% 5% Buy 42% Hold 29% Accumulate 23% History of ESN Recommendation System Since 18 October 2004, the Members of ESN are using an Absolute Recommendation System (before was a Relative Rec. System) to rate any single stock under coverage. Since 4 August 2008, the ESN Rec. System has been amended as follow. Time horizon changed to 12 months (it was 6 months) Recommendations Total Return Range changed as below: TODAY SELL REDUCE -10% HOLD 0% ACCUMULATE 10% BUY 20% BEFORE SELL -15% REDUCE HOLD 0% ACCUMULATE 5% BUY 15% 209 Bank Degroof 44, rue de l’Industrie 1040 Brussels Belgium Phone: + 32 2 287 91 16 Fax: + 32 2 231 09 04 Investment Bank of Greece 32 Aigialeias Str & Paradissou, 151 25 Maroussi, Greece Tel: +30 210 81 73 383 European Securities Network LLP Registered office c/o Withers LLP 16 Old Bailey - London EC4M 7EG BEKA Finance Serrano, 39 28001 Madrid Spain Phone: +34 91 436 7813 Fax: +34 91 577 3770 CM - CIC Securities 6, avenue de Provence 75441 Paris Cedex 09 France Phone: +33 1 4596 7940 Fax: +33 1 4596 7748 Pohjola Bank plc P.O.Box 308 FI- 00013 Pohjola Finland Phone: +358 10 252 011 Fax: +358 10 252 2703 Disclaimer: These reports have been prepared and issued by the Members of European Securities Network LLP (‘ESN’). ESN, its Members and their affiliates (and any director, officer or employee thereof), are neither liable for the proper and complete transmission of these reports nor for any delay in their receipt. Any unauthorised use, disclosure, copying, distribution, or taking of any action in reliance on these reports is strictly prohibited. The views and expressions in the reports are expressions of opinion and are given in good faith, but are subject to change without notice. These reports may not be reproduced in whole or in part or passed to third parties without permission. The information herein was obtained from various sources. ESN, its Members and their affiliates (and any director, officer or employee thereof) do not guarantee their accuracy or completeness, and neither ESN, nor its Members, nor its Members’ affiliates (nor any director, officer or employee thereof) shall be liable in respect of any errors or omissions or for any losses or consequential losses arising from such errors or omissions. Neither the information contained in these reports nor any opinion expressed constitutes an offer, or an invitation to make an offer, to buy or sell any securities or any options, futures or other derivatives related to such securities (‘related investments’). These reports are prepared for the clients of the Members of ESN only. They do not have regard to the specific investment objectives, financial situation and the particular needs of any specific person who may receive any of these reports. Investors should seek financial advice regarding the appropriateness of investing in any securities or investment strategies discussed or recommended in these reports and should understand that statements regarding future prospects may not be realised. Investors should note that income from such securities, if any, may fluctuate and that each security’s price or value may rise or fall. Accordingly, investors may receive back less than originally invested. Past performance is not necessarily a guide to future performance. Foreign currency rates of exchange may adversely affect the value, price or income of any security or related investment mentioned in these reports. In addition, investors in securities such as ADRs, whose value are influenced by the currency of the underlying security, effectively assume currency risk. ESN, its Members and their affiliates may submit a pre-publication draft (without mentioning neither the recommendation nor the target price/fair value) of its reports for review to the Investor Relations Department of the issuer forming the subject of the report, solely for the purpose of correcting any inadvertent material inaccuracies. Like all members employees, analysts receive compensation that is impacted by overall firm profitability For further details about the specific risks of the company and about the valuation methods used to determine the price targets included in this report/note, please refer to the latest relevant published research on single stock. Research is available through your sales representative. ESN will provide periodic updates on companies or sectors based on company-specific developments or announcements, market conditions or any other publicly available information. Unless agreed in writing with an ESN Member, this research is intended solely for internal use by the recipient. Neither this document nor any copy of it may be taken or transmitted into Australia, Canada or Japan or distributed, directly or indirectly, in Australia, Canada or Japan or to any resident thereof. This document is for distribution in the U.K. Only to persons who have professional experience in matters relating to investments and fall within article 19(5) of the financial services and markets act 2000 (financial promotion) order 2005 (the “order”) or (ii) are persons falling within article 49(2)(a) to (d) of the order, namely high net worth companies, unincorporated associations etc (all such persons together being referred to as “relevant persons”). This document must not be acted on or relied upon by persons who are not relevant persons. Any investment or investment activity to which this document relates is available only to relevant persons and will be engaged in only with relevant persons. The distribution of this document in other jurisdictions or to residents of other jurisdictions may also be restricted by law, and persons into whose possession this document comes should inform themselves about, and observe, any such restrictions. By accepting this report you agree to be bound by the foregoing instructions. You shall indemnify ESN, its Members and their affiliates (and any director, officer or employee thereof) against any damages, claims, losses, and detriments resulting from or in connection with the unauthorized use of this document. For additional information and individual disclaimer please refer to www.esnpartnership.eu and to each ESN Member websites:
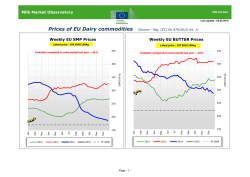


© Copyright 2026