
Print this article - Indian Journal of Science and Technology
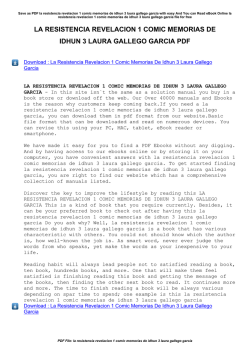
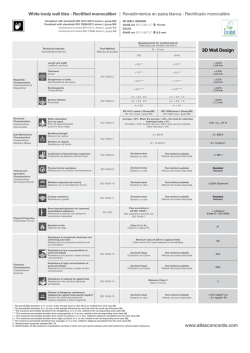
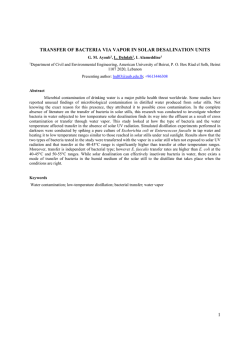
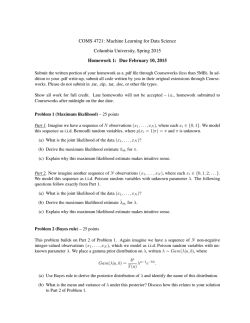
Indian Journal of Science and Technology, Vol 9(46), DOI: 10.17485/ijst/2016/v9i46/107379, December 2016 ISSN (Print) : 0974-6846 ISSN (Online) : 0974-5645 Predicting of Behavior of Escherichia Coli Resistance to Imipenem and Meropenem, using a Simple Mathematical Model Regression Amelec Viloria1*, Myrna Campo Urbina2, Lucila Gómez Rodríguez2 and Alexander Parody Muñoz3 Universidad de la Costa, Barranquilla, Colombia; [email protected] Universidad Metropolitana, Barranquilla, Colombia; [email protected], [email protected] 3 Universidad Autónoma del Caribe, Barranquilla, Colombia; [email protected] 1 2 Abstract Objectives: To determine the trend of bacterial resistance of Escherichia coli to Imipenem (IPM) and Meropenem (MEM), by means of a linear regression model, taking the information collected in the bulletins of bacterial resistance generated by the GREBO group of Bogotá between 2010 and 2014. Methods/Statistical Analysis: From the information published in newsletters GREBO group between 2010 and 2014, the behavior of E. coli bacterial resistance to antibiotics was analyzed. From this information simple linear regression models using the statistical software Statgraphics XVI were generated. Findings: The generated mathematical models to predict the evolution of antibiotic resistance as a function of time and that were significant are: Resistance IPM * Year = 0.00000208772 (p value 0.0020; adjusted R2 = 92.86%); Resistance MEM = 0.00000149115 * Year (p value 0.0026; adjusted R2 = 91.84%). Application/Improvements: There is a relationship between the values of resistance and over the years, with variable time sufficient to explain the behavior of the resistance of E. coli variable. In 2015 IPM resistance is estimated that this in 0.42% (CI 0.02% - 0.8%) and MEM 0.3% (CI 0.17% 0.42%). Keywords: Bacterial Drug Resistance, Escherichia Coli, Imipenem and Meropenem, Linear Regression Model 1. Introduction The investigation of bacterial resistance has become increasingly important as listed multiresistant bacteria to antibiotics; its dynamics has been studied in hospitals from its epidemiological behavior, including: Frequency of service isolation, infection, morbidity and mortality rates associated the latter with increasing care costs. In its molecular, intra- or extra-chromosomal appearance of genomic sequences confer different degrees of her resistance to different types of antibiotics, among other aspects; complexity requires a multidisciplinary approach1,2. On the other hand regression models become mathematical tools describing significant differences between the percentages of resistance thrown every year in addi*Author for correspondence tion to setting the linearity and sense of increase3–10. In this regard it is considered, the role they can play the exact sciences in the analysis of the evolution of bacterial resistance so that it can effectively control antimicrobial therapy. Therefore regression models constitute an innovative tool to project the behavior and measure the growth of resistance over the years and point out Humberto Gutierrez and Roman de la Vara, in his book designs experiments: “The regression analysis aims to model mathematically the behavior of a response variable based on one or more independent variables (factors)”11 made it possible to study the behavior of bacterial resistance through the passing years. Predicting of Behavior of Escherichia Coli Resistance to Imipenem and Meropenem, using a Simple Mathematical Model Regression Taking as reference data resistance surveillance published by the GREBO group (Group for the Control of Antimicrobial Resistance in Bogotá), in their newsletters12–16 a database that brings together 13 years of experience in monitoring bacterial resistance, which ensures the quality and consistency of the information used for the proposed methodology. The research project is proposed which aims to formulate a mathematical regression model, which allows to analyze the behavior of the resistance of Klebsiella pneumoniae to antibiotics over time and set itself the versatility of the phenomenon is due to a substantial change in resistance or failing is the result of the inherent variability in sampling processes, typical of studies that seek to calculate the percentage of resistance. That is why the use of this specific model, which explains the statistical trend and resistance E. coli versus imipenem and meropenem, becomes a high impact strategy on monitoring plans and monitoring of bacterial resistance, in order to control the increase and therefore assess whether the actions that health institutions done to control it are effective or not. 2. Materials and Methods Based on the bulletins published by the GREBO group (Group for the Control of Antimicrobial Resistance in Bogotá) surveillance and resistance. coli since 2010201412–16 the data for antibiotic Imipenem (IPM) and Meropenem (MEM) were selected to generate a simple regression model that accounts and estimate the trend in the behavior of the resistance of this bacterium against the chosen antibióticoa, the application of regression models become an interesting tool for evaluating strategies for the monitoring and surveillance of resistance of this bacterium. is significant enough a model of simple linear regression was generated for both antibiotics resistance, in which using the software Statgraphics statistical XVI the following results were obtained for resistance to IPM regarding the significance and model adequacy (Figure 1). Table 1. Behavior resistance against E. coli IPM and MEM 2010-2014 E. coli Imipenem Meropenem Yers Rate of resistance Rate of resistance 2010 0,3% 0,2% 2011 0,4% 0,4% 2012 0,5% 0,3% 2013 0,3% 0,2% 2014 0,6% 0,4% The constant model was withdrawn because it was not significant (p value 0.28), after removing the constant model presented a p-value of 0.0020 thus it can be concluded that there is relationship between values resistance and over the years, plus the fact that the R Square is above 80% (92.86%) indicates that time is a variable enough to explain the behavior of the resistance of the E. coli. Since the Pearson correlation coefficient was 0.96, indicates that the behavior and resistance E. coli is highly linked to the passage of years, the fact that the Pearson coefficient is positive tells us that the relationship is directly proportional, the mathematical model relating the two variables was as follows: IPM = 0.00000208772 resistance * Year The fact that the coefficient is positive indicates that as the years increases bacterial resistance increases, in fact for reporting this 2015 is expected that the resistance is between 0.02% and 0.8% as minimum and maximum values, with an expected value of 0.42%. 3. Results and Discussion To analyze the behavior of E. coli bacterial resistance between 2010 and 2014 (5 years of study) information of bacterial resistance presented by this organism in the reports GREBO Group took Bogota, obtaining the following information: A tendency to rise is evidence alone except for the year 2013 for IPM and in the case of MEM this exception was in 2012 and 2013, but to determine whether this trend 2 Vol 9 (46) | December 2016 | www.indjst.org Figure 2. IPM model residuals vs. the independent variable. Indian Journal of Science and Technology Amelec Viloria, Myrna Campo Urbina, Lucila Gómez Rodríguez and Alexander Parody Muñoz Simple regression - IPM vs. Resistance Year Dependent variable: Resistance IPM Independent variable: Year Linear: Y = b * X coefficients Least Squares Standard Statistical Parameter Estimate Error T Value-P Pending 2,0877E-06 2,89E-07 7,21485 0,002 Variance analysis Source Gl Square Medium Reason-F Value-P 52,05 0,002 Sum of Squares Model 8,8221E-05 1 8,8221E-05 Residue 6,7792E-06 4 1,6948E-06 Total 0,000095 5 Correlation coefficient= 0,96366 R-squared = 92,864 % R-squared (adjusted for G. L.) = 92,864 % Figure 1. Analysis of variance for resistance to IPM, both for the model and for variable time, and the percentage of explanation of the variability in resistance to IPM that has the model. Figure 3. IPM model residuals versus predicted values. Gráfico de Residuos Resistencia IPM = 0,00000208772*Año (X 0,0001) 20 residuo 10 0 -10 -20 0 1 2 número de fila 3 4 5 Figure 4. IPM model residuals versus predicted values. The model successfully overcame residue tests which validate the trust of the same, showing the behavior of a Vol 9 (46) | December 2016 | www.indjst.org normal distribution (p value 0.96) with an average forecast error - 0.00000049, besides presenting homoscedasticity of variance residues relative to the predicted values, values of years used and the row number: Regarding resistance Meropenem the following results were obtained with respect to the significance and sufficiency model: As with IPM constant model for resistance to MEM was withdrawn because it was not significant (p value 0.60), after removing the constant model presented a p-value of 0.0026 so it can be concluded that there is relationship between the values of resistance and over the years, plus the fact that the R Square is above 80% (91.84%) indicates that time is a variable enough to explain the behavior of the resistance of E. coli. Since the Pearson correlation coefficient was 0.95, indicates that the behavior of the resistance of E. coli is highly linked to the passage of years, the fact that the Pearson coefficient is positive tells us that the relationship is directly proportional, the mathematical model relating the two variables was as follows: Resistance MEM = 0.00000149115 * Year Indian Journal of Science and Technology 3 Predicting of Behavior of Escherichia Coli Resistance to Imipenem and Meropenem, using a Simple Mathematical Model Regression Simple regression - IPM vs. Resistance Year Dependent variable: Resistance IPM Independent variable: Year Linear: Y = b * X coefficients Least Squares Standard Statistical Parameter Estimate Error T Value-P Pending 1,4912E-06 2,22E-07 6,71364 0,0026 Variance analysis Source Sum of Squares Gl Square Medium Reason-F Value-P Model 4,5006E-05 1 4,5006E-05 45,07 0,0026 Residue 3,9941E-06 4 9,99E-07 Total 0,000049 5 Correlation coefficient= 0,958378 R-squared = 91,8489 % R-squared (adjusted for G. L.) = 91,8489 % Figure 5. Analysis of variance for resistance to MEM for both the model and for variable time, and the percentage of explanation of the variability in resistance MEM having the model. between 0.17% and 0.42% as minimum and maximum values, with an expected value of 0.30%. The model successfully overcame residue tests which validate the trust of the same, showing the behavior of a normal distribution (p value 0.93) with an average forecast error -0.00000019, besides presenting homoscedasticity of variance residues relative to the predicted values, values of years used and the row number: Figure 6. IPM model residuals vs. the independent variable. Gráfico de Residuos Resistencia MEM = 0,00000149115*Año (X 0,0001) 12 8 residuo 4 0 -4 -8 -12 0 1 2 número de fila 3 4 5 Figure 8. IPM model residuals versus predicted values. 4 Figure 7. IPM model residuals versus predicted values. 4. Conclusion The fact that the coefficient is positive indicates that as the years increases bacterial resistance increases, in fact for reporting this 2015 is expected that the resistance is The generation of the two models of simple regression allowed evidence that the design of the resistance to IPM and MEM is going to increase, since both coefficients Vol 9 (46) | December 2016 | www.indjst.org Indian Journal of Science and Technology Amelec Viloria, Myrna Campo Urbina, Lucila Gómez Rodríguez and Alexander Parody Muñoz accompanying the time variable are positive, noting in passing that the short-term projection is to increase resistance to these two antibiotics, these coefficients can be identified as the starting point of comparison when evaluating strategies that apply from now on to achieve reduced resistance of the E. coli before the antiobioticos already mentioned, as they can be generated again models and evaluate the change of on the slopes of the regression models and so to conclude whether the tendency to grow increased, or remains the same, or if instead begins to decrease. 5. Conflicts of Interests All authors have none to declare 6. References 1. Cortés JA, González L. Revisión sistemática de la farmacorresistencia en enterobacterias de aislamientos hospitalarios en Colombia. Biomédica. 2014; 34(2):180–97. Available from: http://dx.doi.org/10.7705/biomedica.v34i2.1550 2. Echeverri LM, Correa JCC. Klebsiella pneumoniae como patógeno intrahospitalario: Epidemiología y resistencia. IATREIA. 2010; 23(3):240–9. 3. Amaya N. Resistencia bacteriana en unidad de cuidados intensivos adultos de la clínica medilaser, neiva-colombia, entre enero y diciembre de 2008. Revista Facultad de Salud. 2009; 1(2):31–7. 4. Briceño D, Correa A, Valencia C, Torres J, Pacheco R, Montealegre M, et al. Actualización de la resistencia a antimicrobianos de bacilos Gram negativos aislados en hospitales de nivel III de Colombia: años 2006, 2007 y 2008. Biomédica. 2010; 30(3):371–81. 5. Espinoza C, Cortes J, Castillo J, y Leal A. Revisión sistemática de la resistencia antimicrobiana en cocos Gram positivos intrahospitalarios en Colombia. Biomédica. 2011; 31(1):27–34. Vol 9 (46) | December 2016 | www.indjst.org 6. Gonzalez L, y Cortes J. Revisión sistemática de la farmacorresistencia en enterobacterias de aislamientos hospitalarios en Colombia. Biomédica. 2014;34(2):180–97. 7. Hernandez-Gomez C, Blanco V, Motoa G, Correa A, Maya J, y Cadena E, et al. Evolución de la resistencia antimicrobiana de bacilos Gram negativos en unidades de cuidados intensivos en Colombia. Biomédica. 2014; 34 (Suplemento 1):91–100. 8. Maldonado N, Munera M, Lopez J, Sierra P, Robledo C, y Robledo J. Tendencia de la resistencia a antibióticos en Medellín y en los municipios del área metropolitana entre 2007 y 2012: resultados de seis años de vigilancia. Biomédica. 2014; 34(3):433–46. 9. Buitrago E, Hernandez C, Pallares C, Pacheco R, Hustardo K, y Recalde M. Frecuencia de aislamiento microbiológicos y perfil de resistencia bacteriana en 13 clínicas y hospitales de alta complejidad en Santiago de Cali – Colombia. Infectio. 2014; 18(1):3–11. 10. Rodriguez-Noriega E, Leon-Garnica G, Petersen-Morfin S, Perez-Gomez H, Gonzalez-Diaz E, y Morfin-Otero R. La evolución de la resistencia bacteriana en México, 1973 – 2013. Biomédica. 2014; 34 (Suplemento 1):181–90. 11. Humberto H, De La Vara R. Análisis y Diseño de Experimentos. Segunda edición. Mexico: McGraw-Hill; 2007. p. 545. 12. Grebo G. Resultados de los análisis de la cohorte de Klebsiella pneumoniae. Boletín Informativo GREBO. 2010; 2:6–23. 13. Grebo G. Análisis de la vigilancia de la Resistencia bacteriana año 2010. Componente pediátrico y adulto. Boletín Informativo GREBO. 2011; 3:7–8. 14. Grebo G. Análisis de la vigilancia de la Resistencia bacteriana año 2011. Componente pediátrico y adulto. Boletín Informativo GREBO. 2012; 4:5–14. 15. Grebo G. Análisis de la vigilancia de la Resistencia bacteriana año 2012. Componente pediátrico y adulto. Boletín Informativo GREBO. 2013; 5:4–23. 16. Grebo G. Análisis de la vigilancia de la Resistencia bacteriana año 2013. Componente pediátrico y adulto. Boletín Informativo GREBO. 2014; 6:5–19. Indian Journal of Science and Technology 5


© Copyright 2026