
Commonwealth of Puerto Rico Fiscal Plan
Commonwealth of Puerto Rico Fiscal Plan
October 14, 2016
Disclaimer
The Puerto Rico Fiscal Agency and Financial Advisory Authority (“AAFAF”), the Commonwealth of Puerto Rico (the “Commonwealth”), the
Government Development Bank for Puerto Rico (“GDB”), and each of their respective officers, directors, employees, agents, attorneys,
advisors, members, partners or affiliates (collectively, with AAFAF, the Commonwealth and GDB, the “Parties”) make no representation or
warranty, express or implied, to any third party with respect to the information contained herein and all Parties expressly disclaim any such
representations or warranties.
The Parties do not owe or accept any duty or responsibility to any reader or recipient of this presentation, whether in contract or tort, and shall
not be liable for or in respect of any loss, damage (including without limitation consequential damages or lost profits) or expense of
whatsoever nature of such third party that may be caused by, or alleged to be caused by, the use of this presentation or that is otherwise
consequent upon the gaining of access to this document by such third party.
This document does not constitute an audit conducted in accordance with generally accepted auditing standards, an examination of internal
controls or other attestation or review services in accordance with standards established by the American Institute of Certified Public
Accountants or any other organization. Accordingly, the Parties do not express an opinion or any other form of assurance on the financial
statements or any financial or other information or the internal controls of the Commonwealth and the information contained herein.
Any statements and assumptions contained in this document, whether forward-looking or historical, are not guarantees of future performance
and involve certain risks, uncertainties, estimates and other assumptions made in this document. The economic and financial condition of the
Commonwealth and its instrumentalities is affected by various financial, social, economic, environmental and political factors. These factors
can be very complex, may vary from one fiscal year to the next and are frequently the result of actions taken or not taken, not only by the
Commonwealth and its agencies and instrumentalities, but also by entities such as the government of the United States. Because of the
uncertainty and unpredictability of these factors, their impact cannot be included in the assumptions contained in this document. Future
events and actual results may differ materially from any estimates, projections, or statements contained herein. Nothing in this document
should be considered as an express or implied commitment to do or take, or to refrain from taking, any action by AAFAF, the Commonwealth,
GDB, or any government instrumentality in the Commonwealth or an admission of any fact or future event. Nothing in this document shall be
considered a solicitation, recommendation or advice to any person to participate, pursue or support a particular course of action or
transaction, to purchase or sell any security, or to make any investment decision.
By accepting this document, the recipient shall be deemed to have acknowledged and agreed to the terms of these limitations.
This document may contain capitalized terms that are not defined herein, or may contain terms that are discussed in other documents or that
are commonly understood. You should make no assumptions about the meaning of capitalized terms that are not defined, and you should
consult with advisors of AAFAF should clarification be required.
The following does not express any opinion or contain any analysis as to the priority or validity of the debt or any purported security interest
described herein and therefore is without prejudice to any legal or other argument that may now or in the future be asserted by the
Commonwealth or any of its instrumentalities in any legal or other proceeding.
1
Table of Contents
I.
Executive Summary..........................................................................................Page 3
II. Core Principles of the Fiscal Plan....................................................................Page 14
A.
Minimize Impact of Austerity on Economic Growth
B.
Improve Budgetary Controls and Financial Transparency
C.
Rationalize Expenditures and Tax Policy to Promote Efficiency
D. Enact Structural Economic Measures and Invest in Growth
E.
Protect Vulnerable Stakeholders
F.
Create a Sustainable Debt Level That Allows for Growth
G. Partner with the Federal Government to Generate Growth
III. Fiscal Plan Projections ...................................................................................Page 79
IV. Footnotes........................................................................................................Page 94
V. Appendix – Additional Detail on Fiscal Plan Projections.................................Page 96
VI. Additional Information Provided Separately
A. Additional Detail on Bonded Debt Stock
B.
Summary of Creditor Negotiations To Date
2
Executive Summary
3
Introduction
The Commonwealth of Puerto Rico (the “Commonwealth” or “Puerto Rico”) has experienced
a persistent fiscal and economic crisis for the last decade, despite taking proactive steps to
close its budgetary gaps and generate economic growth
Puerto Rico’s GDP has contracted for nine of the last ten years in real terms, driven by the expiration of incentives provided
under Section 936 of the U.S. tax code and the U.S. financial crisis, and exacerbated by outmigration and extraordinary
austerity measures taken by the Commonwealth
The extraordinary austerity measures taken in the last decade include:
Reducing government consumption by 12% in real terms from 2006 through 2015(1)
Reducing public administration headcount by approximately 24%(2)
Reducing or deferring critical capital expenditures
Delaying tax refunds and vendor payments
Implementing significant new revenue measures, including recent sales and petroleum products tax increases generating
approximately $1.4 billion annually
Depleting liquidity and undertaking extraordinary short-term borrowings from pension and insurance systems
Reforming pensions, converting defined benefit plans to defined contribution plans
These austerity measures have not been enough to eliminate deficits, which led to significant deficit financing and a ballooning
debt load during the period. Economic decline has also persisted, driving emigration to the U.S. mainland, as evidenced by
Puerto Rico’s population declining by 9% over the decade
In 2015, based on the work of a team led by former IMF First Deputy Managing Director Anne Krueger, the Commonwealth
determined that a broad debt restructuring was necessary
The Commonwealth commenced an effort to consensually renegotiate its debts based on a detailed Fiscal and Economic Growth
Plan (“FEGP”) but such negotiations have, to date, not resulted in a definitive agreement with its creditors
PROMESA was enacted in mid-2016 to provide Puerto Rico with the tools necessary to address its fiscal and economic crisis
This Fiscal Plan is being presented pursuant to PROMESA and is the first step toward a permanent resolution of the
Commonwealth’s ongoing crisis
This Fiscal Plan identifies the resources available to support basic governmental services and promote growth; a specific
debt restructuring proposal will be provided after receipt of input from the Oversight Board, as described further herein
(1)
(2)
U.S. Bureau of Labor Statistics, Seasonally Adjusted Government Employment. Represents state and local government employees.
Puerto Rico Planning Board. GDB Statistical Appendix – Table 3: Gross National Product in Constant 1954 Dollars. Government Consumption Expenditures.
4
Under Current Laws and Policies, Puerto Rico Will Have a Significant Financing Gap
Puerto Rico projects a cumulative shortfall of revenues as compared to expenditures (a
“financing gap”) of approximately $59 billion over the next ten years (the “Base Financing
Gap” or the “Base Projections”)
The Commonwealth’s current revenues are not sufficient to support existing current operations and debt service, despite the
Commonwealth’s recent extraordinary efforts to close the financing gap. Three approaching fiscal cliffs, with an estimated ten year
cumulative impact of $35.3 billion, will only further exacerbate the current crisis:
1. The depletion of Affordable Care Act (“ACA”) funds, which is estimated to occur in fiscal year (“FY”) 2018
2. The estimated loss of tax revenues from the conversion of Act 154 excise tax to a modified source income rule in FY 2018
3. The depletion of liquid assets in the retirement systems, expected to occur on or before FY 2018, will require increased
contributions to the pension systems to avoid an interruption of benefit payments
In addition, based on current policies and macroeconomic trends, economic contraction is expected to continue at an average rate of
approximately 1.7% per year, resulting in an increase to the financing gap of $5.5 billion over the next decade as compared to a case
in which the economy experiences 0% real growth(1)
The size of the financing gap detailed below assumes no measures are taken to fill the gap; if the Commonwealth were forced to only
pursue austerity-type measures to address this shortfall, it is estimated real GDP contraction would intensify
Summary of Cumulative “Financing Gap” Under Current Laws and Policies from FY 2017 to FY 2026 ($ millions) (2)
$30,000
$20,000
$17,023
$10,000
–
($10,000)
($20,000)
($34,967)
($17,944)
($30,000)
($16,141)
($40,000)
($50,000)
($60,000)
Based on Flat Real GDP
Base Revenue Before ACA, 154 Losses and Economic Contraction
Base Expenses Before Debt Serv. and Incr. Pension Contribution Req. by Current Law
Base Financing Gap Pre-Debt Serv. and Fiscal Cliffs
($70,000)
Base Fin. Surplus PreDebt Serv. and Fiscal
Cliffs
(1)
(2)
(3)
(4)
(5)
(3)
Debt Service
Base Fin. Gap Post Debt
Serv., Pre-Fiscal Cliffs
10 Yr
$202,043
(185,020)
$17,023
Loss of ACA Funding
($8,177)
($10,993)
($5,460)
Act 154 Losses
Incremental Pension Est. Impact of Economic
(5)
Contributions Req. by
Contraction
(4)
Current Law
($58,716)
Base Fin. Gap
Inflation is illustratively held constant under both real growth assumptions at an average rate of 1.8% from 2018 to 2026.
Base Projections shown correspond to the revenues and expenses only of those entities included in the Fiscal Plan presented herein. See the "Fiscal Plan Projections" for greater details on entities included in the Plan.
Note that for illustrative purposes, debt service excludes loans from GDB and certain bonded indebtedness of Commonwealth entities held by GDB. Numbers also include past due amounts and are net of debt service reserves.
Incremental contributions represent the Annual Additional Contributions (“AAC”) required to be paid to the Teachers and Judicial Retirement Systems and the Additional Uniform Contribution (“AUC”) required to be paid to the Employees
Retirement System based on estimates provided by the Commonwealth’s actuaries incorporating updated assumptions regarding items such as changes in the size of the active membership and future payroll assumptions consistent with the
Fiscal Plan. The amount shown includes payments of certain past-due amounts from previous years, as such amounts are assumed to have been paid in work performed by the actuaries.
Estimated impact of economic contraction corresponds to the estimated impact of real GDP growth going from 0% to an average of negative 1.7% from FY 2018 and FY 2026.
5
To Address the Base Financing Gap and Restore Economic Growth, the
Commonwealth Must Adhere to the Following Seven Principles
After a decade of recession, Puerto Rico’s economy must grow for the government to provide essential services
to the 3.5 million Americans living in Puerto Rico, as well as to support a sustainable debt burden. Without
economic growth, any level of debt service will be unsustainable and Puerto Rico will continue to face fiscal and
economic crises
The past decade’s material austerity measures, ranging from layoffs to tax increases, have not abated the
Commonwealth’s fiscal and economic crisis. Further austerity will only exacerbate outmigration and
accelerate the Commonwealth’s economic decline
Minimize Impact
1
of Austerity on
Economic
Growth
2
Improve
Budgetary
Controls and
Financial
Transparency
The Commonwealth’s Fiscal Plan ensures that critical fiscal discipline does not come at the expense of
long-term economic growth
Puerto Rico has experienced persistent deficits, routinely overestimating revenue and failing to control
spending
New rules and regulations must be implemented to enforce budgetary discipline, including improving
recently instituted third-party revenue validation, budgeting in compliance with GAAP, mandating all
spending to be approved through the annual budgetary process and improving regular budgetary
reporting and tracking
The Commonwealth’s ability to properly monitor its fiscal position is hindered by obsolete financial,
accounting and payroll systems. This, in turn, impedes informed decision-making and the ability to
publish timely financial statements
To correct this, Puerto Rico must invest in new IT infrastructure, reform financial reporting processes
and centralize treasury functions
Finally, Puerto Rico must improve its regular economic and statistical reporting to enhance long-term
economic forecasting and tracking. Multi-year budgeting that reflects long-term economic forecasts
should be required
6
To Address the Base Financing Gap and Restore Economic Growth, the
Commonwealth Must Adhere to the Following Seven Principles (cont’d)
3
Rationalize
Expenditures
and Tax Policy
to Promote
Efficiency
While further austerity is not the solution, the Commonwealth must stabilize its revenue base, improve its
revenue collections, and rationalize expenditures. The selection and structure of any fiscal measures, and the
timing of their implementation, must be designed to foster long-term growth and minimize negative
economic effects
The Fiscal Plan should focus on efficiency gains by prioritizing tax enforcement, consolidating agencies with
overlapping functions and underutilized schools, further centralizing procurement to create economies of
scale, reducing workforce through retirement and attrition, and eliminating automatic expenditure increases
where there is no demonstrated need. Savings due to such efficiency gains should be reinvested to promote
growth
The Fiscal Plan should also reform tax policy, including to transition the taxation of multinationals away
from the Act 154 excise tax in a manner that minimizes the impact on the Commonwealth’s revenue base
4
Enact
Structural
Economic
Measures and
Invest in
Growth
5
Protect
Vulnerable
Stakeholders
Although Puerto Rico does not control U.S. federal policies that have a significant impact on its economy, the
Fiscal Plan must implement structural reforms within Puerto Rico’s control. Overhauls are needed to local
policies to boost labor participation and productivity and create a business-friendly environment and attract
private investment
The Plan includes investment to maintain existing infrastructure and invest in strategic growth-promoting
projects. Public-private partnerships must be leveraged to achieve efficiency gains
The government must also catch-up on past-due payments to businesses and taxpayers, and build minimum
liquidity reserves to ensure government stability, another necessary predicate to growth
Shocks to Puerto Rico’s most vulnerable constituencies, including the elderly, young, disabled and lowincome residents, are likely to have a higher negative multiplier effect on the island’s already weak economy
Nearly half the island’s population lives in poverty and relies on a public healthcare system overburdened by
inequitable treatment under U.S. healthcare laws. Cuts to the system, even in the face of reductions in federal
transfers, would leave Puerto Rico residents without access to healthcare and promote outmigration and
further economic decline.
The underperformance of local schools, together with crime rates that remain higher than the U.S. states,
suggest investments in education and public safety must also be protected
Public pension plans must be adequately funded. The plans must build on prior reforms and ensure the
payment of an already meager average benefit that is only 53 percent of the average U.S. state
The Fiscal Plan must also protect credit union depositors, who are generally low-income, as well as the
cooperative banking system in general, subject to recapitalization plans and effective governance reforms
7
To Address the Base Financing Gap and Restore Economic Growth, the
Commonwealth Must Adhere to the Following Seven Principles (cont’d)
Without a substantial debt restructuring resulting in a sustainable debt burden, Puerto Rico’s growth potential
will continue to be hindered by the fear of future defaults, lower public and private investment and further
outmigration
6
Create a
Sustainable
Debt Level
That Allows
for Growth
The sustainability of the debt burden must rely on objective criteria and realistic growth and fiscal
assumptions. The Fiscal Plan must provide the island with sufficient breathing space to guarantee the provision
of essential services, to implement smart, pro-growth fiscal and economic policies and to invest in its economy
The restructuring plan must also offer a holistic solution for the Commonwealth’s tax-supported debt burden,
which is reliant on the single Commonwealth economy. Individual restructurings would be extremely
challenging given the interrelatedness of holders, insurers and sources of credit support. Accordingly, the Fiscal
Plan includes the tax-supported central government agencies and component units, including those identified
by the Oversight Board for inclusion in the Fiscal Plan(1)
Finally, the debt proposal must include restrictions on the issuance of new indebtedness, including limitations
on the aggregate amount of tax supported debt, and must account for the impact on local holders
Even after Puerto Rico implements the measures within its control, fiscal and economic recovery will be
immeasurably more difficult if the U.S. government does not act affirmatively to address some of Puerto Rico’s
most conspicuous fiscal and economic inequities
7
Partner with
the Federal
Government
to Generate
Growth
The Commonwealth suffers from inequitable healthcare treatment relative to the U.S. states. Its Medicaid
reimbursement is capped
Affordable Care Act funds that helped alleviate this inequity are expected to be depleted in FY 2018. Thereafter,
only local funds will be available to cover shortfalls for Puerto Rico’s struggling healthcare system. If not
addressed by the U.S. government, this deficiency in funding would devastate the Commonwealth's fiscal
accounts and social safety net
The economic damage left by the repeal of Section 936 demonstrates the need for pro-growth federal policies
that are tailored to increase private-sector employment and investment, such as funding a Puerto Rico Earned
Income Tax Credit (“EITC”) and permanent, cost-effective tax incentives for business investment
(1)
See the list of entities specified by the Oversight Board for the first Fiscal Plan submission included in the document issued by the Board entitled “Covered Entities Under the PROMESA Act.”
8
Implementing the Policies Within Puerto Rico’s Control Would Reduce the TenYear Base Financing Gap by an Estimated $19 Billion
Even after implementation of revenue and expenditure measures that are within Puerto Rico’s
control and the attendant growth it could generate, the Commonwealth would still face a tenyear financing gap of nearly $5.7 billion
The $19 billion reduction in the deficit includes the potential benefits of a change in the Commonwealth’s real economic
trajectory in the Base Projections from negative 1.7% to an average of 0.1%(1) growth, driven in part by new spending to
promote stability and growth
This revised growth rate assumes elimination of all debt service such that the Commonwealth can spend up to the
amount of its internally generated surplus in any year to promote growth (i.e., no external financing of any remaining
primary deficits, after the removal of debt service, is assumed)
Given there is still a deficit after excluding all debt service, the economic impact of the measures may be muted
The projections also assume no losses from Act 154 based on the assumption of a temporary extension of the excise tax via
local legislation while the Commonwealth reforms its tax code(2)
Projections Including Measures ($ millions)
($2,000)
$34,258
Implementation of measures consistent
with principles outlined previously
(apart from U.S. Government
Partnership), including the change in
the Commonwealth’s growth
trajectory, would reduce the deficit by
a cumulative $19 billion
($12,000)
($22,000)
($5,656)
($32,000)
$10,439
$8,707
($42,000)
($39,914)
Note that as in the Base Projections, no
additional austerity type measures are
presumed to fill this remaining gap; if
taken, such measures could reduce the
GDP growth assumed in this scenario
$9,605
($9,950)
($52,000)
($62,000)
($48,621)
($58,716)
Base Fin. Gap
Revenue Measures Expense Measures
Spending to
Gap Post-Measures,
Promote Stability
Pre-Economic
and Growth
Impact
Est. Change in
Economic
Trajectory
Gap Post-Measures, Exclusion of (3)
Debt Gap Excluding Debt
Post-Economic
Service
Service and Before
Impact
US Gov't Action
Note: See later in the presentation for the complete list of entities included in the Fiscal Plan; covered entities specifically identified by the Oversight Board are included. Additional details on how the projections were prepared are provided later in the
presentation.
(1)
Represents average real growth over the period FY 2018 to FY 2026.
(2)
The projection assumes that Act 154 excise tax credit is not ruled to be uncreditable under U.S. tax law.
(3)
Includes principal and interest payments that may have been missed in FY 2016 and FY 2017. Debt service shown net of existing reserves used to pay debt service. Note that for illustrative purposes, debt service excludes debt held by GDB and
excludes revenues otherwise allocated to COFINA FY 2017 debt service.
9
The U.S. Government Must Become a Partner in Achieving Growth to Fully
Eliminate the Commonwealth’s Financing Gaps
Equitable treatment under U.S. healthcare laws, combined with certain changes to other U.S.
policies, are critical to Puerto Rico’s future
U.S. citizens living in Puerto Rico do not receive the same level of healthcare funding as citizens living in the 50 states
Federal healthcare dollars, including Medicaid, are subject to a cap that does not apply to the states
ACA funds temporarily and partially offset this inequitable treatment, but such funds are expected to be exhausted in FY 2018 and
the already struggling healthcare system cannot afford to be deprived of additional funding
Puerto Rico’s hospitals are already struggling to retain doctors and pay their vendors
Equitable treatment under the U.S. healthcare laws that, at the very least, restores funding at least equal to the level provided by
ACA is essential for Puerto Rico to provide basic healthcare services to U.S. citizens living on the island and to help eliminate the
Commonwealth’s financing gaps prior to debt service
If Federal healthcare funding is kept at least at the level under current policies, (so the Commonwealth is not forced to dedicate
other revenues to replace the loss of ACA funding), those Commonwealth revenues can be dedicated to additional investments that
will drive a higher economic growth rate (the change in economic trajectory shown below represents an increase from 0.1% to an
average of 1.4% over the period FY 2018 to FY 2026)(1)
Additional actions from the U.S. government to increase private sector employment and investment, such as funding an Earned
Income Tax Credit, the Child Tax Credit, Supplemental Social Security Income, and permanent, cost-effective tax incentives for
business investment, could spark further growth than that estimated below
Note that no allocation to creditors of the potential surplus before debt service shown below has been included in this Plan
submission and the Commonwealth believes that creditors should share in both the benefits and risks of economic growth
projections such as those included below
Estimated 10-Year Financing Gap Reductions From Certain U.S. Government Actions ($ millions)
$8,378
$20,000
$16,141
$18,863
$10,485
$5,000
($10,000)
($5,656)
($34,258)
($25,000)
Gap Excluding Debt Service ACA Funding Replacement Surplus Excluding Debt
and Before US Gov't Action
Service and After US Gov't
Action
Change in Economic
(2)
Trajectory
Surplus Excluding Debt
Service and After US Gov't
Action
($15,395)
(3)
Inclusion of Debt Service Gap Including Debt Service
and After US Gov't Action
Note: See later in the presentation for the fulsome list of entities included in the Fiscal Plan; covered entities specifically identified by the Oversight Board are included. Additional details on how the projections
were prepared are provided later in the presentation.
(1) The change in economic trajectory also represents an increase in inflation from 2.0% to an average of 2.50% over the period FY 2018 to FY 2026.
(2) Represents average real GDP growth of 1.4% and average inflation of 2.5% over the period FY 2018 through FY 2026.
(3) Includes principal and interest payments that may have been missed in FY 2016 and FY 2017. Debt service shown net of existing reserves used to pay debt service. Note that for illustrative purposes, debt
service excludes debt held by GDB and excludes revenues otherwise allocated to COFINA FY 2017 debt service.
10
Fiscal Plan Compliance with PROMESA
Given PROMESA envisions an iterative process with the Oversight Board, full compliance
with the 14 requirements of PROMESA is dependent upon feedback and recommendations
from the Oversight Board. The Fiscal Plan contained herein, however, is a comprehensive
proposal that provides a basis for full compliance and certification in the near-term,
depending on the nature and timing of the Oversight Board’s feedback
Fiscal Plan Requirements(1)
1. Provide for estimates of revenues and
expenditures in conformance with agreed
accounting standards and be based on (i)
applicable laws, or (ii) specific bills that
require enactment in order to reasonably
achieve the projections of the Fiscal Plan
Comments
The Fiscal Plan submitted herein was prepared on a basis generally
consistent with modified accrual approach, with the exception of
certain elements.(2) All revenues and expenses are based on current
Puerto Rico and federal law, unless otherwise provided for in
proposed measures, the specific statutory changes for which can be
developed in conjunction with the Oversight Board
The Plan is specifically designed to provide for essential services
such as healthcare funding, public safety and education and to
2. Ensure the funding of essential public services
protect Puerto Rico’s most vulnerable residents and provide for
sustainable economic growth. Catch up in payables to suppliers of
essential services ensures stability of such services
3. Provide adequate funding for public pension
systems
4. Provide for the elimination of structural
deficits
Building upon previous pension reforms, the Fiscal Plan provides for
funding of retirement benefits through payments of the actuariallydetermined AACs and AUCs for the entities included in the Fiscal
Plan, and additional reforms
The Fiscal Plan provides for the elimination of structural deficits
assuming certain specified actions are taken by Puerto Rico and the
U.S. government
11
(1)
(2)
See Title II, Section 201(b) of PROMESA.
Certain items, such as the payment of past-due payable amounts, are purposefully projected on a cash basis as they were expenses incurred in prior periods and therefore would not be captured by modified accrual.
11
Fiscal Plan Compliance with PROMESA (cont’d)
Fiscal Plan Requirements(1)
Comments
5. For fiscal years covered by a Fiscal Plan in
which a stay under titles III or IV is not
effective, provide for a debt burden that is
sustainable
The Fiscal Plan provides principles to achieve a sustainable debt
burden. A specific debt restructuring proposal will be provided
following receipt of the Board’s recommendations and clarity
regarding assumptions for U.S. government actions and appropriate
economic growth rates. The final debt service level cannot exceed
the projected surplus before debt service in the final Fiscal Plan and
will be targeted not to exceed 15% of projected revenues
6. Improve fiscal governance, accountability and
internal controls
The Fiscal Plan includes specific measures to improve governance,
accountability and internal controls
7. Enable the achievement of fiscal targets
The Fiscal Plan is based on fiscal and growth targets developed in
conjunction with outside advisors and mandates updates to
reporting requirements to allow tracking of progress toward meeting
fiscal targets. The growth targets are contingent upon the adoption
and implementation of recommended Puerto Rico and federal
government measures
8. Create independent forecasts of revenues for
the period covered by the Fiscal Plan
Revenue forecasts were developed in conjunction with outside
advisors. The Commonwealth looks forward to validating its
projections with the Board and its staff
9. Include a debt sustainability analysis (“DSA”)
(1)
The Fiscal Plan shows that existing debt service is clearly not
sustainable. A formal DSA of restructured debt service will be
developed in conjunction with specific restructuring proposals
See Title II, Section 201(b) of PROMESA.
12
Fiscal Plan Compliance with PROMESA (cont’d)
Fiscal Plan Requirements(1)
Comments
10. Provide for capital expenditures and
investment necessary to promote
economic growth
The Fiscal Plan includes specifically identified capital projects intended
to rebuild aging infrastructure and promote economic growth.
Investments in the repayment of past-due amounts to suppliers and
taxpayers are also intended to generate growth
11. Adopt appropriate recommendations
submitted by the Oversight Board (under
Section 205(a) of PROMESA)
The Fiscal Plan includes specific fiscal and structural measures which
are of the type covered under Section 205(a) of PROMESA. The
Governor welcomes for consideration any additional recommendations
by the Board
12. Include such additional information as
the Oversight Board deems necessary
The Fiscal Plan includes a significant number of specific fiscal and
structural measures. The Governor welcomes for consideration any
additional recommendations of the Board
13. Ensure that assets, funds, or resources of
The Fiscal Plan suggests a holistic solution to the Commonwealth’s
a territorial instrumentality are not
fiscal and economic challenges is necessary and suggests the total
loaned to, transferred to, or otherwise
amount of resources available to pay any debt service. The Fiscal Plan
used for the benefit of a covered territorial
does not provide a specific debt restructuring proposal or prescribe any
instrumentality of a covered territory,
treatment for any specific credit. And such proposal may require an
unless permitted by the constitution of the
adjustment plan for Qualifying Modification under title VI or
territory, an approved plan of adjustment
numerous credits under title III. The debt restructuring proposal that
under title III, or a Qualifying
will be submitted will comply with Sections 201(m) and 201(n) of
Modification approved under title VI
PROMESA
14. Respect the relative lawful priorities or
lawful liens, as may be applicable, in the
constitution, other laws, or agreements of
a covered territory or covered territorial
instrumentality in effect prior to the date
of enactment of PROMESA
(1)
The Fiscal Plan does not provide a specific debt restructuring proposal.
The Fiscal Plan suggests a holistic solution to the Commonwealth’s
debt burden, which may require an adjustment plan for numerous
credits under title III and/or a Qualifying Modification under title VI.
As noted above, the debt restructuring proposal that will be submitted
will comply with Sections 201(m) and 201(n) of PROMESA
See Title II, Section 201(b) of PROMESA.
13
Core Principles of the Fiscal Plan
1. Minimize Impact of Austerity on Economic Growth
14
Since 2006, Puerto Rico’s Government Has Taken Significant Austerity
Measures, Including a Large Headcount Reduction
The Government has taken significant steps to control and reduce expenses, including a
significant reduction in public sector employment that has brought such employment as a
percentage of the total population in line with state averages.(1) In contrast to prior
administrations, the current administration decided that headcount reduction should occur
through attrition, not layoffs
Puerto Rico Public Sector Employees (thousands)(2)
315
295
(24%)
275
Reduction
of 73K
employees
255
The significant reduction in public sector employment has
reduced its share of total population to approximately 6%,
which compares favorably to mainland states, where the
typical share is between 5% and 8%
235
215
Public Sector Employment as a % of Total Population(3)(4)
12%
10%
8%
6%
4%
2%
0%
(1)
(2)
(3)
(4)
Public sector employment includes both Commonwealth government and municipality employment headcounts.
U.S. Bureau of Labor Statistics, Seasonally Adjusted Government Employment. Represents state and local government employees.
U.S. Department of Labor. Employment as of July 2016 and population as of July 2015.
U.S. Census Bureau.
15
The Commonwealth Has Also Implemented a General Freeze on Public Sector
Salaries and Other Spending
The Commonwealth has taken steps to control expenditures such as freezing employee
salaries and cutting non-salary compensation, in recognition that salaries are already well
below equivalent salaries in the states
The Commonwealth’s Special Fiscal and Operational Sustainability Act (Act No. 66-2014)
addresses Commonwealth spending by implementing various measures such as freezing increases
in payroll costs and/or collective bargaining agreements, cutting non-salary compensation, freezing
formula appropriations and reducing rates for school transportation costs and professional and
purchased services(2)
Police and Teacher Salaries in Puerto Rico and Other Financially Stressed Jurisdictions(1)
$80,000
$69,910
$62,370
$61,270
$59,680
$60,000
$40,000
$61,230
$57,730
$35,190
$30,870
$20,000
–
Puerto
Rico
Illinois
Detroit
Police Salaries
(1)
(2)
U.S. Average
Puerto
Rico
Illinois
Detroit
U.S. Average
Teacher Salaries
U.S. Bureau of Labor Statistics, Occupational Employment Statistics and National Education Association. Teachers salaries shown herein represent salaries for Elementary School Teachers, except Special Education, which has the highest number
of teachers.
Act No. 66-2014, June 17, 2014, GDB. http://www.gdb-pur.com/investors_resources/documents/A-066-2014.pdf.
16
As a Result of Austerity Measures, Government Consumption Expenditures Have
Declined Below 2006 Levels
Per the Puerto Rico Planning Board, government consumption expenditures were 12% lower
in FY 2015 than in FY 2006 on a real basis
Real Government Consumption Expenditures in FY 2006 and FY 2015(1)
($ millions, fixed at 1954 dollars)
$2,000
$1,950
$1,900
$1,850
(12%)
$1,800
$1,750
$1,700
$1,926
$1,650
$1,600
$1,700
$1,550
$1,500
2006
2015
Note: All figures are presented on a Puerto Rico fiscal year basis (July to June).
(1)
Puerto Rico Planning Board. GDB Statistical Appendix – Table 3: Gross National Product in Constant 1954 Dollars. Government Consumption Expenditures.
17
Critical Capital Investment Has Also Been Dramatically Reduced, Leaving the
Commonwealth’s Infrastructure in Disarray
Capital expenditures for Puerto Rico’s major agencies and component units (including PREPA
and PRASA) have fallen by approximately 70% from FY 2007 to FY 2015. When excluding the
impact of PREPA and PRASA capital expenditures, total investment declined by approximately
76% over the period
Note that the numbers shown below are inclusive of federal grants related to capital spending and
are as reported by the Office of Management and Budget(1)
Actual Capital Expenditures of Major Commonwealth Agencies(2)
($ millions)
Budgeted capital expenditures for FY 2016 and FY 2017:(3)
2016
$989
$41 4
$3,500
$3,000
Total CapEx incl. PREPA, PRASA
Total CapEx ex cl. PREPA, PRASA
$3,115
$2,987
$2,500
$2,500
$2,256
Capital Expenditures excl. PREPA & PRASA
$2,033
$2,000
2017
$933
$37 8
$1,858
$1,654
$1,797
(70%)
$1,526
$1,500
Capital Expenditures incl. PREPA & PRASA
$1,498
$1,497
$1,323
(76%)
$1,000
$1,257
$950
$774
$907
$670
$437
$500
-
2007
(1)
(2)
(3)
2008
2009
2010
2011
2012
Note that the numbers shown will not correspond to the CAFR.
Office of Management and Budget, Presupuesto Consolidado de Mejoras Permanentes por Agencia. Actual figures shown unless indicated otherwise.
FY 2017 budgeted figures shown reflect the Office of Management and Budget’s recommended budget for FY 2017.
2013
2014
2015
18
The Government Has Also Been Forced to Delay Payments to Vendors and
Taxpayers, as Well as Contributions to the Pension Systems
Since 2007, past-due obligations of the Primary Government and Component Units owed to
third-party vendors, taxpayers, and the pension systems have all markedly increased
Primary Government and Component Unit Total Accounts Payable, Tax Refunds Payable, and Net Pension Obligation(1)
($ billions)
25.0
20.0
FY 2014 is shown as it is the last year of
audited financials, but it is believed that
payables to third-party vendors have
increased materially since FY 2014
114%
15.0
14.6
13.1
10.0
5.0
11.2
8.0
5.1
5.8
6.8
4.7
0.3
0.3
0.2
0.4
4.4
4.5
4.5
4.3
2006
2007
2008
2009
0.4
9.3
1.2
0.8
0.4
0.9
3.8
3.4
3.2
3.9
4.6
2010
2011
2012
2013
2014
Accounts Payable
Tax Refunds Payable
Net Pension Obligation
Note that the net pension obligation of the Primary Government is based upon an actuarial valuation and is distinct from the full unfunded liability of the retirement systems, instead representing the Primary Government’s obligation as a sponsor to
fund its pensions.
(1)
Commonwealth Comprehensive Annual Financial Reports. Figures sourced from Statement of Net Position. Note that accounts payable figures include both primary government and component units but exclude fiduciary funds. Payables are
not limited to past-due balances.
19
These Expense Reductions Have All Come Hand-in-Hand with Significant
Revenue Increases, Which Have Reduced Disposable Income
Revenues from the Act 154 excise tax imposed in 2011 and the 2015 increase in the Sales and
Use Tax (“SUT”) to 11.5% now account for approximately 30% of General Fund revenues
FY 2017(1) General Fund Revenues
($ millions)
FY 2017
Budget
% of T otal
General Fund Rev enue (Pre-Measures)
Indiv idual Income Tax es
Corporate Income Tax es
Non-Resident Withholding
Sales and Use Tax
Act 1 54 Ex cise Tax
Alcoholic Bev erages Ex cise Tax
Tobacco Products Ex cise Tax
Motor V ehicles Ex cise Tax
Rum "Cov er Ov er" Rev enues
Other General Fund Rev enues
T otal General Fund Rev enues
$1 ,966
1 ,525
7 63
1 ,608
1 ,924
27 2
117
293
206
426
21 .6%
1 6.8%
8.4%
1 7 .7 %
21 .1 %
3.0%
1 .3%
3.2%
2.3%
4.7 %
$9,100
100.0%
SUT increase from 7% to 11.5%,
the highest in the U.S.(2), resulted
in approximately $1 billion of
incremental GF revenues in FY
2016 and represents
approximately 11% of projected
FY 2017 GF Revenues
Act 154 excise tax revenues
represent 21% of total projected
FY 2017 GF Revenues
Note that Fiscal Plan projections
have subsequently been reduced
to $9,045 million due to lower
lottery revenues
There have also been significant increases in taxes and charges outside of the General Fund. For example,
the recent increases in the excise tax on petroleum products from $3.00 to $15.50 generates approximately
$360 million of incremental revenues and the 2013 60% increase in water rates by PRASA generates
approximately $330 million of incremental revenues
(1)
(2)
Note that the Puerto Rico fiscal year runs from July to June.
“Puerto Rico, At 11.5%, Has America’s Highest Sales Tax.” August 17, 2015, Forbes.
20
All of These Austerity Measures Have Not Reversed and May Have in Fact
Contributed to a Decade of Economic Contraction
The combination of the 2006 elimination of Section 936 of the U.S. tax code, the onset of the
U.S. financial crisis, and the aforementioned pro-cyclical austerity measures, have led to
negative real GNP growth in every year but one since 2006
The GNP declines would have been even worse had it not been for large stimulus spending, such as the
approximately $7.1 billion of funds allocated to Puerto Rico under the 2009 American Recovery and
Reinvestment Act (ARRA) and the creation of a $500 million “Local Stimulus Fund” funded from the Puerto
Rico Sales Tax Financing Corporation (“COFINA”) bond issuances in 2009 and 2010(1)
Furthermore, tax reform enacted in 2011 sought to jumpstart the economy by reducing individual and
corporate taxes by approximately $706 million, some provisions of which were later modified to address
resulting revenue shortfalls
Real GNP Growth Rates – Puerto Rico vs. United States(2)(3)
Puerto Rico
4.0%
2.9%
3.0%
2.9%
2.2%
2.0%
1.0%
United States
3.0%
1.8%
1.7%
1.5%
0.5%
0.5%
0.0%
–
(0.1%)
(1.0%)
(0.6%)
(1.2%)
(2.0%)
(1.7%)
(3.0%)
(1.7%)
(2.9%)
(3.4%)
(4.0%)
(3.8%)
(3.6%)
(5.0%)
2006
(1)
(2)
(3)
2007
2008
2009
2010
2011
2012
2013
2014
2015
2011 Comprehensive Annual Financial Report p. 27.
Puerto Rico Fiscal Authority Agency and Financial Advisory Authority. Economic Activity Index (“EAI”) Reports for Puerto Rico GNP data and the U.S. Bureau of Economic Analysis for the United States GNP data. Both Puerto Rico and U.S.
fiscal data reported on a Puerto Rico fiscal year basis (July to June).
Puerto Rico values are based on real GNP calculated at 1954 prices; U.S. values are based on real GNP at 2009 prices.
21
The Economic Crisis Has Compromised the Government’s Ability to Provide
Essential Services
Past due payments to suppliers have called into question the government’s ability to provide
its residents with essential police, education and healthcare services
“The island reached a tentative deal…with Total Petroleum Puerto Rico Corp.
after the company warned it would no longer supply state vehicles
with gasoline because of the government’s $16 million debt”
-Danny Hernández,
Spokesman for the General Services Administration(1)
“Carmen Warrel, spokesperson for the Special Education Steering
Committee parent’s association, highlighted that there are cases, such as
the Instituto Modelo de Enseñanza, which is contracted by the
Department of Education to serve students with autism, who
have announced closure at the end of the month if not paid”
-Univision(2)
“Administrators detailed both delayed funding from insurers
and government sources, and how the hospital had to
delay and prioritize payments to provide basic care
for its patients. ‘We are hanging by a thread,’ said Dr.
Juan Nazaro, executive director of the hospital”
-The Atlantic(3)
(1)
(2)
(3)
“Puerto Rico’s Crisis Threatens to cut Gas, Power Supplies,” January 11, 2016, Caribbean Business. http://caribbeanbusiness.com/puerto-ricos-crisis-threatens-to-cut-gas-power-supplies/.
“Servicios de Educación Especial afectados por falta de liquidez en Puerto Rico,” January 18, 2016, Univision Agencia EFE. http://www.univision.com/noticias/educacion-especial/servicios-deeducacion-especial-afectados-por-falta-de-liquidez-en-puerto-rico.
“Will Puerto Rico’s Debt Crisis Spark a Humanitarian Disaster,” May 13, 2016, The Atlantic. http://www.theatlantic.com/politics/archive/2016/05/puerto-rico-treasury-visit/482562/.
22
The Economic Crisis Has Led to Material Outmigration from the Island, the Pace
of Which Appears to Be Intensifying
Puerto Rico’s population declined by approximately 9% from 2006 to 2015 and the rate of
outmigration appears to be increasing
Puerto Rico Population 2006 to
Puerto Rico Net Outgoing Air Passenger Traffic
(Total on a Rolling Last Twelve Month Basis)(2)
2015(1)
(millions)
325
321
320
3.8
U.S.
315
310
Puerto
Rico
305
300
298
9-Year Growth
United States: 7.7%
Puerto Rico: (8.7%)
4.0
120,000
3.9
100,000
3.8
80,000
3.7
60,000
3.6
40,000
3.5
20,000
3.4
-
3.5
295
2006 2007 2008 2009 2010 2011 2012 2013 2014 2015
Puerto Rico lost approximately 331,000 people
in the period from 2006 to 2015
2006 2007 2008 2009 2010 2011 2012 2013 2014 2015 2016
Based on outgoing passengers less incoming
passengers, it appears the pace of those
migrating from the island may be increasing
Outmigration has only exacerbated the Commonwealth’s fiscal
and economic challenges and has a material impact on the
Commonwealth’s long-term economic potential
(1)
(2)
U.S. Census Bureau, Population Division. Yearly data shown as of July 1.
Puerto Rico Institute of Statistics.
23
In Fact, Puerto Rico’s Outmigration Leading Up to its Default Dwarfs that
Experienced by Other Troubled Jurisdictions
On a percentage basis, outmigration from the island has exceeded that experienced in Washington D.C.
prior to the implementation of a control board and is comparable to that experienced in Detroit prior to its
Chapter 9 filing; however, in absolute terms, Puerto Rico’s total population loss is far greater than either
Detroit or D.C.
Puerto Rico Population (thousands)(1)
3,800
3,600
3,400
3,679
3,634
3,593
3,535
3,474
3,200
2011
2012
2013
2014
Puerto Rico’s population
declined by
approximately 6%, or
205K, from 2011-2015
2015
Detroit Population (thousands)(2)
800
600
400
731
714
704
699
690
2009
2010
2011
2012
2013
Detroit’s population
declined by
approximately 6%, or
41K, from 2009-2013
200
Washington, D.C. Population
(thousands)(3)
800
600
400
601
598
595
589
581
1991
1992
1993
1994
1995
200
(1)
(2)
(3)
(4)
The District of Columbia’s population
declined by approximately 3%, or 20K,
from 1991-1995. While over a longer time
period (through 2000), D.C. had a larger
economic and demographic shift, if
current trends continue, Puerto Rico’s
shift may surpass that of D.C. not only on
a nominal basis but also on a percentage
basis(4)
U.S. Census Bureau, Population Division, Annual Estimates of the Resident Population.
Annual Estimates of the Resident Population: April 1, 2010 to July 1, 2015. Source: U.S. Census Bureau, Population Division.
Time Series of District of Columbia Intercensal Population Estimates by County: April 1, 1990 to April 1, 2000. Source: Population Division, U.S. Census Bureau.
Compares D.C.’s population from 1980-2000, during such period there was a 10.4% decline. U.S. Census Bureau Intercensal Population Estimates of the Total Resident Population of States.
24
The Economic Crisis and Austerity Actions Taken to Date Have Negatively
Impacted the Population, Nearly Half of Whom Live Below the Poverty Line
Puerto Rico’s economic collapse has created deteriorating conditions for those living in
poverty, while they continue to face a cost of living comparable to the U.S.
Population below the Poverty Level (2014)(1)
50%
46%
Per Capita Disposable Income(2)
$50
($ thousands)
$41
$38
40%
$40
$44
$42
$39
$40
$46
$44
United
States
30%
22%
20%
16%
10%
(Highest State)
United States
Mississippi
Puerto Rico
$18
$17
$16
$14
$18
$17
$16
$15
$14
Puerto
Rico
$0
2006
2007
2008
2009
2010
2011
2012
2013
2014
Cost of Living(3)(4)
Rank
1.
2.
3.
4.
47 .
296.
297 .
298.
(1)
(2)
(3)
(4)
Urban Area
Manhattan, NY
Honolulu, HI
San Francisco, CA
Brookly n, NY
…
San Juan, PR
…
Richmond, IN
Harlingen, TX
McAllen, TX
Cost of Liv ing Index
227
1 88
17 6
17 3
112
81
80
78
Av erage = 100
Though Puerto Rico’s per capita disposable income is
only ~40% of the U.S. average, ~70% of the population
of Puerto Rico lives in the San Juan MSA, which is
ranked 47th highest out of 298 U.S. metropolitan areas
and 11.6% above the average due to some of the highest
prices for utilities, groceries and goods and services in
the country(3)
U.S. Census Bureau. Current Population Survey, Annual Social and Economic Supplement, 2015 United States data. Puerto Rico poverty level based on 2014 American Community Survey 1-Year estimates.
GDB Statistical Appendix (Selected Series of Income and Product, Total and Per Capita). U.S. Bureau of Economic Analysis (U.S. Personal Income and Population).
The Institute of Statistics of Puerto Rico. Index Cost of Living, June 17, 2016.
Council for Community and Economic Research.
25
Breaking the Vicious Cycle
Lower Real
GDP Growth
Increase Real
GDP Growth
Improved
Potential GDP
Virtuous
Cycle
Strong Job
market,
population
growth
Stronger
Fiscal Position
Space for
Structural
Reform,
Investment
Declining
Potential GDP
Poor Job
Market, High
Migration to
U.S.
Vicious
Cycle
Weaker Fiscal
Position,
Deficits
No Space for
Reform or
Investment
Austerity measures have not reversed Puerto Rico’s economic decline nor helped
Puerto Rico’s impoverished residents. All the measures outlined further in the Fiscal
Plan are based on the guiding principle that more austerity measures are simply not
the answer to Puerto Rico’s current crisis.
26
Core Principles of the Fiscal Plan
2. Improve Budgetary Controls and Financial Transparency
27
Fiscal Plan Must Address Legacy of Lax Budget Controls, Fragmented DecisionMaking and Delays in Presentation of Fiscal and Economic Information
The Commonwealth has historically failed to meet revenue estimates, failed to control
spending, and failed to consistently produce timely financial statements
General Fund Revenues(1) ($ millions)
General Fund Actual Deficit(1) ($ millions)
$10,000
$9,500
–
$9,000
$8,500
($500)
$8,000
($1,000)
$7,500
$7,000
($1,500)
$6,500
$6,000
($2,000)
($2,500)
Original Budget
Actuals
Days to Produce Fiscal Year Audited Financial Statements(1)
596
47 9
345
3 04
2002
2003
(1)
397
282
257
2004
2005
2006
351
2007
443
4 08
2008
2009
3 01
3 02
2010
2011
365
2012
2013
2014
Commonwealth of Puerto Rico CAFR, Statement of Revenues, Expenditures, and Changes – Budget and Actual – Budget Basis – General Fund.
28
Institute New Budgetary Rules and Practices to Impose Budgetary Discipline
In light of the Commonwealth’s chronic budget deficits and repeated failure to meet revenue
estimates, it should institute new rules and practices to impose budgetary discipline. Without
effective budgetary and other controls, it will be challenging to measure performance under the
Fiscal Plan and make necessary real-time adjustments
Reform
Budgetary
Rules and
Processes
Budgetary Planning and Implementation
Require Budgets to be prepared in accordance with “Modified Accrual Accounting Standards” (as
defined by GASB)
Implement multi-year budgeting requirement to identify trends and enable long-term planning
Eliminate Commonwealth’s Special Revenue Funds, and account and budget for all revenue and
expenditure transactions in the General Fund (except for Federal Grants)
Improve revenue projections by relying on third-party validation process
Implement quarterly General Fund budgetary revision process based on actual revenues and
expenditures in order to make timely budgetary adjustments
Tax Expenditure Inventory and Budget
Require perpetual inventory of tax credits issued and outstanding in order to measure impact on
revenue estimates
Require periodic reporting on cost/benefit analysis of tax expenditures
Require Annual Tax Expenditure Budget that prepares annual revenue estimates on a “gross basis”,
then adjusts to reflect the impact of existing and proposed tax exemptions, exclusions and deductions
Require annual budgetary approval of tax credits, like any other budget line item
Additional Controls
Enact regulations so that OMB/Treasury can hold UPR, Legislative Assembly and dependent agencies
and public corporations accountable for their expenditures
Require periodic measurement and reporting of the capture rate of all taxes
Prohibit legislation with fiscal or budgetary impact to be approved during the fiscal year without new
sources of revenues
Close all operating funds at the end of each fiscal year
Require Federal Funds reimbursement reconciliation on a monthly basis
29
Make Fiscal and Economic Data Transparent, Reliable and Timely
Obsolete financial and accounting systems, combined with a lack of integration of agencies under
the same platform, hinders the ability to timely monitor expenses, complete annual audits and
publish fiscal and financial data
Invest in
Systems to
Develop and
Report
Accurate
Financial
Data
Strengthen
Economic
and
Statistical
Analysis
Invest in new financial, accounting and payroll systems to streamline internal accounting and reporting processes
and sharing of information in order to provide real-time data and accelerate the preparation and publication of
interim and audited financial statements
Execute agency and public corporation consolidation plan (described in Section 3), which will reduce the number
of reporting entities in the Commonwealth’s financial statements and simplify related audit procedures
Consolidate agencies’ finance divisions, supplier payment processing and management of federal grants in a
shared service center
Create Commonwealth Financial Reporting Office in order to properly coordinate the production and
dissemination of fiscal and financial data within the newly created Department of Treasury and Finance
The Commonwealth must be equipped with transparent, reliable and timely macroeconomic data
that allows for better economic forecasting
Adopt the Institute of Statistics and the Planning Board’s five-year plan to strengthen the economic statistical
system and analysis by modernizing national accounts with an estimated investment of $3 million per year
Reorganize and expand Puerto Rico’s current five national accounts into seven accounts (Net Income and Gross
Product, Personal Income and Outlays, Government Receipts and Expenditures, Foreign Transactions-Current,
Foreign Transactions-Capital, Gross Savings and Investment and Private Sector Income)
Present national accounting statistics in accordance with the 2008 United Nations standards and publish full
sets of quarterly statistics
Develop a new forecasting model for Puerto Rico’s national accounts with technical assistance from the U.S.
Bureau of Labor Statistics and the U.S. Bureau of Economic Analysis
30
Enhance Financial Controls and Fiscal and Economic Decision-Making
Ensure all
Spending
Flows
Through a
Single
Treasury
The Commonwealth currently has a highly fragmented treasury system that lacks
emphasis on fiscal and financial controls and provides little visibility of the
Government’s consolidated financial position. The centralization of treasury functions in
the central government can provide significant communication, visibility and efficiency
benefits
Establish by legislation centralized single treasury functions across Commonwealth agencies and
dependent public corporations to enhance visibility, reduce financing costs and improve cash flow
management
Single Treasury account should be used for all spending to make sure it is controlled and consistent
with the budget
Single Treasury account will also provide visibility into the Commonwealth’s consolidated fiscal
position
Develop
Performance
Metrics
Agencies lack proper KPI’s and benchmarking data that facilitate budget development
and execution
Complete the development of performance metrics for the principal agencies and departments of the
Government: Education, Health, Police, Justice and Children and Families
Establish an electronic system to publish performance metrics in order to improve execution and
enhance transparency
Reorganize
Fiscal and
Economic
Decision
Making
Structures
A well-structured approach towards financial and economic development decisions will
help improve forecasting and financial and economic decision-making
Consolidate the functions of the Treasury Department, OMB and AAFAF into new Department of
Treasury and Finance to better manage and coordinate fiscal and financial policy
Submit and pass legislation to implement new Department of Economic Development and Commerce
organizational structure and business plan
31
Core Principles of the Fiscal Plan
3. Rationalize Expenditures and Tax Policy To Promote
Efficiency
32
The Commonwealth Can Achieve Efficiency Gains by Consolidating Overlapping
Agencies and by Further Centralizing Procurement to Capture Cost Savings
Puerto Rico’s government is composed of 114 agencies and public corporations with over 519 local and
regional offices throughout the island, creating a highly fragmented structure with redundancies and limited
economies of scale
In order for the Commonwealth to achieve operational efficiencies, it must pursue the following measures:
Continue implementation of the Government Reorganization and Efficiency Plan (EO 2015-23), so as to
consolidate local government offices and increase the use of technology and shared services
A redesign of governmental structures as proposed by OMB and UPR’s Public Administration Faculty,
which will lead to a consolidation of approximately 48 government entities, generating savings in rent and
utilities and facilitating future workforce attrition
The Commonwealth can benefit from additional operational efficiencies by continuing efforts to ensure that
certain purchases of materials and supplies are managed by a new, modern, procurement system in the Puerto
Rico General Services Administration, as well as facilitating the process by which local businesses become
vendors of the U.S. General Services Administration
This is estimated to achieve approximately 4% in savings. Economies of scale made available by Section
406 of PROMESA, which allows the Commonwealth to make purchases through the U.S. GSA, can help
meet this goal
Number of Agencies and Public Corporations(1)
Estimated Impact vs. Base Projections ($ millions)
Operational Efficiencies
144
96
1 08
128
-48
116
114
88
67
66
60
161
162
165
168
171
174
178
41
42
43
44
45
45
46
120
120
122
124
127
129
131
2020
2021
2022
2023
2024
2025
2026
36
28
47
Centralized Procurement
80
0
1955
1965
(1)
1975
1985
1995
2005
2015
2018P
2017
2018
2019
Centro de Estudios Multidisciplinarios Sobre Gobierno y Asuntos Públicos; “Estudio sobre la Organización y el Desempeño de la Rama Ejecutiva”.
33
In Addition to Consolidating Agencies, the Commonwealth Should Continue to
Implement its School Consolidation and Reinvestment Program
Since 2005, enrollment at PR public schools has declined 37%, which has led to a reduction in school
utilization and a decrease in the student to teacher ratio to 12:1, as compared to the U.S. average of 16:1
In light of the continued decline in enrollment and school utilization, the Puerto Rico Department of Education
(“PRDE”) will continue to execute its School Consolidation Plan, which it has been carrying out over the last
three years (155 schools already consolidated with academic performance increasing in consolidated schools(1))
The consolidation process is based on specific parameters such as academic performance, enrollment,
school utilization and distance. As it continues to right-size its resources, the PRDE will ultimately position
itself to deliver higher quality education with better compensated teachers
The Commonwealth will complete the remaining phases of PRDE’s restructuring plan, which requires overhauling
management and operations to focus on moving personnel from administrative positions back into school-based
positions
Actual and Projected Student Enrollment (in thousands) (2)
Estimated Impact vs. Base Projections ($ millions)
Overhaul of Management and Operations
CAGR
-4%
-37%
576
493
411
-17%
365
370
353
336
319
3 02
42
14
2005
2010
School Consolidation
2015
Oct-16
2017P
2018P
2019P
2020P
2021P
0
28
2017
2018
(1) Based on standardiszed tests (META PR)
(2) Department of Education's historic, actual and projected student enrollment as of October 2016.
71
14
99
14
127
14
129
14
131
15
134
15
136
15
139
15
113
115
117
119
121
123
2021
2022
2023
2024
2025
2026
85
57
2019
2020
34
Given the Interconnectedness of Puerto Rico’s Hospital Systems, the
Commonwealth Can Also Achieve Cost Savings Via Hospital Consolidations
The Puerto Rico’s hospital system is highly fragmented and can capture significant efficiency gains by
integrating hospital administration and leveraging P3s
Creating the Puerto Rico Medical Center Campus organized around specialty institutions will
integrate all government hospitals into a single organization
Phase 1 contemplates merging Administration of Medical Services of Puerto Rico (“ASEM”),
the University Hospital and University Pediatric Hospital (“HOPU”)
Phase 2 would further merge the Industrial Hospital, currently run by the State Insurance
Fund, as well as other government-run hospitals
Implementing functional P3s at state hospitals (billings, admissions, maintenance and food
services, among other support services) will bring best in class practices, centralize functions and
streamline processes
Interconnected Relationship Among Health Care System(1)
Estimated Impact vs. Base Projections ($ millions)
Hospital Consolidations
Functional P3s
43
43
43
44
45
45
46
47
19
19
19
19
20
20
20
21
24
24
24
24
25
25
26
26
2019
2020
2021
2022
2023
2024
2025
2026
22
10
12
-4
2017
(1)
-2
-2
2018
Interviews, V2A Analysis. “RCM” stands for UPR’s Medical Sciences Campus.
35
Puerto Rico Must Implement Measures to Control Increasing Health Care Costs
Puerto Rico’s health care system should implement initiatives designed to improve medical quality,
utilization and cost
Implement STAR-like(1) rating system and establish a provider payment scale based on performance
ASES is developing a Primary Medical Group (“PMG”) quality monitoring program that would allow the
agency to monitor quality, utilization and cost of the Commonwealth healthcare program (“Reforma”)
Standardize health protocols and fee schedules by creating a uniform guide for medical procedures and
corresponding medical service fee schedules
These initiatives are designed to decrease medical costs close the per member per month (“PMPM”) gap
among PMGs, as shown in the graph below
Reduce the number of federally qualified healthcare centers receiving grants under Section 330 of the Federal
Public Health Service Act that are located near existing hospitals or clinics and adjust the wrap-around payment
formula for services rendered by these centers to beneficiaries of Reforma
Estimated Impact vs. Base Projections ($ millions)
PMGs Max and Average PMPM Cost(2)
Centers 330
STAR-like Rating System
Health Protocols
50
50
50
51
52
53
54
55
15
15
15
15
16
16
16
16
30
30
30
30
31
31
32
32
33
2018
2019
2020
2021
2022
2023
2024
2025
2026
43
8
0
Average PMPM
PMPM most expensive PMG
PMPM Gap
2017
(1) Centers for Medicare and Medicaid Services (“CMS”) Five Star Quality Rating System.
(2) ASES’ “Proyecto de Evaluación y Monitoreo de Calidad de Proveedores” 2015-2016.
36
Additional Cost Savings Can Also Be Achieved by Avoiding Programmed
Expenditure Increases That Are Not Based on Assessments of Need
Act No. 66-2011, which froze new hires, salaries and formula-based appropriations, is due to expire in June
2017. The Fiscal Plan extends most of Act 66’s fiscal control measures and proposes to permanently repeal
formula appropriations and convert them to fixed amounts adjusted annually by inflation
The Fiscal Plan proposes to extend through FY 2021 Act 66’s freeze of new hires, formula-based appropriations
for UPR, the Judicial Branch and municipalities, as well as a freeze of service costs, increases in salaries and
collective bargaining agreements
After FY 2021, the Fiscal Plan permanently fixes these appropriations at their fiscal year 2014 levels and only
allows them to grow after 2021 at the rate of the previous fiscal year’s inflation(1)
Adjusted General Fund Budgeted Expenses (2) ($ millions)
Without Act 66
Estimated Impact vs. Base Projections ($ millions)
Extend Act 66 and Fix Formula Appropriations
Extend Act 66
Fix Formula Appropriations
9,354
9,400
9,200
416
9,016
9,000
400
384
336
8,888
368
353
338
2024
2025
2026
257
8,800
178
8,600
8,472
8,400
0
2 01 8
(1)
0
2 01 9
2 02 0
2 02 1
2 02 2
2 02 3
2 02 4
2 02 5
2 02 6
2017
2018
2019
2020
2021
2022
2023
Net Revisions to GF Budget Formulas, Payroll, Operating Expenses and Water Utilities represents the effective replacement for the reduction in municipalities subsidies and Extend Act
66 measures after FY2021 to continue capturing savings already achieved
37
(2) Adjusted General Fund Budget excluding debt service and AUC’s embedded in the General Fund.
.
To Reduce Their Potential Economic Impact, Proposed Workforce Related Cost
Savings Are to Occur Through Retirement or Attrition
The Fiscal Plan calls for the Commonwealth to reduce its payroll costs, but does so through a 2% annual
payroll attrition target that relies on the Commonwealth replacing departing workers only when necessary
In order to achieve these attrition targets, the Office of Management
and Budget (“OMB”) will:
Implement Act 211-2015 offering Pre-Retirement Program
(PRP) windows to select public sector employees
Implement new government-wide employee classification
programs to improve mobility and allocation of human
resources
Estimated Employee Headcount Attrition(1)
-12,836
8 7 ,2 8 3
8 6 ,5 5 9
8 4 ,6 9 2
2017
2018
2019
2020
1 ,1 3 6
1 2 ,8 3 6
GF & CU
Attrition
Total
2 ,9 7 6
8 ,7 2 4
The Commonwealth will benchmark public sector benefits to those of
the private sector, which would also work to increase productivity
and facilitate attrition efforts
Estimated Payroll Costs(2) ($ millions)
9 7 ,5 2 8
Act 211-2015
DOE Attrition
Estimated Impact vs. Base Projections ($ millions)
229
233
237
242
246
251
225
2020
2021
2022
2023
2024
2025
2026
-2%
3,676
3,546
3,522
3,451
131
155
0
2017
2018
2019
2020
2017
2018
2019
(1)
Estimated headcount based on OMB’s analysis of General Fund and Component Units employees included in the Base Projections, excluding the University of Puerto Rico. Impact of
Act 211-2015 based on preliminary analysis of employees that meet basic criteria.
(2) Act 211-2015 attrition estimate based on initial estimates of eligible employees.
38
Reduce Subsidies and Other Special Appropriations
The central government’s precarious fiscal situation is exacerbated by sizable subsidies to other governmental entities,
including municipalities, as well as by benefits legislated through special laws
The Commonwealth would enact legislation beginning in FY 2018 to gradually adjust subsidies provided to the municipalities by the
central government, while also empowering the municipalities with the proper legal, administrative and operational tools to offset
such a decrease
Municipalities may present revenue generation and expense reduction initiatives, which may include changes to municipal
license fees, modernization of property tax regimes and municipal consolidations, among others
Note that the municipalities are contributors to the Employees Retirement System and the Fiscal Plan assumes that the central
government does not cover any amounts related to the municipalities (approximately $100MM per year). The municipalities ability
to contribute such amount could be at risk, particularly if they are not made covered entities
In addition, the Commonwealth would modify special laws benefits granted to the Department of Education’s employees that retired
before 2014, Christmas bonus, medicine bonus, and medical insurance plan continuation, which are in addition to the benefits
related to pensions
Formula appropriation to UPR is to be frozen until 2021 and thereafter only grown at inflation. No further cuts are contemplated due
to the importance of higher education to the island’s economic development
UPR will need to implement measures to enhance efficiency and re-invest in education
Adjusted FY2016 General Fund Budgeted Expenses (1) ($ millions)
Estimated Impact vs. Base Projections ($ millions)
TRS Special Law Benefits
8,028
Special
Appropriations
General Fund
(net)
41%
59%
2016
(1)
3,329
Municipal Subsidy
15%
Other
15%
Retirement Systems
27%
Health Insurance
Includes $49MM
for Special Laws
Formulas
2016
42
341
41
340
40
339
39
3 00
3 00
3 00
3 00
3 00
2022
2023
2024
2025
2026
44
145
Includes $361MM for
Municipalities
342
43
244
96
44%
343
47
46
0
47
50
2017
2018
2019
45
2 00
1 00
2020
2021
Adjusted General Fund Budget excluding debt service.
39
The Commonwealth Must Increase Revenue Collections by Boosting its Capture
Rate and Reducing Tax Evasion
The Commonwealth lacks an effective tax administration infrastructure, resulting in significant tax evasion
and high administrative and compliance costs. In order to increase capture rates the Commonwealth will:
Upgrade technology and leverage its use by:
Improving Integrated Merchant Portal System (PICO)
Implementing New Internal Revenue Integrated System (SURI)
Implementing Automated System for Customs Data (ASYCUDA)
Expand alternative delivery and payment channels’ capabilities by:
Increasing transactions and services online, through a call center and in banks and credit unions
Transforming its 89 collection centers into 27 Integrated Service Centers throughout the island
Improve tax enforcement by:
Restricting the use of amnesties and closing agreements to increase revenue certainty and reduce tax evasion
Leveraging joint ventures between the Central Government and municipalities for greater SUT oversight (2)
Creating the Office of Tax Return Compliance and Office of Transfer Pricing Policies
Tackling widespread use of illegal video lottery machines that erode Puerto Rico’s tax base by implementing and enforcing tax on,
and regulating, video lottery games
Require periodic measurement and reporting of the capture rate of all taxes
Estimated Impact of Video Lottery(1) vs. Base Projections ($ millions)
Estimated Impact ($ millions)
Expand Delivery Channels
Upgrade Technology
Tax Enforcement 81
90
92
92
92
92
92
92
70
66
25
30
35
35
35
35
35
35
2017
77
75
72
69
66
64
2022
2023
2024
2025
2026
55
35
10
81
0
2018
2019
2020
2021
2022
2023
2024
2025
2026
2017
2018
2019
2020
2021
(1) Video Lottery estimates based on Christiansen Capital Advisors, LLC study adjusted for Puerto Rico income levels. Estimates are net of ~35% allocation to CRIM.
(2) Joint Ventures exist for 48 municipalities. Remaining 30 joint ventures are expected to be completed under this measure.
40
The Commonwealth Must Address Upcoming Act 154 Revenue Cliff by Changing
its Tax Code to Substitute Projected Revenue Shortfalls
The Commonwealth is currently highly dependent on receipts from the Act 154 excise tax (approximately
21% of General Fund revenues), which is due to be replaced by a “Modified Source Income Rule” tax in
December 2017 (FY 2018). Extension of Act 154’s excise tax for a short transition period is necessary in
order to ensure revenue certainty while a new corporate tax regime for multinationals is implemented
Act 154’s transition in FY2018 to a tax based on the Modified Source Income Rule is estimated to result in a loss
of half of estimated tax revenues. The Commonwealth proposes to temporarily extend Act 154 excise tax (2-3
years) to give the government sufficient time to renegotiate individual tax grants and reform its tax code such that
it replaces Act 154 revenues in full to current levels
Assumes no adverse decisions by the IRS during this interim period
Act 154 Projected Revenues - Pre Measure ($ millions)
Impact of Measure ($ millions)
Revenue Loss due to Modified Source Income Rule Switch
Impact of 4% Excise Tax Extension and New Tax Regime
Act 154 Revenue
1 ,92 4 1,924
1,924
1,924
1,924
1,924
1,924
1,924
1,924
1,924
1,924
481
1,924
1,924
1,924
1,924
1,924
1,924
1,924
1,924
962
962
962
962
962
962
962
962
2019
2020
2021
2022
2023
2024
2025
2026
481
962
962
962
962
962
962
962
962
962
962
962
962
962
962
962
962
2019
2020
2021
2022
2023
2024
2025
2026
1,443
2017
2018
Act 154 4%
Excise Tax
Act 154
Modified
Source Income
2017
2018
Extension of
Act 154 4%
Excise Tax
New Tax
Regime
41
Core Principles of the Fiscal Plan
4. Enact Structural Economic Measures and Invest in Growth
42
The Plan Must Boost Private Employment and Labor Force Participation Levels,
Which Are the Lowest in the United States
The number of private sector jobs in Puerto Rico as a percentage of the total population is materially
lower than any mainland state, helping drive high unemployment, which is double that of the U.S.
average, and a low labor force participation as Puerto Rico residents face dismal job prospects(1)
Private Payroll Employment as a Percentage of Total Population by State – 2015(2)(3)
50%
45%
40%
35%
30%
25%
20%
15%
10%
5%
0%
Labor Force Participation 2006-2015(5)
Puerto Rico Unemployment Rate 2006-2015(4)
20%
70%
16.4%
14.4%
16%
12%
10.6%
12.1%
Puerto
Rico
9.6%
8%
4%
14.2% 13.8%
11.8%
8.1%
4.6%
5.8%
6.2%
5.3%
United
States
Average
0%
(2)
(3)
66%
66%
65%
64%
United
States
Average
64%
64%
63%
63%
42%
41%
41%
40% Puerto
55%
45%
49%
49%
47%
46%
44%
43%
40%
Rico
35%
2006 2007 2008 2009 2010
(1)
66%
60%
50%
7.4%
66%
65%
2011
2012
2013
2014
2015
Reflects percentage of people working or looking for work over the total population over 16 years (4)
of age.
(5)
U.S. Department of Labor. Employment as of July 2016 and population as of July 2015.
U.S. Census Bureau.
2006 2007 2008 2009 2010
2011
2012 2013 2014 2015
Bureau of Labor Statistics (Non-Farm Payroll Employment Survey).
Puerto Rico Fiscal Authority Agency and Financial Advisory Authority. U.S. figures from the Bureau of
Labor Statistics Current Population Survey and represent January values.
43
The Commonwealth Must Implement Structural Reforms to Increase
Labor Demand and Participation
Only 40% of Puerto Rico’s adult population (vs. 63% in the U.S.) is employed or looking for
work. A significant portion of the population is either receiving welfare, informally employed
or both. The Commonwealth must adopt pro-growth labor market policies, implement an
earned income tax credit program and reform welfare programs
The Puerto Rico private labor market is subject to federal labor regulations and unique local regulations such as 8hour work days based on calendar days (instead of 24-hour periods) and mandatory Christmas bonus and
severance payments
For Puerto Rico to increase its competitiveness and labor participation, and cognizant of the fact that Puerto
Ricans can move freely to the mainland, the Commonwealth must review its labor laws in order to pursue two
dual objectives:
Preserve its revenue base
Increase labor participation rates
In the FEGP, the Commonwealth previously proposed to enact labor reforms that included:
paying overtime calculated based on hours worked in excess of 40 hours per week, easing
the process to waive the Christmas bonus, and limiting the mandatory severance to six
months. Puerto Rico’s continuing economic contraction and increasing outmigration
illustrates an urgent need not to reduce personal incomes of Puerto Rico’s residents, which
could induce further outmigration. Any labor reform must be evaluated in light of those
circumstances. Further, the Commonwealth believes that any reduction in the minimum
wage would be an incentive for people to migrate to the mainland
44
The Commonwealth Must Implement Structural Reforms to Increase Labor
Demand and Labor Participation (cont.)
Initiative
Establish
EITC
Welfare
Reform
Highlights
Establish an EITC that targets families with
children, headed by working age persons, to
stimulate employment among low-wage workers,
reduce informal economy activities, bring families
into the tax system and offset sales tax regressivity
Invest ~$150 million per year in EITC program
Former Commonwealth EITC program (2006-2014)
did not differentiate among claimants by filing status,
presence of dependents or age of the tax filers
Reform Nutritional Assistance Program (“NAP”)
Benefits
Modify NAP income thresholds for the
Commonwealth so that program participants
experience a more gradual and income-targeted
reduction in NAP benefits when entering the
workforce to eliminate the current cliff effect on
benefit reduction
Apply to US Department of Housing and Urban
Development (“HUD”)’s “Moving to Work” program
to receive waivers of rules that govern public
housing and federal Section 8 voucher program
Program’s goal is to give incentives to families with
children, where the head of household is working,
seeking work, or is preparing for work to obtain
employment, become economically self-sufficient and
increase housing choices for low income families
After receiving waiver, local Housing Department to
develop rent structures that allow residents to
increase their earnings through work without penalty
Apply to HUD’s “Jobs Plus Pilot Program”
Program incentivizes employment through incomedisregards for working families, and provides a set of
services designed to support work including employer
linkages, job placement and counseling, educational
advancement, and financial counseling
45
The Plan Must Set Forth Reforms Designed to Reverse Recent Dramatic
Declines in Private Sector Investment
Following the full phase-out of Section 936 in 2006, private investment in Puerto Rico has declined
dramatically. Today, private investment as a percent of GNP(1) is nearly half of the level in 2006, when the
phase out of Section 936 began. Furthermore, Puerto Rico has not created an attractive platform to attract
and replace foregone investments
Puerto Rico’s Nominal Gross Fixed Investment – Private Sector (Construction, Machinery & Equipment) 2006 to 2015(2)
($ millions)
10,000
9,000
(20%)
8,000
7,000
6,000
Private
Machinery and
Equipment
5,000
4,000
3,000
Private
Construction
2,000
1,000
0
2006
2007
2008
2009
2010
2011
2012
2013
2014
2015
Puerto Rico’s 2016 Ease of Doing Business Ranks (Overall Ranking Out of 189 Countries)(3)
1 64
1 35
1 34
57
Overall
Ranking
(1)
(2)
(3)
57
Construction
Permits
By Final Demand Category.
GDB Statistical Appendix.
World Bank Group Doing Business rankings.
Registering
Property
Paying
Taxes
Getting Electricity
46
Reduce Energy and Transportation Costs, Institute Pro-Growth Tax Regime and
Streamline Permitting to Foster Investment and Ease of Doing of Business
Puerto Rico has been losing competitiveness as measured by global reports produced by the World
Economic Forum and the World Bank, where it currently ranks worse than over 50 countries. To jumpstart
its economy, Puerto Rico must be equipped with a business-friendly environment that is conducive to
sustained economic growth
Initiative
Pass legislation to centralize and streamline
permitting process
Enact
Permit
Reform
Highlights
Pass legislation to centralize and streamline
permitting process
Centralize permit application processes in the
Office of Management of Permits (“OGPe”),
providing a single access point and electronic
permit interface for all agencies and municipalities
Provide for a 7-day agency response period for
“Categorical Exclusions” (e.g., minor lot
designation variations for low impact
environmental construction works); applications
deemed granted if agency has not ruled on permit
during said period
Require municipalities to adopt simplified uniform
general permitting regulations (“Reglamento
Conjunto”)
Adopt a joint general construction permit and
expedited application procedure for “low impact”
construction projects
Consolidate Environmental Quality Board, Solid
Waste Authority and Natural and Environmental
Resources Department in order to simplify and
streamline the environmental review process
47
Reduce Energy and Transportation Costs, Institute Pro-Growth Tax Regime and
Streamline Permitting to Foster Investment and Ease of Doing of Business (cont.)
Initiative
Implement Pro
Growth
Corporate Tax
Regime(1)
Enact Reform
to Stabilize
Energy Rates
Reduce
Transportation
Costs
(1)
Highlights
Enact legislation to amend Puerto Rico’s Internal
Revenue Code to implement flatter, lower-rate
corporate tax regime for both new and existing
companies
Reduce nominal corporate tax rates
Eliminate inefficient corporate deductions and tax
credits; eliminate or reduce alternative minimum tax
Enact legislation, after dialogue with existing
multinationals, to retain and attract foreign direct
investment
Develop a holistic island-wide energy strategy to
reduce and control energy rates to increase Puerto
Rico’s competitiveness and decrease the cost of
doing business
Restructure PREPA’s debt and operations to produce
cash flow relief to invest in necessary infrastructure
and stabilize rates
Seek P3 opportunities to upgrade existing generation
capacity and build new, efficient generation plants,
allowing PREPA to transition into a transmission and
distribution company
Depoliticize PREPA by attracting professional,
external management and directors
Ask U.S. Congress to repeal Jones Act’s
application to the Commonwealth in order to
reduce maritime transport costs to the island
Insist upon temporary administrative waiver from US
Government in energy related transports
Review current ground transportation regulatory
framework and associated costs
Impact of this measure is not incorporated in the model, as reform is being designed. But it presents another risk on the revenue projections of the Commonwealth.
48
Puerto Rico Should Utilize the Savings from its Efficiency Measures to Fund
Investment and Build a Liquidity Cushion to Promote Stability and Spark Growth
The Fiscal Plan includes measures to repay estimated outstanding third-party payables so that tax refunds
are no longer delayed and payables remain outstanding for a maximum of 60 days
The Commonwealth’s liquidity crisis has been exacerbated by the Commonwealth’s lack of “TRANs” financing
to cover intra-year working capital needs. Such needs have increased materially during the last decade due in
part to the assignment to COFINA of the first revenues from the SUT
The National Association of State Budget Officers produces semi-annual fiscal surveys, which indicate that cash
balances as a percentage of expenditures were approximately 9% from FY 2014 through FY 2017(1)
Paying local businesses for past services and paying tax
refunds in a timely manner will both stimulate the economy
and provide certainty that the Government will be able to
continue providing essential services
The Fiscal Plan calls for the Commonwealth to build
deposits in order to provide confidence to businesses and
residents that it will have sufficient reserves to maintain
uninterrupted essential services and respond to crises,
and not disrupt private sector activities
Projected Change in Tax Refund Payables and Other
Payables FY2017-FY2022(1) ($ millions)
Projected Deposit Balance at Beginning of FY20172022(3) ($ millions)
2017
2018
2019
2020
2021
2022
–
$1,600
($50)
$1,400
($100)
$1,200
$1,500
$1,286
$1,073
$1,000
($150)
$859
$800
($200)
$600
($250)
($272) ($272)
($293)
($300)
($350)
$431
$400
($272)
($272)
($272)
$200
-
Tax Refunds
(1)
(2)
(3)
$645
Change in Stock of Payables
2017
2018
2019
2020
Data analyzed for Puerto Rico includes Golf Coast States, excluding Texas. 2014 and 2015 data represent actual figures, 2016 are estimated and 2017 are recommended.
Includes police back pay.
Starting FY 2017 deposit balance represents estimated starting balance of the TSA and certain entities included in the Fiscal Plan.
2021
2022
49
Capital Expenditures Must Be Adequate to Maintain the Existing Infrastructure
Base
The Fiscal Plan includes spending on capital projects required to catch-up on deferred maintenance on
roads, bridges, buildings and other critical infrastructure
PREPA and PRASA are not included in the Fiscal Plan and incremental capital expenditures at those entities is also
necessary
Additionally, the amounts shown below are only for maintaining the Commonwealth’s current infrastructure and
complying with current regulatory regimes; the totals shown do not include new infrastructure projects aimed at
improving growth, which are discussed elsewhere
The “Base Capital Expenditures” shown below in FY 2017 are based on the OMB budget after deducting estimated
federal funding. FY2018-2026 in the Base Projections are based on a review of recent historical data, while spending
on existing infrastructure in the measures is based on a set of specifically identified projects needed for maintenance
and judgement related capital expenditures. The grey amounts correspond to the incremental total spending
required for the specific projects over the Base Capital Expenditures
Projected Necessary Base Capital Expenditures and Incremental Non-Growth Capital Expenditures, 2017-2026
$1,000
($ millions)
$900
Incremental Non-Growth Capital
Expenditures
$800
Base Capital Expenditures
$700
$528
$397
$600
$273
$500
$400
$300
$104
$106
$108
$110
$112
$141
$200
$100
$103
$400
$407
$415
$422
$429
$437
$445
$453
$462
2018
2019
2020
2021
2022
2023
2024
2025
2026
$283
2017
50
Plan Must Also Invest in Strategic, Growth Enhancing Infrastructure
Puerto Rico’s economic growth will be driven by investing in significant infrastructure projects that improve
and facilitate transportation (roads and highways), modernize airport and port facilities and boost strategic
economic development sectors (e.g. life sciences, knowledge services, research, tourism)
($ millions)
Transportation
Ports/Airports
Industrial
Research/
Education
Tourism
Total
Complete large-scale strategic projects to improve accesses and competitiveness
including the Northwest Corridor (PR-22 highway from Hatillo to
Aguadilla), the redevelopment of Roosevelts Roads, and the Caguas
Commuter Rail
1,406
Attract economic development, private investment, and tourism by expanding the Port
of the Americas value added zone, improving the Aguadilla airport, and
expanding the Panamericano docks to attract Quantum-like mega cruise ships
234
To effectively compete in the world stage, strategic investments are needed in
industrial parks and key economic sectors including Aerospace and Defense,
Life Sciences, Knowledge Services, Agriculture and other sectors
408
Establish the UPR as a prominent scientific research center to provide a boost to the
local economy (Molecular Science Complex, Mayaguez Campus, Medical
Science Campus, Other)
289
235
Position Puerto Rico as one of the premiere travel destinations of the world for local,
domestic and foreign travelers by supporting the financing of 9 hotel construction
projects currently on hold
2,57 2
51
Plan Identifies Strategic Projects Aimed at Promoting Growth
Puerto Rico would need to invest $2.6 billion in these projects in addition to any potential federal or private
funds
1 ,406
1 ,027
($ millions)
Transportation
Ports/ Airports
17
355
7
PR-22
PR-18
Caguas
Roosevelt
Expansion
Improvements Commuter Rail Roads Parcel 3
(NW Corridor)
Improvements
80
Aguadilla
Airport
66
42
Army Terminal Panamericano
Dock
Total
234
27
14
4
Port of the
Americas
Tourism Pier 4
Isla Grande
Airport
Total
408
Industrial
1 31
Life Sciences
1 01
96
75
Knowledge
Services
Aerospace
Agriculture
5
Other
Total
289
Education
Tourism
1 20
62
59
41
7
Molecular
Science
Complex
Mayaguez
Campus
Medical Science
Campus
Research
Laboratories
Aerospace
Institute Aguadilla
1 24
1 07
East Region
# Hotels
2
North Region
6
Total
235
4
South Region
1
Total
9
52
Commonwealth’s Investment Program Should Be Complemented by Strategic
Investments in the Island’s Utilities That Support Long-Term Competitiveness
PREPA and PRASA’s capital improvement programs are essential elements of the
Commonwealth’s long-term growth and competitiveness
Independent public enterprises not included in the Fiscal Plan, such as PREPA and PRASA, will separately
undertake significant capex programs (either directly or through P3s):
PREPA plans to invest more than $4.6 billion over the next ten years to upgrade existing infrastructure and invest
in strategic projects such as the Aguirre Offshore Gas Port (“AOGP”)
PREPA’s capex includes projects for:
Maintenance capex (transmission & distribution, generation & others) – $2.7 billion
Investment capex
New Units /Repowering – $1.1 billion,
“AOGP” – ~$470 million
Investments in transmission & distribution – ~$300 million
PRASA also contemplates finance approximately $3 billion in capex during the next ten-years
PRASA’s capex includes projects for:
Water/waste water infrastructure renewal and replacement – $1.4 billion
Environmental compliance – $540 million
Meter replacements, fleet renewal and technology – $500 million
Water loss control, quality assurance and others – $620 million
Note that the development of the AOGP, as well as other major capex projects, is subject to certain material risks, including obtainment of necessary permits and final approval by the
Puerto Rico Energy Commission.
53
Public Private Partnerships Should Be Leveraged to Improve Operations, Boost
Private Sector Participation and Fund Necessary Capital Spending
LMM International Airport and other P3 transactions demonstrate that public private partnerships are a
viable model and an effective tool to develop necessary infrastructure, reduce operational costs and
improve services. Potential P3 projects are included below. Due to uncertainty regarding timing, financial
impact, and economic viability, the effect of these P3s is not incorporated herein, implying there could be
additional upside to the Fiscal Plan
Concession remaining toll roads, including PR-20, PR-52 and PR-66 in consultation with U.S. Department of
Transportation
Improve, intra-Island connectivity, road and bridge quality and safety
Continuous investment in roads’ maintenance would be mandatory as set forth in a Concession Agreement
Concessions would help transform HTA into a contract administrator
Merge Public Building Authority and Office for the Improvements of Public Schools (“OMEP”)
Transform PBA into a more efficient and effective public corporation and outsource services
Consider transferring the construction function to PRIFA to avoid duplicity of functions and gain efficiencies
Concession maritime transport and bus system operations
Complete ongoing procurement process for the operation and maintenance of the public maritime
transportation services and the metropolitan bus system
Evaluate potential concessions for ports and airport operations or facilities, and work with the Federal Aviation
Administration (“FAA”) to consolidate underutilized or geographically unnecessary airports
54
Core Principles of the Fiscal Plan
5. Protect Vulnerable Stakeholders
55
As a Result of Elevated Poverty Levels, Nearly Half the Population Is Dependent
on the State Healthcare System
Approximately 1.6 million Puerto Ricans, or just under half of the island’s population, are
beneficiaries of the government’s healthcare plan. Outmigration appears to have recently
lowered the number of residents dependent on the plan, but has also drastically reduced the
number of available physicians
Puerto Rico Population Insured under Public Health Programs(1) (millions)
1,750
45%
1,700
1,650
47%
48%
1,686
1,688
48%
(2)
N/A
50%
40%
1,666
1,642
30%
1,585
1,600
20%
1,550
10%
1,500
0%
2012
2013
2014
Total Eligible Members
2015
2016
% of PR Population
“We had 14,000 physicians in 2006. Now we have 9,000 physicians … The salary in the United States is three to
four times more” - Victor Ramos, president of the College of Physicians and Surgeons and Pediatricians(3)
According to a survey by the Puerto Rico Hospitals Association, 76% of hospitals have struggled to find and hire
specialists(3)
(1)
(2)
(3)
Puerto Rico Department of Health. https://medicaid.pr.gov/Statistics.aspx. Represents total eligible members under Medicaid, CHIP, Estatal, and Estatal (Otros). Total eligible members as of July 1 of each
year shown.
Puerto Rico population data for FY 2016 not yet available as of the date of this presentation.
Hospitales, Publicacion Oficial de la Asociacion de Hospitales de Puerto Rico, “Dos Logros Historicos en el Trato de Medicare a Puerto Rico,” 2016. http://hospitalespr.org/revista_pdf/revista_feb16.pdf.
56
The Healthcare System Suffers the Burden of Inequitable Treatment Under U.S.
Health Care Laws and Is Struggling to Provide Adequate Care
Puerto Rico’s Medicaid and other healthcare reimbursement amounts are capped annually
even though no such cap is applicable to the states. Today the healthcare system is
struggling to provide adequate care to Puerto Rico’s residents and faces increasing
challenges due to the Zika epidemic
According to a study conducted by the Catholic University of Puerto Rico on a
sample of 600 people, many residents have experienced problems with long
wait times in primary care facilities and hospital emergency rooms as
well as with the lack of physician availability(1)
“Puerto Rico is in the midst of a Zika epidemic. The virus is silently and rapidly
spreading in Puerto Rico… this could lead to hundreds of infants being born with
microcephaly or other birth defects in the coming year. We must do all we can to protect
pregnant women from Zika and to prepare to care for infants born with microcephaly”(2)
-Lyle R. Petersen, M.D.,
M.P.H, Incident Manager for CDC’s Zika Response and Director,
Division of Vector-Borne Diseases
According to a survey by the Puerto Rico Hospitals Association, 57% of
hospitals have shut down entire floors, 36% have fired employees and
66% have been forced to structure payment plans with
suppliers(3)
The Fiscal Plan that Puerto Rico will not cut spending to the already struggling healthcare system
even if Affordable Care Act funds are not replaced when they are depleted in FY 2018. A lack of
adequate healthcare not only will lead to a humanitarian crisis, but also provides an incentive for
additional residents to leave the island, further harming the economy
(1)
(2)
(3)
“La percepción de la calidad y la satisfacción con los servicios médicos hospitalarios en Puerto Rico,” June 24, 2015. Pontifical Catholic University of Puerto Rico.
https://gcu.universia.net/net/files/2015/6/24/hoja-de-datos-estudio-salud-final.pdf.
“Zika infections increasing rapidly in Puerto Rico,” July 29, 2016. Centers for Disease Control and Prevention. http://www.cdc.gov/media/releases/2016/p0729-zika-infections-puerto-rico.html.
Hospitales, Publicacion Oficial de la Asociacion de Hospitales de Puerto Rico, “Dos Logros Historicos en el Trato de Medicare a Puerto Rico,” 2016. http://hospitalespr.org/revista_pdf/revista_feb16.pdf.
57
Puerto Rico’s Education System Struggles in Part Due to Low Per Pupil Expenditures
and the Need to Direct Funds Towards Food and Support Services
In addition to spending less per student than in the U.S., Puerto Rico spends a greater
percentage on non-instructional assistance, such as food and other support, due in part to
the poverty of the student population. While the U.S. spends $6,543 on instruction per
student, Puerto Rico is able to spend only $3,522 or less than 54% of that amount per student
Total Current Expenditure per Pupil per type of Expense (%)(1)
100%
90%
80%
70%
60%
$10,763
$7,981
22%
20%
Administration
and Operations
4%
3%
5%
14%
Food services
6%
10%
5%
50%
7%
40%
30%
Other Support
Services
Instructional Staff
Support
Student Support
Services
61%
44%
20%
10%
Instruction
In a message to Speaker of the House
Paul Ryan, R-Wisc., Puerto Rico
Education Secretary Rafael Roman
Melendez:
“The programs I oversee are in distress as
there is simply insufficient cash to address
the needs of 379,818 children that attend
public schools in Puerto Rico”…“children
are paying the consequences as a result of
the congressional inaction, such as
payments for classroom services,
transportation, breakfast and lunch food
supplies, “which are often the only meals
some children consume during the day”(2)
0%
US
(1)
(2)
PR
The National Center for Education Statistics’ Revenue and Expenditures for Public Elementary and Secondary Education FY 2013.
Latin Post article “Puerto Rico Education Secretary: Debt Crisis Rapidly Affecting Children's Health, Safety, Education Experience” published March 23, 2016.
58
Lower Levels of Per Student Spending Have Contributed to Poor Educational
Outcomes
Puerto Rico’s students have shown significantly lower math assessment outcomes relative to
the United States
2015 Fourth Grade Public School Student Math Assessment(1)
350
Mass.
U. S.
D. C.
P.R.
350
(out of 500)
330
330
310
310
290
290
270
270
Advanced
251
250
240
230
231
250
Proficient
230
210
210
183
190
190
170
170
150
150
Mass.
U.S.
D.C.
Basic
P.R.
(Highest State)
2015 Eighth Grade Public School Student Math Assessment(1)
350
330
310
290
270
250
230
210
190
170
150
1
(out of 500)
2
3
4
350
330
Advanced
297
310
281
290
263
270
250
222
230
210
Proficient
Basic
The Fiscal Plan recognizes
that the Department of
Education could deliver
services in a more efficient
manner that would result in
cost savings. However, those
savings must come from
narrowly tailored policies
that do not further harm the
already struggling
educational system, in
particular given the reliance
of impoverished students on
non-instructional support
spending. An educated
populace is critical to
retaining residents,
boosting labor productivity
and attracting private
investment
190
170
150
Mass.
(Highest State)
(1)
U.S.
D.C.
P.R.
The Nation’s Report Card’s National Assessment of Educational Progress in Mathematics, 2015.
59
Puerto Rico Residents Are Confronting Higher Crime Levels Than Any State
Despite recent improvements, key crime statistics, such as homicide rates, remain higher
than in any state
Annual Homicide Rate (per 100,000 people)(1)
35
30
25
20
Puerto Rico
17
15
10
5
United States
5
–
2006
2007
2008
2009
2010
2011
2012
2013
2014
2015
“High unemployment rates, coupled with a strategic geographic location (mid-point between the United States and South America) make
the islands attractive to illicit drug traffickers and money launderers”
-U.S. Department of Justice, Drug Enforcement Administration(2)
“Due to enforcement successes by Dominican authorities and interdiction efforts by the U.S. Coast Guard, traffickers have been forced to send multiton quantities of cocaine from Venezuela and Colombia directly into Puerto Rico, bypassing the Dominican Republic. This resulted
in…increased smuggling movements directly to Puerto Rico”
-U.S. Department of Justice, Drug Enforcement Administration(2)
In the face of crime rates higher than the 50 states and police officer pay already well below the
average of the 50 states, the Fiscal Plan does not include public safety spending cuts. Rising crime
makes businesses less likely to invest in the island and makes individuals more likely to leave
(1)
(2)
Federal Bureau of Investigation, Uniform Crime Report.
2015 National Drug Threat Assessment Summary, November 4, 2015, U.S. Department of Justice, Drug Enforcement Administration. https://www.dea.gov/docs/2015%20NDTA%20Report.pdf.
60
The Elderly Face the Risk of Losing Their Already Meager Pension Payments
The ability of the government pension fund to honor benefits to elderly retirees (the levels
of which are far below those in the states) is threatened by rapidly diminishing plan assets
The large unfunded liability of the pension system threatens pensioners, who receive significantly less than the average
pensioner in the 50 states. In fact, 30,000 pensioners receive only the minimum monthly pension payment of $500
The Fiscal Plan includes a measures whereby the assets of the ERS Defined Benefit (“DB”) and Defined Contribution
(“DC”) plans are separated prospectively, which protects future proprietary member contributions from potential
insolvency and the unfunded liability growing rapidly in the future
While such a measure removes a source of financing for DB plan benefits and thus requires additional contributions to
the system by the Commonwealth in the early years, this expense is offset in part by stretching the AUC payment period
over a 30-year period (until 2043, as opposed to 20 years, or 2033, under current law)
Average Pension Benefit Payments Per Beneficiary(1)
Actuarial Valuations of Puerto Rico’s Retirement Systems(2) ($ billions)
35
$50,000
30
30
$42,591
25
$43.6 billion net pension liability
20
13
15
$32,900
10
$26,455
$25,000
5
0.4
Employees Retirement
System
$14,112
Puerto Rico
Illinois
Michigan
2018
USA
Average Payment per Beneficiary
(1)
(2)
(3)
Judiciary Retirement
System
Impact of Pension System Reform Measures vs. Base Projections(3) ($ mm)
2017
$0
Teachers Retirement
System
2019
2020
2021
2022
2023
2024
2025
2026
(116) (116) (116) (116) (116) (116) (116) (116)
(166) (166)
State Employee Retirement System of Illinois. Teachers Retirement System of Illinois. Retirement System of the City of Detroit. Michigan Annual Report. Annual Survey of Public Pensions.
Actuarial estimates as of July 30, 2014. November 2015 Commonwealth Operating Report.
Illustratively includes the reduction in the estimated portion of AUC as result of the exclusion of debt service, which is estimated to amount to approximately $80 million over the 10-year projection period.
61
Health, Public Safety, Education and Pension Costs Are Expected to Make Up
Approximately 71% of 2017 General Fund Expenditures
The challenges facing the healthcare, education and pension systems, combined with the
need to continue providing adequate funds for public safety, illustrate the difficulty in finding
areas for potential cost reduction as these areas are expected to account for approximately
71% of the Commonwealth’s budget
Note that FY 2017 approved General Fund budget data is displayed below
General Fund 2017 Approv ed Budget
$ thousands
General Gov ernment
Social Welfare
Economic Dev elopment
Infrastructure
Health
Public Safety
Legislativ e Assembly
Labor Affairs
Education
Culture and Recreation
Legal
Prosecutor's Office
Election Process
Debt
Entity Deposit Funding
Retirement Sy stem
Budget and Emergency Fund
Legal Responsibility Fund
Utilities
Debt
TRANs
T otal
% of T otal
3.1 %
3.8%
1 .3%
2.7 %
1 5.7 %
1 8.4%
2.3%
0.2%
28.4%
0.9%
0.2%
5.0%
0.4%
0.0%
2.9%
8.8%
2.4%
1 .3%
1 .9%
0.0%
0.3%
100.0%
Retirement systems account
for 8.8% of all expenses in the
2017 approved General Fund
Budget.
Note that other line items may
fund payroll that results in
further contributions to the
retirement system not
accounted for in the 71%
Source: Office of Management and Budget, Summary of General Fund Expenditures by Spending Area (FY 2017 Approved Budget). Note that debt service in the FY 2017 budget has been reduced.
62
Cooperative Credit Unions, with Significant Exposure to the Commonwealth’s
Debt, Must Be Protected in Any Restructuring
Puerto Rico’s cooperative credit unions (the “Coops”) hold deposits for roughly 1/3 of all
Puerto Ricans and have investment portfolios that are approximately 75% invested in
Commonwealth securities (with more than 46%(1) of the combined Coop government
investment portfolio invested in GDB notes)
Approximately 116 Coops function as retail outlets for financial services for about one million consumers
that retain accounts on island. As of March 2016, total insured “shares” and deposits in the Coops
amounted to approximately $8.2 billion
Due to the recent defaults on GDB and GO debt, among others, the Coops are expected to sustain
substantial losses in their investment portfolios and will likely suffer additional losses if, as expected, the
Commonwealth ultimately executes a broader restructuring of its debt
The consequences of an undercapitalized Coop system and the Coop failures that could result include:
Loss of deposits for roughly 1/3 of Puerto Ricans
Limited resources available to Coops to continue to lend and drive economic growth
Loss of jobs for employees of Coops that fail
Potential collapse of the Coop system as depositors move funds to FDIC-insured institutions
The Fiscal Plan must also protect credit union depositors, which are generally low-income, as
well as the cooperative banking system more generally, conditioned on recapitalization plans
and effective governance reforms. The cost of this protection is estimated at approximately $1.2
billion, which is not included in the Fiscal Plan, but must be accounted for in any debt
restructuring
(1) Estimated system-wide holdings based on the G25 Group’s holdings of Commonwealth securities.
63
Core Principles of the Fiscal Plan
6. Create a Sustainable Debt Level That Allows for Growth
64
The Commonwealth Must Achieve a Sustainable Debt Stock
As the Commonwealth economy has contracted, its debt burden has grown by ~$26 billion since FY 2006, with the
result that the aggregate debt stock now exceeds the entire GNP of Puerto Rico
Puerto Rico Public Sector Debt(1)(2)
($ billions, as of June 30)
$80
70
$70
70
72
71
69
1.4
64
62
58
$60
Public Sector
Debt
53
$50
68
46
43
Defaulted Debt
(principal and
interest)
Nominal GNP
$40
$30
2006
2007
2008
2009
2010
2011
2012
2013
2014
2015
7/2/2016
Rising debt and declining real GNP contributed to ratings downgrades and increases in debt yields, meaning any
refinancing had to be done at higher rates. Ultimately the debt burden became so high and the economic trend
became so negative that the Commonwealth lost market access
Yield to Worst of Illustrative GO, GDB non-Guaranteed, HTA ’98 Senior and COFINA Senior and Subordinate Bonds(3)
50%
40%
30%
20%
As of end of FY13:
5.2% GDB non-guaranteed ’26
5.5% HTA Senior ’98 due ’25
6.0% COFINA Subordinate ’42
5.0% GO ’33
5.25% COFINA Senior ’57
HTA Sr.
YTW
6.4%
5.9%
5.7%
5.8%
5.3%
As of 6/30/16:
5.2% GDB non-guaranteed ’26
5.5% HTA Senior ’98 due ’25
5.0% GO ’33
6.0% COFINA Subordinate ’42
5.25% COFINA Senior ’57
GO
GDB
COFINA Sr.
COFINA Sub.
PROMESA signed on 6/30/16
10%
0%
12/31/11
(1)
(2)
(3)
YTW
23.7%
30.2%
9.1%
13.3%
8.1%
6/30/12
12/31/12
6/30/13
12/31/13
6/30/14
12/31/14
6/30/15
12/31/15
6/30/16
Balances shown do not include the accreted value of capital appreciation bonds. Balances are on a Puerto Rico fiscal year basis (July to June) and sourced from Puerto Rico’s Public Debt Monthly Report
(Tiered Operational Management Information System). Values exclude GDB and MFA bond issuance and include loans from these entities to other Commonwealth entities. 2016 balance as of July 2, 2016
and calculated in a manner consistent with prior reporting per data provided by the Commonwealth. Default balance assumes no interest on unpaid amounts.
Does not include unfunded pension liabilities. Based on valuation reports as of June 30, 2014, the Employees Retirement System, Teachers Retirement System and Judiciary Retirement System (“JRS”) net
pension liabilities were $30 billion, $13 billion and $442 million, respectively. See the May 7, 2015 Commonwealth of Puerto Rico Quarterly Report for more details.
Data as provided by Bloomberg.
65
The Commonwealth Must Achieve a Sustainable Debt Stock (cont’d)
Without access to capital markets to fund its deficits and refinance its maturing debt, the Treasury Single Account (“TSA”) (1) balance
fell to approximately $244 million at the end of FY 2016, as compared to approximately $780 million(2) of direct General Obligation
debt service due on July 1, 2016. The Commonwealth thus defaulted on GO debt as well as debt of certain other issuers,
an event creditors had been specifically warned may occur (from the 2014 GO offering statement: “If the Commonwealth’s
financial condition does not improve, it may need to implement emergency measures that may include a restructuring,
moratorium or other actions affecting creditors’ rights”)
Total Debt Service Payments Missed in FY 2016 (including July 1, 2016 payments)(3) ($millions)
GO
GDB(4)
PBA
PFC
PRIFA Rum
HTA(5)
Total
Amount
Due
Amount
Paid
Amount
Not Paid
$1,125
1,064
276
94
113
322
$346
664
251
1
–
318
$779
360
25
93
113
4
$2,995
$1,580
$1,375
Dates of Missed Payments
July 1, 2016
May 1, 2016
July 1, 2016
August 1, 2015 to July 1, 2016
January 1, 2016 and July 1, 2016
July 1, 2016
The default occurred despite the Commonwealth’s austerity measures and certain extraordinary liquidity measures, such as delaying
payments to suppliers and critical infrastructure spending, all of which produced a drag on economic growth. It is only through a
return of economic growth that creditor recoveries can be maximized while the Commonwealth can also continue to
provide essential services to its residents. As such, a restructuring of outstanding debt to sustainable levels that allows the
Commonwealth time to implement the fiscal and structural policies outlined herein and to invest in its economy is an essential
principle of the Fiscal Plan
(1)
(2)
(3)
(4)
(5)
The Treasury Single Account is the Commonwealth’s operational bank account in which it deposits receipts from governmental funds except for blended component units (COFINA, PBA, PRIFA, etc.). Approximately $780 million represents
$1,125 million of total principal and interest due as of July 1, 2016.
Net of the escrowed amounts and capitalized interest amounts.
Amounts not paid represents amounts not paid by the Commonwealth and has not been reduced by amounts paid by insurers, if any. Excludes PRASA Rural Development bonds (reached forbearance agreement ahead of its payment on July 1,
2016) and GO Notes (line of credit from GDB to Treasury whose debt service on July 1, 2016 was not paid).
GDB unpaid debt service is net of $40 million of agreed upon maturity extension, which reduces the amount of unpaid debt service.
Unpaid amounts for the HTA bonds reflect missed payment s on the 1998 Resolution Bonds, Series 1998 Subordinate Bonds.
66
Debt of Entities Included in the Fiscal Plan
Per the Oversight Board, “the Commonwealth’s Fiscal Plan shall include all agencies,
departments, offices, administrations, programs and functions that are part of the central
government” as well as specifically enumerated bond issuer entities, as outlined below
Inclusive of missed interest payments and accrued interest on capital appreciation bonds (“CABs”, e.g., zero
coupon bonds), these entities have approximately $50 billion of bonds and third-party loans outstanding (i.e.,
excluding GDB or other intergovernmental loans(1))
Summary of Debt Outstanding for Plan and Non-Plan Entities(2) ($ millions)
Bond
Principal (2)
In addition to
these debt issuers,
all of the
Commonwealth’s
retirement
systems are also
incorporated into
the plan
Debt Issuers
Included in the
Fiscal Plan
1.
2.
3.
4.
Issuers Specifically Identified By the Board
GO
$1 2,47 0
COFINA
1 5,21 3
(7 )
HTA
4,253
PBA
3,995
5.
6.
7.
8.
GDB(8)
ERS
PRIFA (9)
PFC
9. UPR(1 0)
1 0. PRCCDA
1 1 . PRIDCO
Priv ate
Loans (5)
T otal Bonds
and Priv ate
Loans
Memo: Loans
from GDB/MFA/
& CW Entities (6)
Memo:
Total Entity
Indebtedness
$49
2,082
63
10
$353
–
1
–
$24
–
–
–
$1 2,896
1 7 ,294
4,31 7
4,005
$1 69
–
1 ,7 34
1 82
$1 3,066
1 7 ,294
6,051
4,1 87
3,81 1
2,948
1 ,926
1 ,091
–
1 93
1 60
–
–
–
72
57
204
–
–
–
4,01 5
3,1 41
2,1 58
1 ,1 47
–
–
49
–
4,01 5
3,1 41
2,207
1 ,1 47
496
386
1 54
–
–
5
–
–
–
0
–
–
496
386
1 59
76
1 45
78
57 3
532
237
Other Debt Issuers Prim arily Supported by Central Gov ernm ent Rev enues
1 2. AMA
–
–
–
1 3. Other Central Gov 't Entities (1 1 )
226
–
–
28
16
28
242
–
3,521
28
3,7 63
37
590
–
85
–
2,7 1 1
8,992
4,57 1
1 ,439
581
86
4,542
T otal Entities in Plan
Debt Issuers
Ex cluded
From the
Fiscal Plan
CAB
Missed Bond
Accretion (3)
Interest (4)
1.
2.
3.
4.
5.
6.
Debt Issuers Not Incl. in the Plan
PREPA (1 2)
PRASA (1 3)
Children's Trust
HFA
PRIICO
Municipality Related Debt (1 4)
T otal Entities Outside of Plan
T otal
$46,969
$2,561
$483
$27 2
$50,286
8,259
3,948
1 ,1 51
496
–
632
$14,485
–
28
288
–
–
–
$316
–
–
–
–
–
–
–
696
4
–
–
86
1 ,200
$1,986
8,955
3,981
1 ,439
496
86
1 ,832
$16,7 87
$61,454
$2,87 7
$483
$2,259
$67 ,07 3
Memo: Bridge to Public Sector Debt
Less: CAB Accretion
Less: Missed Bond Interest
Less: GDB Bonds (15)
Less: MFA Bonds
Plus: Loans From GDB/MFA/Other CW Entities
Public Sector Debt
(2,87 7 )
(483)
(3,7 66)
(61 8)
9,37 9
$68,7 07
Note: All debt balances shown are preliminary, unaudited estimates based on bonded debt outstanding as of July 2, 2016 and loan balances of June 30, 2016.
(1)
Note that balances also exclude MFA loans (though there are no MFA loans to entities included in the Fiscal Plan). Also note that in the Fiscal Plan bonds held by GDB are eliminated in consolidation.
(2)
See the appendix for footnotes.
67
Debt of Entities Included in the Fiscal Plan All Rely, Directly or Indirectly, on the
Commonwealth’s Taxing Authority
All of the entities included in the Fiscal Plan rely on the Commonwealth central government’s taxing
authority, either directly from tax revenues allocated by law or indirectly from appropriations included in the
Commonwealth’s General Fund (the Commonwealth’s primary operational fund)
Certain entities that have issued debt backed by allocated tax revenues have revenues that are either explicitly
“available revenues” that may be diverted to pay Commonwealth general obligations (HTA, PRCCDA, AMA,
PRIFA) or have been alleged in litigation by general obligation debt holders to be an “available revenue”
(COFINA)
Central Government Collected Revenues
General Fund Directly Pays Debt Service
General Obligation Debt
Reliant on General Fund Appropriations
Payable from Allocated Tax Revenues
COFINA
HTA
PRIFA
PRCCDA
AMA
PBA
93%(1) of revenues from the lease payments budgeted in the GF (also fully guaranteed by the CW)
GDB
Appropriations made to pay loans owed by CW entities to GDB, which GDB uses to pay its own debt
The Commonwealth is typically responsible for approximately 79%(2) of the total AUC contributions to ERS (of
which the central government contributes approximately 62%) and nearly all of the contributions to TRS and JRS
PFC
Directly reliant on appropriations to pay debt service; does not have any other revenues
UPR
Receives ~74%(3) of annual revenues from General Fund appropriations and allocated tax revenues
PRIDCO(4)
Receives withholding and rum taxes; rental revenue dependent on ability to grant tax subsidies
Consists of certain discretely presented non-major component units, including entities such as ADEA that receive
transfers from the central government
ERS
Other
(1)
(2)
(3)
(4)
Source: Conway MacKenzie PBA 5-Year Projections dated July 20, 2015. Percentage shown (93%) represents FY 2016 lease payments made by agencies in the General Fund (i.e., excluding agencies outside the General Fund and municipalities).
Percentages shown per ERS and includes the AUC contributions for component units that are included in the Fiscal Plan and does not include municipalities. (67% to 70%) represent special law, AUC, and employer contributions from the General Fund as a
percentage of total contributions, excluding investment income.
Source: Conway MacKenzie UPR projection included in FEGP dated January 18, 2016. Percentage shown (74%) represents FY 2016 Commonwealth appropriations and dedicated tax revenues including collections from slot machines (excluding federal transfers and
Pell Grant funding) as a percentage of total cash inflows (excluding debt proceeds which are non-recurring). Excluding slot revenues, UPR receives 70% of revenue from General Fund appropriations.
While PRIDCO receives appropriations for portions of the non-resident withholdings tax and rum excise taxes, such revenues are not specifically dedicated to the payment of debt service. However, PRIDCO’s rent revenues are attributable to its ability to provide tax
subsidies to private sector companies.
68
There is Significant Cross-Ownership of Commonwealth Debt
In addition to the reliance of many Commonwealth entities on a single tax base, it is also important to note
that there are many holders that individually own bonds of multiple Commonwealth entities
Puerto Rico has hired Bondholder Communications Group (“BondCom”) to develop a registry of ultimate beneficial
owners (“UBOs”) of the Commonwealth’s bonds; to date over 350,000 UBOs have been identified, representing 68% of
the Commonwealth’s total bonded debt
Shown below is a select set of large mutual funds that own significant amounts of bonds of numerous Commonwealth
issuers, illustrating the large number of crossholdings
Estimated Holdings by Credit of Certain Large Funds(1) ($ millions)
Holdings ($ )(1)
Large Mut ual
Large Mut ual
Large Mut ual
Fund Holder #1 Fund Holder #2 Fund Holder #3
Ent it y
Holdings (%)
Tot al
Fiscal Plan Ent it ies
GO
$51 6
$1 ,045
$2 3 1
$1 ,7 93
GDB
–
<1
–
0
PBA
172
7 02
18
891
PFC
1 34
41 7
–
551
1 ,3 7 1
2 ,060
882
4,3 1 3
COFINA
PRIFA
9
41 1
6
42 7
(2)
–
1 96
–
1 96
PRCCDA
–
1
–
1
PRIDCO
–
–
–
–
HTA
–
3 92
27
41 8
ERS
2
–
–
2
MFA
–
59
–
59
UPR
Fiscal Plan Ent it ies Tot al
$ 2,205
$ 5,283
$ 1,164
PREPA
803
969
178
PRASA
–
42 0
21 6
63 6
CTF
61
1 ,068
–
1 ,1 2 9
HFA
6
<1
–
6
AFICA - Guay nabo
–
6
–
6
Ent it ies Excl. From Fiscal Plan Tot al
Tot al
(1)
(2)
$ 8,652
BondCom’s work is ongoing. In
addition to the three large mutual
funds shown here, over 7,300 other
retail and institutional investors
have been identified that own bonds
issued by five or more Puerto Rican
issuers. In aggregate, these crosscredit investors are estimated to
hold over $12.7 billion of debt issued
by various Puerto Rico issuers (in
addition to the holdings of the
mutual funds shown)
1 ,949
$ 87 0
$ 2,463
$ 394
$ 3,7 26
$ 3,07 5
$ 7 ,7 46
$ 1,557
$ 12,37 8
Information shown based on data provided by Bondholder Communications Group (“BondCom”). Balances as of September 28, 2016 and include CAB accretion as of June 30, 2016. Bondcom is in the midst of updating the
registry to October 2016, and it is also expanding the registry’s coverage beyond the 68% portion included currently. As a result, these amounts are subject to change. Note that some of these holdings may be insured.
Includes bonds issued by AFICA – Desarrollos Universitarios, a component unit of the University of Puerto Rico.
69
Insurance Providers Also Have Exposure to Multiple Issuers
In addition to the cross-holdings of individual holders, certain monoline insurers also have
significant exposure to multiple entities
Monolines insuring Commonwealth debt include:
AMBAC Assurance Corporation (“AMBAC”)
Assured Guaranty (“Assured”)
Financial Guaranty Insurance Company (“FGIC”)
MBIA Inc./National Public Finance Guarantee Corporation (“MBIA”)/(“National”)
Syncora Holdings (“Syncora”)
Note that the total insured amounts as shown below are as listed in the most recently available insurer financial
statements. Reporting methodology may vary materially across insurer
Estimated Select Insurer Exposure Summary ($ millions)
Assured (1)
Entity
Commonwealth (GO)
MBIA (2)
FGIC (3)
AMBAC (4)
Sy ncora(5)
$1,615
$7 95
$27 9
$56
$218
HTA
COFINA
PRIFA
PBA
1,27 9
27 0
18
188
7 15
684
–
190
437
–
349
8
47 2
805
503
191
7
–
–
–
PRCCDA
UPR
PRIDCO
164
1
–
–
89
7
97
–
–
137
–
–
–
–
–
$3,535
$2,480
$1,169
$2,163
$225
7 44
388
387
–
1,354
–
–
26
–
–
–
–
–
–
–
–
241
–
–
29
$5,054
$3,860
$1,169
$2,163
$494
T otal Exposure to Fiscal Plan Entities
PREPA
PRASA
MFA
All Other
T otal Exposure
Note: Insurer exposure shown herein based on 2Q 2016 company filings and/or investor presentations. Excludes CIFGNA, which is pending a merger with Assured as of March 31, 2016.
(1)
Values represent net par outstanding. Includes CABs that reflect gross par amount at time the policy was issued.
(2)
Values represent gross par outstanding.
(3)
Values represent net par in force.
(4)
Data derived from Ambac Financial Group document titled "Puerto Rico Exposure Second Quarter 2016." Amounts shown based on a net par basis (net of reinsurance), including CABs which are reported at the part amount at the time of issuance of the insurance policy.
(5)
Data derived from Syncora Guarantee Second Quarter 2016 Highlights Investor Presentation dated September 21, 2016. Includes reinsurance and bonds purchased for remediation (which are reported at GAAP carrying value for the insured bonds). Excludes total
interest outstanding of $104.7 million as of June 30, 2016.
70
Puerto Rico Residents are Estimated to Hold at Least $6 Billion of
Commonwealth Bonds and Have Additional Coops Exposure
While due diligence into the exact amount of local holdings remains ongoing, based on
BondCom’s work to date it is believed that a sizeable portion of Commonwealth debt is held
on-Island, with holdings across the Commonwealth credits, but particularly concentrated in
the bonds that are not triple-tax exempt issued by COFINA, ERS, GDB, and PFC
Current Estimate of Local Holdings as Identified by Bondcom(1)
($ millions)
Issuer
GO
COFINA
HTA
PBA
GDB
ERS
PRIFA (2)
PFC
UPR(3)
CCDA
PRIDCO
PREPA
PRASA
CTF
MFA
HFA
T otal
Local
Local
Coop Holdings Non-Coop Holdings
92
1 81
3
39
369
4
4
63
–
<1
15
55
52
–
–
<1
$87 6
T otal Local
Holdings
307
2,642
54
242
986
1 ,224
16
204
2
11
72
305
21 6
<1
3
91
399
2,823
57
281
1 ,356
1 ,228
19
267
2
11
86
360
268
<1
3
91
$6,37 6
$7 ,252
In addition to the Coops, it is
currently estimated that at
least $6 billion of
Commonwealth debt is held
locally, illustrating the need to
promote economic growth so
as to maximize recovery for
these creditors. A
restructuring that provides
minimal recovery to local
bondholders is effectively an
austerity measure
Market information indicates that the Coop systems have exposure
of approximately $1.1 billion of Puerto Rico debt; the numbers above
represent only those CUSIPs identified by BondCom to date
(1)
(2)
(3)
Information shown above based on data provided by Bondholder Communications Group (“BondCom”). Balances as of September 28, 2016 and include CAB accretion as of June 30, 2016. BondCom is currently working to update the
bondwoner registrey to October 2016.
Excludes PRIFA BANs.
Include bonds issued by AFICA – Desarrollos Universitarios, a component unit of the University of Puerto Rico.
71
In Light of the Characteristics of the Commonwealth’s Outstanding Debt, Certain
Key Principles Must Guide Any Restructuring Offer
While including a specific debt restructuring proposal as part of the Fiscal Plan would be
premature at this time, there are a number of key principles that are necessary as part of any
debt restructuring proposal that aims for a sustainable level of debt service
PROMESA envisions an iterative process with the Oversight Board, specifically requiring that the final Fiscal
Plan include the recommendations of the Board and providing explicitly for a process for the Commonwealth to
submit multiple versions of the Fiscal Plan
Without having received the recommendations of the Oversight Board, it would be premature to propose a
specific debt restructuring proposal at this time
Principles
Considerations
A holistic solution is required to produce a sustainable debt level given the general reliance on the
Commonwealth’s taxing authority for debt service and the fact that single bondholders and insurers have exposure
to multiple credits
Actions by creditors to date have already proven the need for a holistic solution
Holistic
Solution
GO bondholders have instituted litigation alleging that the COFINA revenues are “available revenues” to pay
the GO and Commonwealth guaranteed indebtedness (e.g., PBA)
Insurers have instituted litigation challenging the “clawback” of certain revenues, which in turn could
influence the available revenues to pay the GO holders and Commonwealth guaranteed holders
Large mutual funds have challenged the efficacy and rationale of a public restructuring proposal made by
holders of COFINA senior bonds
A holistic solution is essential in order to permanently solve these intercreditor disputes so that the
Commonwealth is not bogged down in years of litigation that delay its ability to regain market access
To the extent possible, a debt restructuring should simplify the Commonwealth capital structure and rely on a
restructuring currency that is both free from embedded intercreditor conflicts and available to all creditors
72
In Light of the Characteristics of the Commonwealth’s Outstanding Debt, Certain
Key Principles Must Guide Any Restructuring Offer (cont’d)
Principles
Time and Capacity to
Invest in the Economy
and Implement Plan
Reasonable Maximum
Annual Mandatory Debt
Service
Creditors Become
Partners in Growth
Consideration Given to
the Impact on Local
Holders
Restrictions on New
Indebtedness
Considerations
The Commonwealth must be given a breathing space to invest in its economy and implement the reforms
outlined previously so as to spur economic growth
The early years of the Fiscal Plan are especially critical so as to stem the tide of outmigration from the island
and make the island attractive for private investment
Consequently, the debt service levels set should have lower or minimal cash debt service during the early years
of the Fiscal Plan (“payment-in-kind” or other such non-cash interest elements could be considered to protect
creditors)
The final debt service level cannot exceed the projected surplus before debt service in the final Fiscal Plan
Reasonable growth projections must be used for purposes of setting the offer size, though contingent payment
amounts tied to growth levels in excess of expectations could also be used to make creditors partners in trying
to promote economic growth
Debt service levels should be based on objective criteria consistent with those used by credit rating agencies so
as to facilitate, over time, a return to an investment grade credit rating
In return for being given breathing space to implement the Plan, creditors should share in the potential upside
if the benefits of the plan are realized or exceeded
A contingent value right or growth bond that pays creditors in the event growth targets set in the plan are
exceeded should therefore be considered as part of any debt restructuring
Given significant local holdings of Commonwealth debt, consideration must be given to the impact any
restructuring proposal will have on the economy
In particular, the coops must be given sufficient recovery, either through new debt or otherwise, to ensure that
they are adequately capitalized
The final restructuring offer must also include restrictions on how new indebtedness may be issued
Such restrictions must take into account all Commonwealth debt supported by tax revenues so that the debt
service burden on the Commonwealth economy as a whole is never again allowed to grow to extreme levels and
the Commonwealth can only issue debt commensurate with its ability to pay
73
Core Principles of the Fiscal Plan
7. Partner with the Federal Government to Generate Growth
74
Puerto Rico’s Economic Decline was Precipitated in Part by U.S. Policy
Decisions in the Mid-90s
The phase out of Section 936 of the U.S. tax code combined with expanded U.S. free trade
agreements may have contributed to the disappearance of over half of Puerto Rico
manufacturing jobs
As a result of Section 936’s tax benefits, the manufacturing sector in Puerto Rico had grown significantly, in
particular for firms, such as pharmaceutical companies, that could transfer patents to Puerto Rico and then
source income generated by those patents to Puerto Rico in order to receive tax credits under Section 936
Manufacturing sector growth took place in spite of Puerto Rico’s comparatively higher labor costs relative to
other, non-U.S. mainland manufacturing centers due to the applicability of U.S. minimum wage laws
In 1996, the U.S. enacted legislation to phase out Section 936 over a ten-year period, removing a key competitive
advantage Puerto Rico had in attracting business and foreign investment to the island
Manufacturing jobs immediately began to decline following the Section 936 phase out
Additionally, NAFTA which expanded the right to provide duty free imports to the U.S. (a right that had already
been enjoyed by Puerto Rico), had been signed two years prior, potentially contributing to the loss
Decline in Puerto Rico Manufacturing Payrolls(1)
180
160
140
(seasonally adjusted, all employees, in thousands)
161 156
151 146
144 139
123
120
118
119
118
112
108
100
80
103
97
The impact of the Section 936
phase-out demonstrates how U.S.
tax policy decisions can have a
significant impact on the
Commonwealth
89
86
85
78
76
75
73
60
40
20
0
(1)
Bureau of Labor Statistics State and Area Employment, Hours, and Earnings - January totals.
75
Today, Puerto Rico Faces a Fiscal Cliff That Federal Government Action
Could Help Resolve and Ensure a Virtuous Cycle
A replacement for ACA funding (potentially through providing Puerto Rico with
Medicare/Medicaid funding equivalent to that of the 50 states) is a critical element of
stabilizing Puerto Rico’s fiscal position
ACA funds provided to Puerto Rico are currently projected to be exhausted by FY 2018. After the
expiration of those funds, the Commonwealth would still receive healthcare funding from the U.S.
Federal Government, but at a much lower rate than the 50 states.
In addition, the Commonwealth’s Medicare Advantage match is lower than 41 states and the
Commonwealth is subject to a federal spending cap on Medicaid dollars of approximately $300
million (excluding $150 million for the Children’s Health Insurance Program (“CHIP”)) - there is
no cap for U.S. states
Impact of ACA Funding Loss(1) ($ millions)
2017
–
2018
2019
2020
2021
2022
2023
2024
2025
2026
(865)
(1,517) (1,583)
(1,681)
(1)
(1,835)
(1,954)
(2,070)
(2,253)
(2,384)
ASES projections for FY 2017 through FY 2026.
76
Additional Federal Government Action Would Help Spur Growth
A replacement for ACA funding merely maintains the current level of support the U.S.
Government provides Puerto Rico. Additional actions by the U.S. government, such as those
outlined below, could spur new growth on the island
Action Type
Request
Include PR in the Medicaid/Medicare disproportionate share hospital (“DSH”) program and ensure PR is
treated fairly under the Medicare DSH program
Medicaid
Equitable
Treatment
Under U.S.
Healthcare Law
Stimulate
Employment
and Labor
Participation
Remove statutory limits on Medicaid funding. In FY 2018, Medicaid funding granted under the Affordable
Care Act will be depleted Avert incoming fiscal cliff in ACA
− Medicaid funding level is capped at less than $350 million and the Federal Medical Assistance Percentage
(“FMAP”) rate set at 55%, which equals an effective rate of 15% to 20%, whereas according to Puerto
Rico’s income levels the FMAP should be set at 83%
Medicare
Automatically enroll in Medicare Part B individuals enrolled in Medicare Part A, and develop a mechanism to
reduce or eliminate penalties to seniors that enrolled late in Part B
Provide Puerto Rico doctors fair treatment under the Practice Expense, Physician Work, and Malpractice
Geographic Practice Cost Index (“GPCI”) payment formula
Ensure adequate PMPM payments to Medicare Advantage plans in Puerto Rico
Exempt Puerto Rico health insurers from the Health Insurance Providers Fee
Authorize Puerto Rico to participate in Medicare Part D Low-Income Subsidy (“LIS”) program
Pro employment requests with respect to NAP and public housing programs
Extend the EITC, the Child Tax Credit and Supplemental Security Income to Puerto Rico residents to increase
labor participation in the formal economy and help stimulate economic growth
77
Additional Federal Government Action Would Help Spur Growth (cont’d)
Action Type
Request
Implement ProGrowth
Corporate Tax
Regime
Provide Puerto Rico with a tax treatment that encourages investment and job creation, such as modifications
to Section 245a of the U.S. Internal Revenue Code and extension of Section 1031
The 245a proposal would incentivize companies that invest in Puerto Rico to repatriate income back to
the mainland U.S. by reducing the cost of repatriation
Importantly, the proposal would also reduce taxes paid over other foreign tax jurisdictions if Congress
enacts broader international tax reform. This provides a critical incentive to keep jobs in Puerto Rico
instead of companies moving overseas
To reduce the fiscal impact on the U.S. Treasury and ensure the proposal does not allow companies to
manipulate it to reduce taxes on income earned outside of Puerto Rico, the proposal will establish
limits on the use of foreign tax credits
Maintain Act 154 excise tax creditability during a transition period in order not to impact the multinationals
on the island nor the Commonwealth's revenue base
Executive approval or Congressional authorization to sell accumulated Federal Highway toll credits
Assistance in P3
Efforts and
Infrastructure
Spending
DOE financing for the Aguirre Offshore Gas Port and finalize remaining federal permits related to the project
Maximize use of financing opportunities available through the USDA Rural Utilities Service
Provide funding to the U.S. Department of Energy to complete the electric rates study authorized by the
Consolidated and Further Appropriations Act of 2015
Exemption from Jones Act application to reduce transportation costs and increase competitiveness
Provide appropriate funding to include Puerto Rico in the 2017 U.S. Census of Governments, the National
Agricultural Statistical Service surveys, and the Current Population Survey; have OMB and other appropriate
federal agencies conduct a comprehensive federal review of Puerto Rico’s exclusion from other critical
national datasets, such as the Job Opening Labor Turnover Survey, the American Time Use Survey, and the
National Health Interview Survey
Reduce
Operating Costs
and Improve
Fiscal Decision
Making
Coordinate technical assistance and education efforts by BEA, Census Bureau, BLS, EDA, MBDA, SBA, and
other federal agencies on processes to improve Puerto Rico’s statistical forecasting capacity and federal grant
opportunities
Encourage World Economic Forum to include Puerto Rico in its Global Competitiveness Report
78
Fiscal Plan Projections
79
Overview of the Fiscal Plan Projection Approach(1)
Given that the entities included in the Fiscal Plan generally mirror those that were included in the FEGP
developed by the Working Group for the Fiscal and Economic Recovery of Puerto Rico (the “Working
Group”), the Fiscal Plan adopts a similar approach to the FEGP
Projections for revenues and expenses are developed on a consolidated basis given the need for a
holistic solution
This implies that certain intragovernmental transactions are effectively eliminated from the projections, as they have
no impact on the Commonwealth’s ultimate fiscal position; for example, a loan payment from HTA to the GDB would
simply move assets from one entity included in the Plan to another entity included in the Plan without changing the
Commonwealth’s overall financing needs, and is therefore excluded
The fiscal projections are presented in two parts: first, the “Base Projections,” followed by projections
that reflect the impact of measures consistent with the principles previously outlined
The Base Projections illustrate the financing needs of the Commonwealth in the status quo and assume that current
laws remain unchanged
Illustratively, the Base Projections include all contractual debt service owed during the period of the projections,
which demonstrates the shortfall the Commonwealth would have to fill with measures and/or new financing if it
were to pay its existing debt in full
The Base Projections are then adjusted to account for the impact of the measures associated with the principles
outlined previously insofar as such measures are in the Commonwealth’s control to implement
The Measures include the projected benefits of improved growth in the Commonwealth economy
Illustratively all debt service is removed in this scenario to show what could be paid to creditors; a specific
allocation of any surplus between credits has not been made at this time, pending further discussions with the
Oversight Board
U.S. Federal Government action, while a critical component of returning the island to growth, is not
assumed under either the “Base Projections” or in the measures
For reference, however, the potential benefits of certain U.S. federal government actions, in particular continued
programmatic support for the Commonwealth’s healthcare system at current levels are shown for illustrative
purposes in the following section
(1)
The economic forecasts presented rely on the existing fiscal reporting systems in the Commonwealth of Puerto Rico and reflect existing economic uncertainty as well as any limitations stemming from
reporting systems, the data extract transform and load processes, as well as the inherent uncertainty of developing forward projections in this context. Although DevTech Systems takes all possible care to
ensure the accuracy of the information reported, no warranty can be accepted regarding the correctness, precision, timeliness, reliability and completeness of the content of this information. DevTech has
obtained the information provided from sources that should be considered reliable, but cannot guarantee its accuracy or completeness. The information provided is purely of an indicative nature and is subject
to change without notice at any time. DevTech does not accept any liability arising from any information provided or for the consequences of any actions taken in reliance on of this projection.
80
Key Macroeconomic Assumptions Used in the Base Projection
The following provides an overview of the key macroeconomic assumptions used in the
development of the Commonwealth’s Base Projections
The growth and inflation assumptions used in the Base Projections were developed by Dr. Rafael Romeu, a former IMF
economist hired by AAFAF who is the President and CEO of DevTech Systems, Inc. (“DevTech”), an international
economic consulting firm founded in 1984 that has provided advisory services in over 100 countries
Understanding the “Base” Projections:
The Base Projection is intended to reflect a starting point for calculating the tradeoffs of potential future policies. With
limitations on certain financial data and a lack of knowledge of the outcome of critical future decisions of not only Puerto
Rico, but also the Oversight Board and the U.S. Government, the Base Projections are the best available starting point for
analysis of future policy changes
The Base Projection serves only as a tool for costing measures and informing policy tradeoffs for the Commonwealth. The
Base Projection is not a viable economic scenario because it does not incorporate any package of measures, policies
and/or financing that would resolve the inconsistency of persistent deficits combined with a lack of market access
Methodology:
Against this backdrop, DevTech developed a set of growth and inflation projections for the Base Projection using factors
exogenous to Puerto Rico’s fiscal position, as summarized below
Growth(1) – The forecast of real growth is a function of the following variables:
U.S. real GDP variables published in the International Monetary Fund (IMF)’s Spring 2016 World Economic
Outlook (WEO)
Working age population forecasts for Puerto Rico(2)
Food and fuel price indices per the IMF
Inflation – modeling inflation follows a simple Phillips curve specification, where inflation is a function of:
Food and fuel price indices, reflecting pass-through from international prices
The output gap (in lieu of unemployment) and past inflation
(1)
(2)
The departure point for understanding DevTech’s approach to projecting real growth was identifying macroeconomic drivers of growth that are not necessarily endogenous to economic policies.
Population is a critical determinant for the growth of any economy, and given PR status as a U.S. territory, the ability to migrate into or away from the island makes this variable an even greater anchor on growth. The
population of the island has declined every year in the last decade. The United Nations publishes population projections for Puerto Rico through the year 2100.
81
Key Macroeconomic Assumptions Used in the Base Projection (cont’d)
The following provides an overview of the real GDP growth and inflation assumptions that
result from the methodology outline previously
The revised Base Projection reflects the trend deterioration in economic activity since the early 2000’s
The Commonwealth has contracted 9 of the past 10 years from 2006-2015
The population of the Commonwealth has declined every year during that period
Puerto Rico’s position in the broader U.S. economy (given it is not a state) complicates the interpretation of a
consistently declining real GDP
The decline in Commonwealth income is not reflected directly in per capita measures as population declines
Conversely, the Commonwealth could grow very quickly by reversing the migration flows and increasing labor
participation rates (currently below 40%)
(annual
percent
change)
Gross domestic
product
2006-15
Consumer prices
(period average)
(0.9%)
2.3%
Fiscal Plan Base Growth and Inflation Projections(1)
2018P
Rea l GDP
In fla t ion
Nom in a l GDP
(1 .5 4 %)
1 .8 9 %
0.35%
2019P
(1 .7 9 %)
1 .8 4 %
0.05%
2020P
(1 .7 8 %)
1 .7 9 %
0.01%
2021P
(1 .7 9 %)
1 .7 7 %
(0.02% )
2022P
(1 .7 8 %)
1 .7 7 %
(0.01% )
2023P
(1 .7 7 %)
1 .7 8 %
0.01%
2024P
2025P
(1 .7 5 %)
1 .8 0 %
0.05%
(1 .7 1 %)
1 .8 3 %
0.12%
2026P
(1 .6 7 %)
1 .8 9 %
0.22%
The Base Nominal growth rate is used to grow most revenue items included in the Commonwealth Fiscal Plan beyond FY
2017, with certain exceptions where revenues are either capped by statute or where the Commonwealth believes that the
revenues are unlikely to correlate with Puerto Rico GDP growth
The base inflation rate is used to drive many of the expenses included in the Fiscal Plan past FY 2017
The following pages summarize the revenues and expenses in the Base Projections based on the
approach, measures and macroeconomic assumptions detailed previously
(1)
Note that FY 2017 is not shown as it is based largely on budgetary numbers.
82
The Base Projection Building Blocks - FY ‘17 to FY ‘26
BASE PROJECTION INFLOW BUILD ($ billions)
General Fund (“GF”)
Revenues
Additional Sales and
Use Tax (“SUT”)
Other Tax Revenues
Other Non-Tax
Revenues (Excl.
Fed. Grants and
GDB revenues)(1)
Base “Adjusted”
Revenues
$81.1
GF includes majority of taxes, such as
income, withholding and the GF portion
of the sales and use tax; projection based
on FY 2017 budget, generally grown at
Base Nominal Rate; note that the effect of
the expiration of the 154 excise tax is
included herein (reduces revenues by
$8.2 bn)
$9.9
Includes additional SUT collections
historically allocated to entities outside
the GF (the GF revenues include a portion
of SUT); projected based on actual FY
2017 GF revenue projections grown at the
Base Nominal Rate
$14.0
Other Tax Revenues recorded outside of
the GF, including those assigned to
component units. The largest single
amounts in this group are Petroleum
Products and Gas taxes ($ 6.5 bn),
Cigarette Taxes ($ 0.7 bn, and Casino Slot
Revenues ($1.5 bn)
$6.5
$111.5
Largest single amounts of non-tax
revenues relate to charges for services,
such as tuition and fees at UPR ($1.8 bn),
net lottery revenues ($0.5 bn), HTA
revenues such as road and train tolls
($2.6 bn)(1)
BASE PROJECTION OUTFLOW BUILD ($ billions)
$88.4
Includes expenses to fund the primary
functions of the central government, such as
healthcare, public safety and education;
projection based on FY 2017 budget
generally grown by inflation; excludes debt
service and shown after a reduction of debt
service for entities largely funded by
appropriations, such as PBA and UPR
AAC/AUC (“Incr.
Retirement System
Funding”)
$11.0
Represents estimates, developed in
conjunction with actuarial work done by
Milliman, of the legally required AUC and
AAC, as well as “catch-up” payments from
previous years, required to adequately fund
ERS, TRS and JRS retirement systems
Estimated Run-Rate
Capex
$4.2
GF Expenses
(Ex. Debt, AUC/AAC)
Special Revenue
Funds, Enterprise
Funds and
Component Units
$12.1
Cigarette, Rum, SUT
and Lotto
Disbursements to
Entities Outside Plan
$3.1
Base “Adjusted”
Expenses
$118.8
FY 2017 based on OMB Budget and FY
2018-2026 based on a review of recent
historical data
Includes the net result of blended and nonblended component units other than entities
such as PREPA and PRASA, which are
excluded from the plan; also includes
projections of Special Revenue(2) and
Enterprise Funds
Includes tax and other revenues (such as
cigarette excise tax, rum excise tax and
lottery related outflows) to entities outside
of the model (such as to the rum producers
and municipalities)(3)
Note: Revenues shown already reflect the economic contraction referenced on page 5. Base Adjusted Expenses include retirement system “catch-up” payments.
(1)
Note that Federal Grants and GDB revenues are included in the Fiscal Plan, but they are excluded from “Base Adjusted Revenues.” Base Adjusted Revenues are developed as a metric that is meant to be comparable to state revenue collections
apart from Federal Funding as a proxy for the discretionary revenues a state has available. Federal Grant revenues are provided for specific purposes and generally could not be repurposed for something such as debt service (unless specifically
provided for debt service) which is only a very small portion of Federal Grants). GDB loan revenues have been excluded as they are not expected to be recurring since GDB is currently not extending new lines of credit.
(2)
Special Revenue Funds shown on a net operating deficit basis, excluding tax revenues which are shown separately under revenues. The revenues and expenses embedded in the cumulative ten-year $1.6bn net deficit related to Special Revenue
Funds include $4.7bn and $6.3bn, respectively. The Special Revenue Funds consist mostly of charges for services for public corporations and Commonwealth agencies
(3)
Includes, among others, estimated outflows of $1.3bn and $500mm to private rum producers and municipalities for rum and lottery related outflows, respectively. Other outflows include outflows related to cigarette excise taxes and other rum
excise tax outflows to other entities.
83
Base Projection Building Blocks - FY ‘17 to FY ’26 (cont’d)
BASE PROJECTION INFLOW BUILD ($ billions)
Adjusted
Revenues
GDB Inflows(1)
Federal Transfers
Before Loss of ACA
Funding
Loss of ACA Funding
Adjusted
Expenses
$111.5
$2.0
Represents GDB net loan and deposit
inflows from entities excluded from the
Fiscal Plan; excludes intra-governmental
transfers from entities included in the
Fiscal Plan
$75.1
Represents transfers from the Federal
Government that are applied to specific
required expenditures and therefore are
set equal to the transfers out, resulting in
a net zero impact on the financing gap
$16.1
$172.5
GDB Outflows
$118.8
$1.9
Represents GDB net loan and deposit
outflows to entities excluded from the
Fiscal Plan; excludes intra-governmental
transfers to entities included in the Fiscal
Plan
Federal Transfers
Before Loss of ACA
Funding
$ 75.1
Represents transfers from the Federal
Government that are applied to specific
required expenditures and therefore are set
equal to the transfers out, resulting in a net
zero impact on the financing gap
Oversight Board
Costs
$370
mm
Based on Congressional Budget Office June
3, 2016 Cost Estimate of H.R. 5278
(PROMESA), as ordered by the House
Committee on Natural Resources
Represents the estimated impact from
the depletion of ACA funding, estimated
to occur in FY 2018; the total size of the
impact grows over time based on the
assumed increase in healthcare expenses
Note that the impact of the ACA funding loss is illustratively shown as a
reduction of revenues. Federal Transfer associated expenses are not shown as
reduced, though in reality the Federal Transfer expenses would be reduced
and in its place the Commonwealth would have to expend more of its own
resources in order to continue operating its current healthcare system
Total Inflows
BASE PROJECTION OUTFLOW BUILD ($ billions*)
Outflows Excl.
Debt Service
$196.2
*Except where otherwise noted.
(1) Note GDB inflows include certain inflows related to TDF, though TDF payments on account of guarantees are included in debt service.
84
Base Projection Building Blocks - FY ‘17 to FY ‘26
BASE PROJECTION OUTFLOW BUILD ($ billions)
BASE PROJECTION INFLOW BUILD ($ billions)
Total Inflows
Outflows Excl.
Debt Service
$172.5
$196.2
Total Inflows Less Total Outflows Excl. Debt Service Results In….
A Base Financing Surplus/(Gap) ex. Debt Service
Debt Service
Total Base Financing Surplus/(Gap)
(1)
$35.0
($23.7)
Includes bonded debt service of entities
included in the Fiscal Plan, including GO
(including GSA loans), GDB, PBA, PFC, PRIFA
(Bonds and BANs), UPR, PRCCDA, PRIDCO,
HTA, ERS, and COFINA; Note that missed debt
service payments from FY 2016 and 2017 are
assumed to be paid in FY 2017(1)
($58.7)
Note that for illustrative purposes, debt service excludes debt held by GDB and certain guaranteed debt including guaranteed debt of PRASA. Debt service is shown net of existing reserves.
85
Summary of Annual Base Projections
The following presents the Base Projections outlined on the previous pages, on an annual
basis
As shown below, the financing needs of the Commonwealth under the Base Projections are highest in the early
years of the projections as the Commonwealth attempts to reinvest in its economy and pay back suppliers, many
of whom are local businesses
Annual Summary of Financing Gap in the Base Projections from FY 2017 to FY 2026 ($ millions)
Total
2017P
2018P
2019P
2020P
2021P
2022P
2023P
2024P
2025P
2026P
5 Yr
10 Yr
Adjusted Revenues
GF Revs. after Act 154 / Foreign Company Tax Losses
Additional Sales and Use Tax ("SUT")
Other Tax Revenues
Other Non-Tax Revenues
Total Adjusted Revenues
Federal Transfers
GDB Net Inflows
Total Revenues pre-ACA Funding Loss
Loss of ACA Funding (1)
Total Revenues post-ACA Funding Loss
$9,045
844
1,342
598
$11,829
7,000
236
$19,065
–
$19,065
$8,564
873
1,404
612
$11,454
7,114
233
$18,801
(865)
$17,935
$8,056
904
1,407
623
$10,990
7,226
233
$18,448
(1,517)
$16,931
$8,024
935
1,413
633
$11,005
7,337
211
$18,553
(1,583)
$16,970
$7,989
967
1,416
661
$11,033
7,448
186
$18,667
(1,681)
$16,986
$7,954
1,001
1,412
663
$11,029
7,561
183
$18,773
(1,835)
$16,939
$7,918
1,036
1,407
665
$11,027
7,676
181
$18,884
(1,954)
$16,930
$7,884
1,073
1,403
667
$11,028
7,794
181
$19,003
(2,070)
$16,933
$7,853
1,111
1,400
670
$11,034
7,917
178
$19,128
(2,253)
$16,876
$7,825
1,151
1,398
680
$11,055
8,046
176
$19,276
(2,384)
$16,893
$41,678
4,523
6,982
3,128
$56,312
36,124
1,098
$93,534
(5,646)
$87,888
$81,111
9,897
14,002
6,474
$111,484
75,118
1,998
$188,599
(16,141)
$172,458
Adjusted Expenses
General Fund Expenses (ex. Debt Serv. and AUC/AAC)
AAC/AUC (2)
Maintenance Capital Expenditures
Spec. Rev. Funds, Enterprise Funds and Comp. Units
Disbursement of Tax Revs. to Entities Outside Plan
Total Adjusted Expenses
Federal Programs
GDB Net Outflows
Oversight Board Costs
Total Expenses
($8,102)
(1,046)
(283)
(855)
(330)
($10,616)
(7,000)
(236)
(200)
($18,052)
($8,456)
(572)
(400)
(781)
(300)
($10,508)
(7,114)
(277)
(150)
($18,049)
($8,597)
(1,172)
(407)
(845)
(304)
($11,326)
(7,226)
(315)
(5)
($18,872)
($8,694)
(1,172)
(415)
(984)
(307)
($11,571)
(7,337)
(308)
(5)
($19,221)
($8,888)
(1,172)
(422)
(1,092)
(313)
($11,887)
(7,448)
(186)
(5)
($19,526)
($8,887)
(1,172)
(429)
(1,234)
(314)
($12,036)
(7,561)
(113)
(5)
($19,715)
($8,971)
(1,172)
(437)
(1,365)
(315)
($12,260)
(7,676)
(114)
–
($20,049)
($9,128)
(1,172)
(445)
(1,494)
(316)
($12,554)
(7,794)
(115)
–
($20,463)
($9,355)
(1,172)
(453)
(1,664)
(317)
($12,960)
(7,917)
(115)
–
($20,992)
($9,354)
(1,172)
(462)
(1,793)
(325)
($13,105)
(8,046)
(116)
–
($21,267)
($42,737)
(5,134)
(1,928)
(4,557)
(1,553)
($55,908)
(36,124)
(1,322)
(365)
($93,720)
($88,432)
(10,993)
(4,154)
(12,107)
(3,139)
($118,824)
(75,118)
(1,895)
(370)
($196,206)
($23,748)
Total Fin. Gap Pre-Measures before Debt Serv.
Less: Debt Service(3)
Total Fin. Gap Pre-Measures after Debt Serv.
$1,013
($114)
($1,941)
($2,251)
($2,540)
($2,777)
($3,120)
($3,530)
($4,116)
($4,374)
($5,832)
(4,618)
(3,294)
(3,872)
(3,493)
(3,438)
(3,197)
(3,138)
(3,554)
(3,055)
(3,308)
(18,715)
(34,967)
($3,605)
($3,408)
($5,813)
($5,744)
($5,978)
($5,974)
($6,258)
($7,084)
($7,171)
($7,682)
($24,547)
($58,716)
$9,045
(481)
$8,564
$9,018
(962)
$8,056
$8,986
(962)
$8,024
$8,951
(962)
$7,989
$8,916
(962)
$7,954
$8,880
(962)
$7,918
$8,846
(962)
$7,884
$8,815
(962)
$7,853
$8,787
(962)
$7,825
$45,045
(3,367)
$41,678
$89,288
(8,177)
$81,111
Memo: Embedded Impact of Act 154 / Foreign Company Tax Losses
GF Revs. before Act 154 / Foreign Company Tax Losses
$9,045
Act 154 / Foreign Company Tax Losses
–
GF Revs. after Act 154 / Foreign Company Tax Losses
$9,045
Memo: Macroeconomic Assumptions
Real Revenue Growth
Inflation
(1)
(2)
(3)
N/A
N/A
(1.5%)
1.9%
(1.8%)
1.8%
(1.8%)
1.8%
(1.8%)
1.8%
(1.8%)
1.8%
(1.8%)
1.8%
(1.7%)
1.8%
(1.7%)
1.8%
(1.7%)
1.9%
Assumes that the Commonwealth directly offsets the loss of ACA funding with local spend.
Includes AUC catch-up payments.
Includes principal and interest payments that may have been missed in FY 2016 and FY 2017. Debt service shown net of existing reserved used to pay debt service. Note that for illustrative purposes, debt service excludes debt held by GDB
and certain guaranteed debt including guaranteed debt of PRASA. Debt service is shown net of existing reserves.
86
Estimated Impact of Financial Measures
As illustrated below, the measures resulting from the principles outlined previously would be
expected, before the benefit of a change in the trajectory of the Commonwealth economy, to
reduce the Base Financing Gap by $10 billion
Annual Summary of Measures ($ millions)
2017 P
Meas. Aimed at Impr. Budg. Controls and Fiscal & Econ. Dec.-Making
Adopt Institute of Statistics / Planning Board Fiv e-Y ear Plan
Install New Accounting and Financial Sy stems
Im prov e Budg. Controls and Fiscal & Econ. Dec.-Making
Meas. Aimed at Rationalizing Ex ps. and Tax Policy to Promote Effic.
Expense Measures
Reduce Operating Costs
Right-Size Department of Education
Control Healthcare Costs
Cut Gov ernmental Subsidies
Total Expense Measures
Revenue Measures
Improv e Tax Enforcement and Administration
Address Upcoming Act 1 54 Rev enue Cliff
Total Revenue Measures
T otal Rationalizing Ex ps. and T ax Policy
Meas. Aimed at Enacting Structural Reform and Growth
Establish a Local EITC Program
Pay Local Businesses for Past Serv ices and Pay Tax Refunds
Build Deposits to Prov ide Confidence
Inv est in Incr. Main. Capex ov er Run-Rate
Inv est in Economic Growth Projects
T otal Enacting Struct. Reform and Growth
Meas. Aimed at Protecting Vuln. Stakeholders
Implement Pension Sy stem Reform (1 )
T otal
10 Y r
2018P
2019P
2020P
($3)
(30)
($3)
–
($3)
–
($3)
–
($3)
–
($3)
–
($3)
–
($3)
–
($3)
–
($3)
–
($1 5)
(30)
($30)
(30)
(33)
(3)
(3)
(3)
(3)
(3)
(3)
(3)
(3)
(3)
(45)
(60)
–
–
(4)
–
(4)
397
42
65
47
551
528
71
93
96
7 88
7 23
99
93
1 45
1 ,059
807
1 27
93
244
1 ,27 1
7 98
1 29
95
343
1 ,365
7 90
1 31
96
342
1 ,359
7 81
1 34
98
341
1 ,354
773
1 36
1 00
340
1 ,349
7 66
1 39
1 02
339
1 ,346
2,455
339
340
532
3,665
6,364
1 ,008
830
2,237
1 0,439
10
–
10
1 21
481
602
1 51
962
1 ,1 1 3
17 1
962
1 ,1 33
1 69
962
1 ,1 31
1 67
962
1 ,1 29
1 63
962
1 ,1 25
1 61
962
1 ,1 23
1 58
962
1 ,1 20
1 56
962
1 ,1 1 8
622
3,367
3,989
1 ,428
8,1 7 7
9,605
1,153
1,901
2,192
2,403
2,494
2,485
2,47 0
2,464
7 ,655
20,044
6
2021P
2022P
2023P
2024P
2,47 7
2025P
2026P
5 Yr
–
(565)
(21 4)
(1 41 )
(54)
(1 50)
(27 2)
(21 4)
(528)
(400)
(1 50)
(27 2)
(21 4)
(397 )
(466)
(1 50)
(27 2)
(21 4)
(27 3)
(47 6)
(1 50)
(27 2)
(21 4)
(1 03)
(353)
(1 50)
–
–
(1 04)
(31 6)
(1 50)
–
–
(1 06)
(1 87 )
(1 50)
–
–
(1 08)
(1 1 3)
(1 50)
–
–
(1 1 0)
(1 03)
(1 50)
–
–
(1 1 2)
(1 03)
(600)
(1 ,653)
(1 ,069)
(1 ,442)
(1 ,7 49)
(1 ,350)
(1 ,653)
(1 ,069)
(1 ,983)
(2,57 2)
(97 4)
(1,564)
(1,499)
(1,385)
(1,091)
(57 0)
(443)
(37 1)
(363)
(366)
(6,514)
(8,627 )
(1 66)
(1 66)
(1 1 6)
(1 1 6)
(1 1 6)
(1 1 6)
(1 1 6)
(1 1 6)
(1 1 6)
(1 1 6)
(681 )
(1 ,263)
(166)
(166)
(116)
(116)
(116)
(116)
(116)
(116)
(116)
(116)
(681)
(1,263)
T otal Measures Im pact
($1,167 )
($581)
$283
$687
$1,193
$1,804
$1,922
$1,987
$1,987
$1,97 9
$415
$10,094
Memo: Estimated Impact on Economic Growth
Change in Economic Trajectory
Total Measures incl. Change in Economic Trajectory
–
($1 ,1 67 )
202
($37 8)
340
$623
501
$1 ,1 88
718
$1 ,91 0
939
$2,7 43
1 ,1 85
$3,1 08
1 ,427
$3,41 4
1 ,61 2
$3,599
1 ,7 82
$3,7 61
1 ,7 61
$2,1 7 6
8,7 07
$1 8,801
T otal Protecting Vulnerable Stakeholders
Memo: Macroeconomic Assumptions
Real Revenue Growth
Inflation
(1)
N/A
N/A
0.6%
2.1%
(0.3%)
2.0%
(0.1%)
1.9%
0.2%
1.9%
0.2%
1.9%
0.4%
2.0%
0.3%
2.1%
(0.0%)
2.0%
(0.2%)
1.9%
Illustratively includes the reduction in the estimated portion of AUC as result of the exclusion of debt service, which amounts to approximately $80 million over the 10-year projection period.
87
Incremental Saving / (Spend) from Measures
The Fiscal Plan is not intended to be an austerity plan, but rather largely redirects spending
from inefficient uses towards uses more likely to produce economic growth
As illustrated below, excluding (1) certain measures aimed at maintaining current revenues and spending (such
as reforms to the corporate tax code to replace Act 154 revenues and an extension of Act 66) and (2) the build in
deposits, the Commonwealth’s revenue reforms and expenditure cuts largely fund the incremental spending the
Commonwealth projects to stimulate growth in the economy
The spending is highest in the early years so as to jumpstart growth and stop outmigration as the Commonwealth
implements structural reforms
Annual Summary of Incremental Savings / (Spend) from Measures ($ millions)
T otal
T otal Measures Im pact
Less: Measures Aimed at Maintaining Current Rev s./Ex ps.
Address Upcoming Act 1 54 Rev enue Cliff
Ex tend Law 66 / Implement Long-Term Budg. Reform
Measures Aimed at Maintaining Current Rev s./Ex ps.
Plus: Deposit Build
T otal Increm ental Sav ings / (Spend) from Measures
2017P
2018P
2019P
2020P
2021P
2022P
($1,167 )
($581)
$283
$687
$1,193
$1,804
$1,922
$1,987
$1,987
$1,97 9
$415
–
–
–
(481 )
(1 7 8)
($659)
(962)
(257 )
($1 ,21 9)
(962)
(336)
($1 ,298)
(962)
(41 6)
($1 ,37 8)
(962)
(400)
($1 ,362)
(962)
(384)
($1 ,346)
(962)
(368)
($1 ,330)
(962)
(353)
($1 ,31 5)
(962)
(338)
($1 ,300)
(3,367 )
(1 ,1 87 )
(4,554)
$21 4
$21 4
$21 4
$21 4
$21 4
($953)
($1,026)
($7 23)
($397 )
$28
–
$443
2023P
–
$57 6
2024P
–
$656
2025P
–
$67 2
2026P
–
$67 9
5 Yr
10 Yr
$10,094
(8,1 7 7 )
(3,030)
(1 1 ,207 )
$1 ,069
$1 ,069
($3,07 1)
($44)
88
Macroeconomic Projections for the Post-Measures Scenario
The following provides an overview of the post-measures scenario
The starting point is the Base Projections, reflecting current policies projected from FY 2017 - FY 2026
The post-measures scenario shows the projected impact of fiscal and growth measures over the period,
including:
The improvement in the fiscal position resulting from the measures
The improvement in long-term (potential) growth from growth enhancing measures, including Earned
Income Tax Credit, capital expenditure, better public financial management and repaying overstretched
suppliers
The cyclical impact of measures, which reduce (expand) short-term real GDP growth when policies
increase (cut) fiscal revenues (expenditures)
The cyclical impact is captured by the fiscal multiplier of 1.3 (Nakamura and Steinsson: Fiscal Stimulus
in a Monetary Union, American Economic Review, 2014)
As the economy contracts (expands), output falls below potential real GDP, creating slack in the economy,
lowering wages and prices
89
Macroeconomic Projections for the Post-Measures Scenario (cont’d)
The following provides an overview of the post-measures scenario
Eventually, low wages and prices create attractive investment opportunities
This is the primary mechanism to close the output gap and undo the cyclical impact of measures
This adjustment can be slow, as the Commonwealth (and U.S. States) cannot devalue its currency
relative to other U.S. States (unlike countries) to quickly and easily make labor and investment
more attractive
This again underscores the need to enhance growth measures, and take structural reforms to
make markets more efficient and adjust as quickly and painlessly as possible
Growth enhancing measures create opportunities and investment to ensure potential GDP growth
does not remain negative because people move to the U.S. mainland
The resulting nominal GDP feeds revenues and produces a new primary fiscal deficit
Puerto Rico is assumed to self-finance this fiscal reform package since there is no new financing
available. Hence, the package of measures is adjusted to close the primary deficit, which feeds
back to real GDP, the output gap, inflation and nominal GDP
This feedback loop continues until it converges on a stable fiscal deficit, growth and nominal GDP
growth path; the output gap assumed to slowly close at the end of the ten-year projection period
It is critical to underscore that the macro-fiscal scenarios focus on self-financing the primary deficit.
Existing interest and amortization schedules are assumed to be financed at 0% so as to arrive at a
reasonable estimate of size of the fiscal and growth problem going forward, apart from the legacy of
past decisions and growth challenges, as reflected in the existing debt service schedule
Fiscal Plan Post-Measures Growth and Inflation Projections
2018P
2019P
2020P
2021P
2022P
2023P
2024P
2025P
2026P
Rea l GDP
0 .5 8 %
(0 .2 7 %)
(0 .1 1 %)
0 .2 0 %
0 .1 9 %
0 .3 6 %
0 .2 6 %
(0 .0 2 %)
(0 .1 8 %)
In fla t ion
2 .0 6 %
2 .0 5 %
1 .9 4 %
1 .9 2 %
1 .9 2 %
2 .0 0 %
2 .0 7 %
2 .0 3 %
1 .8 9 %
Nom in a l GDP
2.64%
1.77%
1.84%
2.11%
2.11%
2.36%
2.33%
2.02%
1.72%
90
Annual Projections Including Measures
The following shows the annual projected financing surplus/(gap) after incorporating the
measures outlined previously
As shown below, in all years of the plan a deficit remains even after excluding all debt service and after incorporating the potential
benefits of economic growth
The larger deficits in the early years are driven by the large capital expenditures made during the period as well as the payments of
past-due payables
Note that the growth rate is estimated only based on the potential surplus available to fund these spending amounts (i.e.,
Puerto Rico is assumed only be able to spend up to the amount until the surplus goes to zero); no external financing is assumed
to fund the deficits shown and further financing could increase future deficits due to associated debt service costs
Assuming average real GDP growth that averages 0.1% between FY 2018 and FY 2026 as compared to negative 1.7% in the base,
there is still projected to be a deficit of $5.7 billion over ten years
Annual Summary of Financing Gap in the Post-Measures Projections from FY 2017 to FY 2026 ($ millions)
T otal
Fin. Gap Pre-Measures after Debt Serv .
2017P
2018P
2019P
2020P
2021P
2022P
2023P
2024P
2025P
2026P
($5,97 4)
($6,258)
($7 ,084)
($7 ,17 1)
($7 ,682)
3,1 38
3,554
5 Yr
($3,605)
($3,408)
($5,813)
($5,7 44)
($5,97 8)
Plus: Debt Serv ice (1 )
3,909
3,294
3,87 2
3,493
3,438
Fin. Gap Pre-Measures before Debt Serv .
$304
($114)
($1,941)
($2,251)
($2,540)
($2,7 7 7 )
($3,120)
($3,530)
($4,116)
($4,37 4)
($6,541)
($24,457 )
(33)
6
(97 4)
(1 66)
(1 ,1 67 )
(3)
1 ,1 53
(1 ,564)
(1 66)
(581 )
(3)
1 ,901
(1 ,499)
(1 1 6)
283
(3)
2,1 92
(1 ,385)
(1 1 6)
687
(3)
2,403
(1 ,091 )
(1 1 6)
1 ,1 93
(3)
2,494
(57 0)
(1 1 6)
1 ,804
(3)
2,485
(443)
(1 1 6)
1 ,922
(3)
2,47 7
(37 1 )
(1 1 6)
1 ,987
(3)
2,47 0
(363)
(1 1 6)
1 ,987
(3)
2,464
(366)
(1 1 6)
1 ,97 9
(45)
7 ,655
(6,51 4)
(681 )
41 5
(60)
20,044
(8,627 )
(1 ,263)
1 0,094
($863)
($694)
($1,658)
($1,563)
($1,347 )
($97 2)
($1,197 )
($1,543)
–
202
340
7 18
939
($863)
($492)
($1,318)
($629)
0.2%
1 .9%
Measures Impact
Impr. Budg. Controls & Fiscal and Econ. Dec.-Making
Rationalize Ex p. and Tax Policy to Promote Effic.
Enact Struct. & Econ. Measures and Inv est in Growth
Protect Vulnerable Stakeholders (2)
Total Measures Impact
Fin. Gap Post-Meas. ex . Debt Serv . & Econ. Im pact
Est. Incr. Inc. from Econ. Dev . and Struct. Reforms
Fin. Gap Post-Meas. incl. Growth ex . Debt Serv .
501
($1,063)
3,1 97
3,055
3,308
($24,547 )
10 Yr
1 8,007
($58,7 16)
34,258
($2,129)
($2,395)
1 ,1 85
1 ,427
1 ,61 2
1 ,7 82
($6,126)
–
1 ,7 61
($14,363)
–
8,7 07
($34)
($12)
($116)
($517 )
($613)
($4,365)
($5,656)
0.2%
1 .9%
0.4%
2.0%
0.3%
2.1 %
Memo: Macroeconomic Assumptions
Real Revenue Growth
Inflation
(1)
(2)
N/A
N/A
0.6%
2.1 %
(0.3% )
2.0%
(0.1 % )
1 .9%
(0.0% )
2.0%
(0.2% )
1 .9%
Includes principal and interest payments that may have been missed in FY 2016 and FY 2017. Debt service shown net of existing reserves used to pay debt service. Note that for illustrative purposes, debt service excludes debt held by GDB and
excludes revenues otherwise allocated to COFINA FY 2017 debt service.
Illustratively includes the reduction in the estimated portion of AUC as result of the exclusion of debt service, which amounts to approximately $80 million over the 10-year projection period.
91
A Replacement for ACA Funding Could Materially Improve Puerto Rico’s Fiscal
Position
Given a financing gap remains even after Puerto Rico implements the measures in its control,
it is essential that the U.S. Government become a partner in promoting economic growth in
Puerto Rico through items such as equitable healthcare treatment to replace ACA funding
Shown below is the illustrative impact of the U.S. Government providing the Commonwealth with more equitable
healthcare treatment, which is assumed to at least replace the loss of ACA funding
Even with actions of the U.S. Federal Government, there are still negative cash flows in the early years of the
projections driven by large capital expenditures and past-due payable payments that may potentially require
either delay or new, interim financing (for illustrative purposes no incremental financing cost is assumed)
By FY 2018, however, these actions combined with the measures outlined previously and the potential benefit of
incremental economic growth that would result from the elimination of the deficits that existed prior to ACA
funding could remove structural deficits and would produce a ten year financing surplus before debt service of
$18.9 billion
Note that this growth would not be possible without ACA type funding and that, even if ACA funding were
received, it may not be advisable to use as a level for setting fixed (vs. contingent) debt service given it would
be such a drastic turnaround for the Commonwealth economy
Annual Summary of Financing Gap After Select Federal Actions ($ millions)
T otal
Fin. Gap Before U.S. Gov 't Action
Replacement of ACA Funding
Fin. Gap After U.S. Gov 't Action
Change in Economic Trajectory
Fin. Gap After U.S. Gov 't Action & Econ. Im p.
2017P
2018P
2019P
2020P
2021P
2022P
2023P
2024P
2025P
2026P
5 Yr
10 Yr
($863)
($492)
($1,318)
($1,063)
($629)
($34)
($12)
($116)
($517 )
($613)
($4,365)
–
5,646
($5,656)
–
1 6,1 41
–
865
1 ,51 7
1 ,583
1 ,681
1 ,835
1 ,954
2,07 0
2,253
2,384
($863)
$37 4
$199
$520
$1,052
$1,801
$1,942
$1,954
$1,7 36
$1,7 7 1
$1,281
–
67
31 2
602
849
1 ,001
1 ,1 30
1 ,27 7
1 ,460
1 ,682
1 ,830
8,37 8
($863)
$441
$512
$1,122
$1,901
$2,802
$3,07 2
$3,231
$3,195
$3,452
$3,112
$18,863
(3,909)
($4,7 7 2)
(3,294)
($2,853)
(3,493)
($2,37 1 )
(3,438)
($1 ,538)
$10,485
Memo: Financing Gap After Debt Service
Inclusion of Debt Service (1)
Fin. Gap Incl. Debt Serv. After U.S. Gov't Action
(3,87 2)
($3,361 )
(3,1 97 )
($396)
(3,1 38)
($66)
(3,554)
($323)
(3,055)
$1 41
(3,308)
$1 44
(1 8,007 )
($1 4,895)
(34,258)
($1 5,395)
Memo: Macroeconomic Assumptions
Real Revenue Growth
Inflation
(1)
N/A
N/A
1 .3%
2.2%
1 .9%
2.7 %
1 .9%
3.1 %
1 .6%
3.1 %
1 .1 %
2.9%
1 .2%
2.6%
1 .3%
2.3%
1 .2%
2.0%
1 .2%
1 .6%
Includes principal and interest payments that may have been missed in FY 2016 and FY 2017. Debt service shown net of existing reserves used to pay debt service. Note that for illustrative purposes, debt service excludes debt held by GDB and
excludes revenues otherwise allocated to COFINA FY 2017 debt service.
92
Fiscal Plan Macroeconomic Assumptions
The following tables summarize the projected real and nominal GDP growth rates used in the
Base Projections, as well as the growth rates assumed post-measures including and
excluding U.S. government assistance in the form of ACA type funding, illustrating the
potential positive impacts of actions by the U.S. government
Base Projections
2018P
Rea l GDP
In fla t ion
Nom in a l GDP
(1 .5 4 %)
1 .8 9 %
0.35%
2019P
(1 .7 9 %)
1 .8 4 %
0.05%
2020P
(1 .7 8 %)
1 .7 9 %
0.01%
2021P
(1 .7 9 %)
1 .7 7 %
(0.02% )
2022P
(1 .7 8 %)
1 .7 7 %
(0.01% )
2023P
(1 .7 7 %)
1 .7 8 %
0.01%
2024P
(1 .7 5 %)
1 .8 0 %
0.05%
2025P
(1 .7 1 %)
1 .8 3 %
0.12%
2026P
(1 .6 7 %)
1 .8 9 %
0.22%
Post-Measures, Without U.S. Government Action Projections
2018P
2019P
2020P
2021P
2022P
2023P
2024P
2025P
2026P
Rea l GDP
0 .5 8 %
(0 .2 7 %)
(0 .1 1 %)
0 .2 0 %
0 .1 9 %
0 .3 6 %
0 .2 6 %
(0 .0 2 %)
(0 .1 8 %)
In fla t ion
2 .0 6 %
2 .0 5 %
1 .9 4 %
1 .9 2 %
1 .9 2 %
2 .0 0 %
2 .0 7 %
2 .0 3 %
1 .8 9 %
Nom in a l GDP
2.64%
1.77%
1.84%
2.11%
2.11%
2.36%
2.33%
2.02%
1.72%
Post-Measures, With U.S. Government Action Projections
2018P
2019P
2020P
2021P
2022P
2023P
2024P
2025P
2026P
Rea l GDP
1 .3 4 %
1 .9 0 %
1 .8 8 %
1 .6 3 %
1 .1 5 %
1 .2 1 %
1 .3 1 %
1 .1 9 %
1 .2 2 %
In fla t ion
2 .1 5 %
2 .6 9 %
3 .0 6 %
3 .1 5 %
2 .9 3 %
2 .6 3 %
2 .3 2 %
1 .9 7 %
1 .6 1 %
Nom in a l GDP
3.49%
4.59%
4.94%
4.78%
4.08%
3.84%
3.63%
3.16%
2.83%
93
Footnotes
94
Footnotes to “Debt of Entities Included in the Fiscal Plan”
The following footnotes provide additional detail to page 67
2.
Please note that all figures are subject to ongoing diligence and numbers may change materially. All bonds are included as of July 2, 2016; loans as of June
30, 2016 and do not include unpaid interest, if any, and do not include payments made by insurers, where applicable.
3.
Excludes estimated CAB accretion, which is shown separately as of July 2, 2016. Capital Appreciation Bonds (“CAB”) are zero coupon bonds that accrete in
value until maturity instead of making regularly scheduled interest payments. This accretion is treated in reporting as ‘interest’ rather than principal and is
broken out separately from initial par values.
4.
Missed interest is for FY 2016 and as of July 2, 2016.
5.
Private loan figures are representative of loans at non-government entities. Figures include non-bank municipal loans.
6.
Includes operational loans from GDB to the PR Treasury Department, including $102 million of loans from other CW entities representing Trade and Export
Company ($14 million), GDB loans to various minor CW entities, and operational loans payable from GDB to PR Treasury representing long-term credit
facilities of $100 million from the SIF and $2 million from the Automobile Accidents Compensation Administration ("AACA").
7.
HTA includes Teodoro Moscoso bonds and VRDOs held by GDB.
8.
GDB bonds include $110mm of CW-guaranteed bonds issued to the SIF. Where there are TDF guaranteed bonds and loans that TDF is paying out on, they
have been reflected in the GDB bonds and loans.
9.
Includes PRIFA Rum bonds, PRIFA Petroleum Products Excise Tax BANs, PRIFA Ports Authority bonds and PRIFA ASSMCA bonds.
10.
Includes the AFICA - Desarrollos Universitarios University Plaza Project bonds. Desarrollos Universitarios, a component unit of UPR, although legally
separate, is reported as if it was part of the primary government because its debt is expected to be repaid entirely, or almost entirely, with resources of UPR
(via lease payments from UPR to Desarrollos Universitarios).
11.
APLA is excluded as the debt is owned by GDB and thus debt service is intragovernmental. See footnote 6. Additional diligence is required to determine if
entities are included in or excluded from the plan but it is believed that most are Fiscal Plan entities.
12.
Includes Series 2016 A, B, C, D and E Bonds.
13.
PRASA includes CW-guaranteed debt of (i) $521 million in Loans from Other CW Entities representing the CWSRF and DWSRF, (ii) $285 million in bonds
representing the 2008 Sub. Refunding bonds, and (iii) $394 million in bonds representing the Rural Development bonds.
14.
Note that Municipality Related Debt includes MFA, CAE, IVU, and other municipal debt. Loans from other CW entities includes $570 million in loans from
MFA to be repaid by the CAE tax. Also includes municipalities general fund resources, the AFICA Guaynabo Municipal Gov. Center ($8.3 million) and the
AFICA - Guaynabo Warehouse for Emergencies ($6.7 million) bonds.
15.
Excludes TDF guaranteed bonds and loans that TDF is paying out on to third parties.
95
Additional Detail on Fiscal Plan Projections
96
Summary Page - Revenues
The following table presents a detailed summary of revenues included in the Fiscal Plan Base
Projections
T otal
2017 P
2018P
2019P
2020P
2021P
2022P
2023P
2024P
2025P
2026P
5 Yr
10 Y r
Rev enues before Measures
General Fund Revenues (incl. Act 1 54 / Excise Tax Losses)
1
Indiv idual Income Tax es
$1 ,966
$1 ,97 2
$1 ,97 3
$1 ,97 2
$1 ,97 1
$1 ,97 0
$1 ,97 0
$1 ,97 0
$1 ,97 2
$1 ,97 5
$9,854
$1 9,7 1 1
2
Corporate Income Tax es
1 ,525
1 ,565
1 ,565
1 ,565
1 ,564
1 ,563
1 ,563
1 ,563
1 ,565
1 ,568
7 ,7 84
1 5,606
7 63
7 63
7 63
7 63
7 63
7 63
7 63
7 63
7 63
7 63
3,81 5
7 ,630
1 ,924
(481 )
27 3
1 ,924
(962)
27 3
1 ,924
(962)
27 3
1 ,924
(962)
27 3
1 ,924
(962)
27 3
1 ,924
(962)
27 3
1 ,924
(962)
27 3
1 ,924
(962)
1 ,924
(962)
9,620
(3,367 )
1 9,240
(8,1 7 7 )
27 3
27 3
1 ,363
2,7 27
294
17 9
1 ,469
2,938
887
7 ,7 67
1 ,7 69
1 4,685
1 ,1 7 3
1 80
3
Non-Resident Withholdings
4
5
Act 1 54 / Ex cise Tax Rev enues
Estimated Loss of Act 1 54 / Foreign Company Tax Rev enues
1 ,924
–
27 2
6
Ex cise Tax es on Alcoholic Bev erages
7
Motor V ehicle Ex cise Tax es
293
294
294
294
294
294
294
294
8
Ex cise Tax es on Off-Shore Shipments Rum
General Fund Portion of 1 1 .5% SUT
206
1 68
17 0
17 1
17 2
17 4
17 5
17 6
294
17 8
1 ,608
1 ,586
1 ,557
1 ,525
1 ,491
1 ,456
1 ,420
1 ,384
1 ,348
1 ,31 0
117
117
117
117
117
117
117
117
117
118
18
18
18
18
18
18
18
18
18
18
586
90
9
10
11
Cigarette Ex cise Tax es
Casino Slot Rev enues
12
Lotteries
80
386
7 87
13
Other General Fund Tax Rev enues
117
112
112
112
112
112
112
112
112
113
566
1 ,1 28
Other General Fund Non-Tax Rev enues
17 1
17 2
17 2
17 2
17 1
17 1
17 1
17 1
17 1
17 2
14
15
65
General Fund Revenues (incl. Act 1 54 / Excise Tax Losses)
9,045
80
80
80
80
80
80
80
80
8,564
8,056
8,024
7 ,989
7 ,954
7 ,91 8
7 ,884
7 ,853
7 ,825
857
41 ,67 8
1 ,7 1 4
81 ,1 1 1
8,694
Additional Sales and Use Tax ("SUT")
16
COFINA Portion of 6% SUT
7 24
7 53
7 83
81 5
847
881
91 6
953
991
1 ,031
3,922
17
Portion of 1 1 .5% SUT - FAM
117
117
117
117
117
117
117
117
117
117
585
18
Portion of 1 1 .5% SUT - Cine
19
3
844
Additional Sales and Use Tax ("SUT")
3
87 3
3
904
3
935
3
967
3
1 ,001
3
1 ,036
3
1 ,07 3
3
1 ,1 1 1
3
1 ,1 51
1 ,1 7 1
16
4,523
32
9,897
Other Tax Revenues
59
59
59
59
59
59
59
59
59
59
295
590
17 4
1 36
1 37
1 38
1 39
1 40
1 41
1 42
1 43
1 44
7 24
1 ,436
20
Non-Resident Withholdings (Special Rev enue Fund)
21
Ex cise Tax es on Off-Shore Shipments Rum (Special Rev enue Fund)
22
Room Tax es
77
81
85
88
88
88
88
88
88
88
41 9
858
23
Cigarette Ex cise Tax es (Special Rev enue Fund)
67
67
67
67
67
67
67
67
67
67
337
67 4
24
Petroleum Products (Crudita) Ex cise Tax
Gas Oil and Diesel Ex cise Tax es
41 1
51 0
51 0
51 0
51 0
51 0
51 0
51 0
51 0
51 0
25
13
13
13
13
13
12
12
11
11
11
2,451
63
5,001
119
26
Gasoline Ex cise Tax Rev enue
1 51
1 46
1 45
1 46
1 48
1 43
1 39
1 34
1 29
1 26
7 36
1 ,407
27
V ehicle License Fees
93
93
93
93
93
93
93
93
93
93
463
927
28
Other Special Rev enue Fund Tax Rev enues
53
53
53
53
53
53
53
53
53
53
29
Casino Slot Rev enues
1 40
1 42
1 42
1 42
1 42
1 42
1 42
1 42
1 42
1 43
263
7 09
527
1 ,420
1 04
1 ,342
1 04
1 ,404
1 04
1 ,407
1 04
1 ,41 3
1 04
1 ,41 6
1 04
1 ,41 2
1 04
1 ,407
1 04
1 ,403
1 04
1 ,400
1 04
1 ,398
521
6,982
1 ,042
1 4,002
30
31
32
CRIM Property Tax Inflows
Other Tax Revenues
Other Non-Tax Revenues
Lotteries - Munis & Other
33
HTA Non-Tax Rev enues (ex . Teodoro Moscoso)
34
Teodoro Moscoso Bridge Rev enues
35
PRIDCO Rent and Other Non-Tax Rev enues
36
UPR Tuition, Fees and Other Non-Tax Rev enues
37
PRCCDA Rent and Other Non-Tax Rev enues
38
Net Income of Select Component Units (2)
39
40
41
42
43
44
45
(1 )
Other Non-Tax Revenues
T otal Adjusted Rev enue before Measures pre-ACA Funding Loss
GDB Loan Inflows
Federal Transfers
T otal Rev enues before Measures pre-ACA Funding Loss
Loss of Affordable Care Act ("ACA") Funding
T otal Rev enues before Measures post-ACA Funding Loss
(1)
(2)
38
46
48
50
56
56
55
55
55
62
239
522
240
245
249
252
252
252
252
252
252
253
1 ,238
2,500
1 20
–
–
–
–
20
20
20
20
20
20
20
67
67
69
71
71
71
71
71
71
71
344
699
1 69
17 1
17 4
17 6
17 8
1 80
1 83
1 85
1 88
1 90
868
1 ,7 95
4
80
4
80
4
80
4
80
4
80
4
80
4
80
4
80
4
80
4
80
20
399
40
7 99
598
61 2
623
633
661
663
665
667
67 0
680
3,1 28
6,47 4
$11,829
$11,454
$10,990
$11,005
$11,033
$11,029
$11,027
$11,028
$11,034
$11,055
$56,312
$111,484
236
233
233
21 1
1 86
1 83
1 81
1 81
17 8
17 6
1 ,098
1 ,998
7 ,000
7 ,1 1 4
7 ,226
7 ,337
7 ,448
7 ,561
7 ,67 6
7 ,7 94
7 ,91 7
8,046
36,1 24
7 5,1 1 8
$19,065
$18,801
$18,448
$18,553
$18,7 7 3
$18,884
$19,003
$19,128
$19,27 6
$93,534
$188,599
–
$19,065
(865)
$17 ,935
(1 ,51 7 )
$16,931
(1 ,583)
$16,97 0
$18,667
(1 ,681 )
$16,986
(1 ,835)
$16,939
(1 ,954)
$16,930
(2,07 0)
$16,933
(2,253)
$16,87 6
(2,384)
$16,893
(5,646)
$87 ,888
(1 6,1 41 )
$17 2,458
Excludes Federal Grants.
Represents the net income estimates of entities without bonded debt that have historically provided a surplus. Net numbers are shown as these entities generally receive independent revenues that would not be generated
absent the associated expenses. Note that numbers are shown excluding capital expenditures, which are shown elsewhere and forward estimates are based on a review of historical results.
97
Summary Page - Expenses
The following table presents a detailed summary of non-interest expenditures included in the
Fiscal Plan Base Projections
T otal
2017 P
2018P
2019P
2020P
2021P
2022P
2023P
2024P
2025P
2026P
5 Yr
10 Y r
Non-Debt Ex penditure before Measures
General Fund Expenses (ex. AUC /AAC and Debt Service)
44
Direct Pay roll
($3,27 1 )
($3,333)
($3,394)
($3,455)
($3,51 6)
($3,57 8)
($3,642)
($3,7 07 )
($3,7 7 5)
($3,847 )
($1 6,969)
45
Direct Operational Ex penses
(907 )
(924)
(941 )
(958)
(97 5)
(992)
(1 ,01 0)
(1 ,028)
(1 ,047 )
(1 ,066)
(4,7 05)
(9,848)
46
Utilities
(260)
(332)
(352)
(360)
(37 4)
(37 3)
(37 0)
(37 5)
(388)
(396)
(1 ,67 8)
(3,580)
47
Special Appropriations - UPR Formula
(7 91 )
(836)
(836)
(836)
(836)
(836)
(836)
(836)
(836)
(848)
(4,1 36)
(8,329)
48
Special Appropriations - Judicial Formula
(324)
(366)
(366)
(366)
(366)
(366)
(366)
(366)
(366)
(366)
(1 ,7 89)
(3,61 9)
49
Special Appropriations - Municipalities Formula
(361 )
(37 1 )
(37 1 )
(37 1 )
(37 1 )
(37 1 )
(37 1 )
(37 1 )
(37 1 )
(37 1 )
(1 ,845)
(3,7 01 )
50
Special Appropriations - Retirement Sy stems
(37 1 )
(424)
(480)
(536)
(543)
(535)
(529)
(595)
(593)
(587 )
(2,354)
(5,1 93)
51
Special Appropriations - Health Insurance
(885)
(885)
(885)
(885)
(885)
(885)
(885)
(885)
(885)
(885)
(4,425)
(8,850)
52
Special Appropriations - Other
(932)
(8,1 02)
(984)
(8,456)
(97 2)
(8,597 )
(926)
(8,694)
(1 ,021 )
(8,888)
(950)
(8,887 )
(962)
(8,97 1 )
(964)
(9,1 28)
(1 ,093)
(9,355)
(987 )
(9,354)
(642)
(642)
(57 2)
(57 2)
(1 ,1 7 2)
(1 ,1 7 2)
(1 ,1 7 2)
(1 ,1 7 2)
(1 ,1 7 2)
(1 ,1 7 2)
(1 ,1 7 2)
(1 ,1 7 2)
(1 ,1 7 2)
(1 ,1 7 2)
(1 ,1 7 2)
(1 ,1 7 2)
(1 ,1 7 2)
(1 ,1 7 2)
(1 ,1 7 2)
(1 ,1 7 2)
(283)
(283)
(400)
(400)
(407 )
(407 )
(41 5)
(41 5)
(422)
(422)
(429)
(429)
(437 )
(437 )
(445)
(445)
(453)
(453)
(462)
(462)
(1 09)
(5)
(1 04)
(1 7 5)
(204)
(3)
(6)
(246)
–
(1 1 8)
(5)
(1 05)
(1 37 )
(1 7 1 )
(3)
(6)
(234)
–
(1 29)
(5)
(1 06)
(1 43)
(21 3)
(3)
(7 )
(236)
–
(1 40)
(5)
(1 06)
(1 51 )
(331 )
(3)
(7 )
(238)
–
(1 51 )
(5)
(1 07 )
(1 7 3)
(402)
(3)
(7 )
(237 )
(4)
(1 62)
(5)
(1 08)
(1 95)
(504)
(3)
(8)
(241 )
(4)
(1 7 4)
(5)
(1 09)
(21 8)
(595)
(3)
(8)
(246)
(4)
(1 85)
(5)
(1 1 0)
(242)
(683)
(3)
(8)
(250)
(4)
(1 97 )
(5)
(1 1 1 )
(266)
(81 1 )
(3)
(9)
(255)
(5)
(209)
(5)
(1 1 2)
(280)
(908)
(3)
(9)
(259)
(5)
(3)
(855)
(3)
(7 81 )
(3)
(845)
(3)
(984)
(3)
(1 ,092)
(3)
(1 ,234)
(3)
(1 ,365)
(3)
(1 ,494)
(3)
(1 ,664)
(3)
(1 ,7 93)
(1 7 5)
(1 37 )
(1 38)
(1 39)
(1 40)
(1 41 )
(1 42)
(1 43)
(1 44)
(1 45)
(7 29)
(38)
(46)
(48)
(50)
(56)
(56)
(55)
(55)
(55)
(62)
(239)
(522)
(1 1 7 )
(330)
(1 1 7 )
(300)
(1 1 7 )
(304)
(1 1 7 )
(307 )
(1 1 7 )
(31 3)
(1 1 7 )
(31 4)
(1 1 7 )
(31 5)
(1 1 7 )
(31 6)
(1 1 7 )
(31 7 )
(1 1 7 )
(325)
(585)
(1 ,1 7 1 )
(1 ,553)
(3,1 39)
($10,212)
($10,508)
($11,326)
($11,57 1)
($11,887 )
($12,036)
($12,260)
($12,554)
($12,960)
($13,105)
($55,504)
($118,419)
(236)
(7 ,000)
(200)
(405)
(27 7 )
(7 ,1 1 4)
(1 50)
–
(31 5)
(7 ,226)
(5)
–
(308)
(7 ,337 )
(5)
–
(1 86)
(7 ,448)
(5)
–
(1 1 3)
(7 ,561 )
(5)
–
(1 1 4)
(7 ,67 6)
–
–
(1 1 5)
(7 ,7 94)
–
–
(1 1 5)
(7 ,91 7 )
–
–
(1 1 6)
(8,046)
–
–
(1 ,322)
(36,1 24)
(365)
(405)
(1 ,895)
(7 5,1 1 8)
(37 0)
(405)
($18,052)
($18,049)
($18,87 2)
($19,221)
($19,526)
($19,7 15)
($20,049)
($20,463)
($20,992)
($21,267 )
($93,7 20)
($196,206)
53
General Fund Expenses (ex. AUC/AAC and Debt Service)
(4,836)
(42,7 37 )
($35,51 9)
(9,7 92)
(88,432)
AAC/AUC
54
55
AUC and AAC ex . Catch-Up Pay ments (1 )
AAC/AUC
(4,7 29)
(4,7 29)
(1 0,588)
(1 0,588)
Maintenance Capital Expenditures
56
57
Run-Rate Capital Ex penditures (ex cl. growth Capex )
Maintenance Capital Expenditures
(1 ,928)
(1 ,928)
(4,1 54)
(4,1 54)
Component Units, Non-GF Funds and Enterprise Funds
58
59
60
61
62
63
64
65
66
67
68
Net Deficit of Special Rev enue Funds ex . Tax Rev enues (2)
PRCCDA Ex penses
PRIDCO Ex penses
UPR Ex penses
Net Op. Deficit of Other Independently Projected Component Units ex . Tax Rev s. (3)
Net Deficit of Select Component Units ex . Tax Rev enues (4)
Net Deficit of Enterprise Funds (5)
HTA Operational Ex penses (ex cl. Debt Serv ice, T. Moscoso and Capex )
Teodoro Moscoso Ex penses (ex cl. Debt Serv ice and Capex )
Allocation of SUT to Cine
Component Units, Non-GF Funds and Enterprise Funds
(648)
(1 ,57 5)
(24)
(528)
(7 7 9)
(1 ,320)
(1 3)
(34)
(1 ,1 91 )
(4)
(1 6)
(49)
(1 ,07 9)
(1 ,980)
(4,820)
(26)
(7 6)
(2,442)
(26)
(32)
(4,557 )
(1 2,1 07 )
Disbursements of Tax Revenues to Entities Outside Plan
69
Cigarette and Rum Shipment Ex cise Tax Related Outflows
70
Lotteries Related Outflows - Munis & Other
71
Allocation of SUT to FAM
72
Disbursements of Tax Revenues to Entities Outside Plan
73
Adjusted Ex penses
74
75
76
77
78
GDB Loan and Net Deposit Outflows
Federal Programs
Federal Ov ersight Board Implemented by PROMESA
AUC Catch-Up Pay ments (6)
T otal Noninterest Ex penditures
(1)
(2)
(3)
(4)
(5)
(6)
(1 ,446)
Incremental contributions represent the Annual Additional Contributions (“AAC”) required to be paid to the Teachers and Judicial Retirement Systems and the Additional Uniform Contribution (“AUC”) required to be paid to the Employees
Retirement System based on estimates provided by the Commonwealth’s actuaries incorporating updated assumptions regarding items such as changes in the size of the active membership and future payroll assumptions consistent with the
Fiscal Plan.
Deficit for Special Revenue Funds calculated after removing tax revenues, which are shown separately.
Certain component unit projections were developed by consulting with management including: ASEM, ASES, ADEA, Cardiovascular Center, PBA, PRITA, Ports Authority and Tourism Company.
Represents the net income estimates of entities without bonded debt that have historically resulted in a deficit. Note that numbers are shown excluding capital expenditures, which are shown elsewhere. Forward estimated based on review of
historical results.
Includes Unemployment Insurance and 9-1-1 Services Governing Board. Excludes Drivers Insurance and Disability Insurance, which are restricted funds.
Catch-up payments are AUC or AAC payments due in 2014, 2015 and/or 2016 that were not paid by the General Fund but are assumed to be paid in 2017.
98
Summary Page – Financing Gap
The following table presents a detailed summary of the Base Financing Gap after debt service
and the financing gap after the measures identified in the Fiscal Plan
Note that no U.S. government action related to equitable healthcare treatment is assumed below
The incremental income from economic development below includes the potential benefits of a change in the Commonwealth’s real economic trajectory in the Base Projections
from negative 1.7% to an average of 0.1% growth, driven in part by $10 billion in new spending to promote stability and growth
T otal
2017 P
79
Financing Gap Pre-Debt Serv ice, Pre-Measures
Debt Serv ice Net of Ex isting Reserv es
Consolidated Interest
2018P
2019P
2020P
2021P
2022P
2023P
2024P
1,013
($114)
($1,941)
($2,251)
($2,540)
($2,7 7 7 )
($3,120)
($3,530)
2025P
2026P
5 Yr
10 Y r
($4,116)
($4,37 4)
($5,832)
($23,7 48)
(1)
(2,37 3)
(2,31 9)
(2,239)
(2,1 69)
(2,1 1 8)
(2,062)
(2,025)
(1 ,97 4)
(1 ,97 2)
(1 ,91 0)
(1 1 ,21 7 )
(21 ,1 60)
81
Consolidated Principal
(1 ,094)
(957 )
(1 ,628)
(1 ,299)
(1 ,31 5)
(1 ,1 30)
(1 ,1 09)
(1 ,57 5)
(1 ,07 8)
(1 ,394)
(6,294)
(1 2,57 9)
82
Missed Principal and Interest Pay ments
(1 ,37 5)
–
–
–
–
–
–
(1 ,37 5)
(1 ,37 5)
83
TDF Guaranteed Debt Serv ice (2)
(1 55)
(37 )
(6)
(5)
(5)
(5)
(5)
(5)
(5)
(227 )
(251 )
84
Use of Ex isting Debt Serv ice Reserv es
37 9
19
–
–
–
–
–
–
–
–
398
398
(4,618)
(3,294)
(3,87 2)
(3,493)
(3,438)
(3,197 )
(3,138)
(3,554)
(3,055)
(3,308)
(18,7 15)
(34,967 )
(3,605)
(3,408)
(5,813)
(5,7 44)
(5,97 8)
(5,97 4)
(6,258)
(7 ,084)
(7 ,17 1)
(7 ,682)
(24,547 )
(58,7 16)
(3)
(30)
(33)
(3)
–
(3)
(3)
–
(3)
(3)
–
(3)
(3)
–
(3)
(3)
–
(3)
(3)
–
(3)
(3)
–
(3)
(3)
–
(3)
(3)
–
(3)
(1 5)
(30)
(45)
(30)
(30)
(60)
80
85
86
T otal Debt Serv ice Net of Ex isting Reserv es
T otal Estim ated Financing Gap before Measures
–
–
–
(25)
Im prov e Budgetary Controls and Fiscal and Econom ic Decision-Making
87
88
89
Adopt Institute of Statistics / Planning Board Fiv e-Y ear Plan
Install New Accounting and Financial Sy stems
T otal Meas. Aim ed at Im prov e Budg. Controls and Decision-Making
Rationalize Ex penditures and T ax Policy to Prom ote Efficiency
Ex pense Measures
Reduce Operating Costs
90
Achiev e Operational Efficiencies
–
36
41
42
44
45
1 48
37 1
91
Establish Centralized Procurement Sy stem
–
60
80
1 20
1 20
1 22
1 24
1 27
1 29
1 31
380
1 ,01 3
92
Employ ee Attrition (incl. Department of Education)
–
1 31
1 55
225
229
233
237
242
246
251
7 40
1 ,949
93
94
Ex tend Law 66 / Implement Long-Term Budgetary Reform
Reduce Operating Costs
–
–
28
17 8
397
257
528
336
7 23
41 6
807
43
400
7 98
384
7 90
368
7 81
45
353
773
46
338
7 66
1 ,1 87
3,030
2,455
6,364
Right-Size Department of Education
95
Ex ecute School Consolidation Plan
96
Ov erhaul School-Based Management and Operations
97
Right-Size Department of Education
–
–
–
28
14
42
57
14
71
85
14
99
113
14
1 27
115
14
1 29
117
15
1 31
119
1 21
1 23
15
15
15
1 34
1 36
1 39
283
56
339
87 8
1 30
1 ,008
Control Healthcare Costs
98
Implement Functional P3s at State Hospitals
(2)
12
24
24
24
24
25
25
26
26
82
99
Integrate Gov ernment Hospitals into Single Organization
(2)
10
19
19
19
19
20
20
20
21
65
8
15
15
15
15
16
16
16
16
53
1 32
–
30
30
30
30
31
31
32
32
33
1 20
27 8
–
5
5
5
5
5
5
5
5
5
20
93
93
93
96
98
1 00
Implement STAR Ratings Sy stem and Scale Pay ments
–
1 01
Standardize Health Protocols and Impose Uniform Fee Schedules
Reduce Number of 330s as IPAs Under Mi Salud
1 02
1 03
Control Healthcare Costs
(4)
65
95
1 00
1 02
340
209
1 65
46
830
Cut Governmental Subsidies
1 04
Reduce Subsidies to Municipalities
1 05
Modify Special Laws Benefits
1 06
Cut Governmental Subsidies
–
–
–
–
47
47
50
46
96
1 00
45
1 45
200
44
300
43
300
42
300
41
300
40
300
39
244
343
342
341
340
339
67
67
350
1 82
532
1 ,850
387
2,237
Rev enues Measures
1 06
Implement and Enforce Tax Policy
1 07
Lev erage Tech and Training to Incr. Capture Rates and Improv e Tax Admin
10
41
56
65
67
67
67
67
239
1 08
Restrict Use of Tax Amnesties and Closings
–
25
25
25
25
25
25
25
25
25
1 00
1 09
Implement and Enforce Tax on V ideo Lottery Games
–
55
70
81
77
75
72
69
66
64
283
629
110
Address Upcoming Act 1 54 Rev enue Cliff
–
481
962
962
962
962
962
962
962
962
3,367
8,1 7 7
111
111
Implement and Enforce Tax Policy
T otal Measures Aim ed at Rationalizing Ex penditures and T ax Policy
57 4
225
10
602
1 ,1 1 3
1 ,1 33
1 ,1 31
1 ,1 29
1 ,1 25
1 ,1 23
1 ,1 20
1 ,1 1 8
3,989
9,605
6
1,153
1,901
2,192
2,403
2,494
2,485
2,47 7
2,47 0
2,464
7 ,655
20,044
Enact Stuctural Econom ic Measures and Inv est in Growth
112
Establish a Local EITC Program
113
114
115
Pay Local Businesses for Past Serv ices and Pay Tax Refunds
Build Deposits to Prov ide Confidence
Inv est in Incremental Maintenance Capex ov er Run-Rate
116
Inv est in Economic Growth Projects
117
T otal Measures Aim ed at Enacting Structural Reform and Growth
118
119
Protect Vulnerable Stakeholders
Implement Pension Sy stem Reform
T otal Measures Aim ed at Protecting Vulnerable Stakeholders
1 20
T otal Measures Im pact
1 21
Residual Est. Financing Gap after Measures ex . Growth
1 22
1 23
Est. Incremental Income from Econ. Dev . and Structural Reforms
Residual Est. Financing Gap after Measures incl. Growth
(1)
(2)
–
(565)
(21 4)
(1 41 )
(1 50)
(1 50)
(1 50)
(1 50)
(1 50)
(1 50)
(1 50)
(1 50)
(1 50)
(600)
(1 ,350)
(27 2)
(21 4)
(528)
(27 2)
(21 4)
(397 )
(27 2)
(21 4)
(27 3)
(27 2)
(21 4)
(1 03)
–
–
(1 04)
–
–
(1 06)
–
–
(1 08)
–
–
(1 1 0)
–
–
(1 1 2)
(1 ,653)
(1 ,069)
(1 ,442)
(1 ,653)
(1 ,069)
(1 ,983)
(54)
(400)
(466)
(47 6)
(353)
(31 6)
(1 87 )
(1 1 3)
(1 03)
(1 03)
(1 ,7 49)
(2,57 2)
(97 4)
(1,564)
(1,499)
(1,385)
(1,091)
(57 0)
(443)
(37 1)
(363)
(366)
(6,514)
(8,627 )
(1 66)
(166)
(1 66)
(166)
(1 1 6)
(116)
(1 1 6)
(116)
(1 1 6)
(116)
(1 1 6)
(116)
(1 1 6)
(116)
(1 1 6)
(116)
(1 1 6)
(116)
(1 1 6)
(116)
(681 )
(681)
(1 ,263)
(1,263)
($1,167 )
($581)
($4,7 7 2)
($3,988)
($5,530)
–
202
$283
340
($4,7 7 2)
($3,7 86)
($5,190)
$687
($5,056)
501
($4,556)
$1,193
$1,804
$1,922
$1,987
$1,987
$1,97 9
($4,7 85)
($4,169)
($4,335)
($5,097 )
($5,184)
($5,7 03)
7 18
939
1 ,1 85
1 ,61 2
1 ,7 82
($4,068)
($3,231)
($3,57 2)
($3,921)
($3,150)
1 ,427
($3,67 0)
$415
($24,132)
1 ,7 61
($22,37 1)
$10,094
($48,621)
8,7 07
($39,914)
The debt service payment schedule is based in part on publicly available information from the GDB website and Bloomberg as well as information provided by Hacienda and GDB. All parties should consult the relevant
governing debt documents to determine their own views as to the debt service obligations for the debt shown below. Note that, as in the Krueger Report, the following debt service payment schedule only summarizes bonded
debt service for the entities included in the Fiscal Plan (with the exception of the 2013B GDB notes and GSA lines, both of which are private lending arrangements). Other debt service for private bank lines may be embedded in
the projections for certain component units and public corporations. Such amounts are not material.
Includes debt service of certain TDF guaranteed bonds and loans.
99


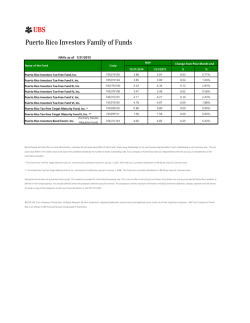
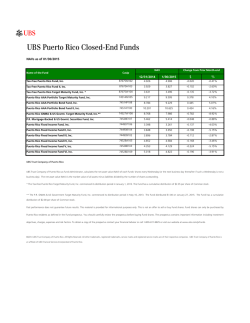
© Copyright 2026