
World Energy Resources 2016
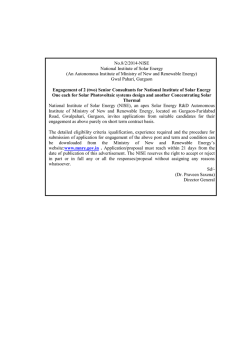
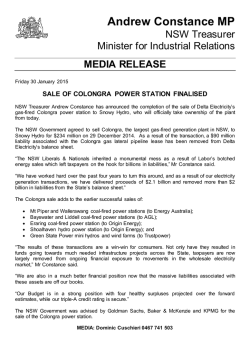
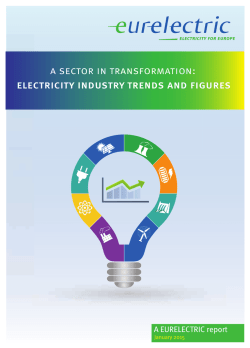
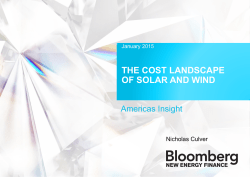
World Energy
Resources 2016
ABOUT THE WORLD ENERGY
COUNCIL
ABOUT THE WORLD ENERGY
RESOURCES
The World Energy Council is the principal
impartial network of energy leaders and
practitioners promoting an affordable, stable
and environmentally sensitive energy system
for the greatest benefit of all.
The World Energy Resources have been
produced by the World Energy Council for
over 80 years. The details and analysis provide
a unique data set that allows governments,
private sector and academia to better
understand the reality of the energy sector
and the resource developments.
Formed in 1923, the Council is the UNaccredited global energy body, representing
the entire energy spectrum, with over
3,000 member organisations in over
90 countries, drawn from governments,
private and state corporations, academia,
NGOs and energy stakeholders. We inform
global, regional and national energy strategies
by hosting high-level events including the
World Energy Congress and publishing
authoritative studies, and work through our
extensive member network to facilitate the
world’s energy policy dialogue.
Further details at www.worldenergy.org
and @WECouncil
Published by the World Energy Council 2016
Copyright © 2016 World Energy Council.
All rights reserved. All or part of this publication
may be used or reproduced as long as the
following citation is included on each copy
or transmission: ‘Used by permission of the
World Energy Council’
www.worldenergy.org
World Energy Council
Registered in England and Wales
No. 4184478
VAT Reg. No. GB 123 3802 48
Registered Office
62–64 Cornhill
London
EC3V 3NH
United Kingdom
ISBN: 978 0 946121 29 8
In partnership with XX Organisation
The assessments are complied with our network
of member committees in over 90 countries
along with a panel of experts who provide
insights from across the globe. With information
covering more than 180 countries this is the 24th
edition of the World Energy Resources report.
FOREWORD
Sufficient and secure energy is the main enabler for welfare and economic
development of a society. As energy-related activities have significant environmental
impacts, it is indispensable to provide an energy system which covers the needs of
the economies and preserves the environment.
Fundamental structural changes in the energy sector, called energy transitions, occur
worldwide. Motivation, objectives and priorities for implementing energy transitions
differ, but could mostly be related back to the Energy Trilemma. Securing the energy
supply, increasing competitiveness by using least-cost approaches, environmental
concerns or a mixture of these aspects are the main drivers.
The diversification of technologies and resources, now applied in the energy sector,
creates many opportunities, but the enlarged complexity also leads to increased
challenges. With the existing level of volatility, relying on solid facts and data as basis
for strategic decision making by the relevant stakeholders, such as governments,
international organisations and companies, is becoming even more important than
in the past.
In principal, the need for solid foundations is nothing new. In 1923, the founders of
the World Energy Council came together to better understand the reality of the
energy landscape. One of the most-established flagship programs is the Survey of
Energy Resources (SER). The first edition of the SER was published in 1933. Since
then this report has been released during the World Energy Congress. World Energy
Resources 2016 is the title of the new publication and in fact is the 24th edition,
celebrating 83 years of existence.
The reputation and value of the study rests on three main factors: the study presents
unbiased data and facts from an independent and impartial organisation, it covers the
technological, economic and environmental aspects of conventional and renewable
sources, and it provides assessments on global, regional and country levels prepared
by an international network of respected experts. The quality of the report has been
further enhanced by the collaboration with a number of international organisations
and companies in our Knowledge Networks. In particular, IRENA for renewable
energy technologies and the German Federal Institute for Geosciences and natural
resources on fossil and nuclear fuels data.
The report includes 13 chapters, which cover oil, gas, coal, uranium & nuclear, hydro
power, wind, solar, geothermal, marine, bioenergy, waste-to-energy and two crosscutting topics, energy storage and CC(U)S. Each of the chapters follow a standard
1
structure with sections on definitions and classification, technologies, economics
and markets, socio-economics, environmental impacts, outlook and data tables
by countries.
The world around us has changed over the past three years since the previous WER
was published. The following principal drivers can be mentioned which have been
shaping energy supply and usage in recent years:
• The climate pledges in connection with the Paris Agreement which form
a milestone in international efforts to tackle climate change
• The record deployment of renewable energies, in particular wind and solar
capacity for power generation, which increased globally by 200 Gigawatt
between 2013 and 2015
• The halving of the world market price for oil, from more than 100 US$/Barrel
to less than 50 US$/Barrel
• The shale gas boom in North America
• The decrease in the global coal consumption, which occurred in 2015 for the
first time in the current century, mainly caused by China´s transition to a less
energy-intensive society
• The achieved progress in the implementation of CC(U)S technologies, in
particular in North America
• The growing electrification, in particular in the transport sector, with 1 million
electric vehicles on the roads, still well under 1 % of the global car fleet, but
getting stronger
I am deeply grateful to all those who helped to produce the 2016 report, including
Study Group Members, World Energy Council Member Committees, leading
energy institutions and individual experts. My special thanks for the coordination,
guidance and management to the the Council Secretariat with excellent and highly
professional contributions from Zulandi van der Westhuizen, Deputy Director,
Scenarios & Resources.
Hans-Wilhelm Schiffer
Executive Chair World Energy Resources
2
CONTENTS
FOREWORD 1
EXECUTIVE SUMMARY
4
INTRODUCTION
9
1. COAL
14
2. OIL
16
3. NATURAL GAS
18
4. URANIUM AND NUCLEAR
20
5. HYDROPOWER
22
6. BIOENERGY
24
7. WASTE-TO-ENERGY
26
8. SOLAR ENERGY
28
9. GEOTHERMAL ENERGY
30
10. WIND ENERGY
32
11. MARINE ENERGY
34
12. CARBON CAPTURE AND STORAGE (CCS)
36
13. E-STORAGE
38
LIST OF TABLES AND FIGURES
40
ACKNOWLEDGEMENTS 43
3
WORLD ENERGY COUNCIL | RESOURCES
EXECUTIVE SUMMARY
The past 15 years have seen unprecedented change in the consumption of energy
resources. Unexpected high growth in the renewable energies market, in terms
of investment, new capacity and high growth rates in developing countries
have changed the landscape for the energy sector. We have seen the growth of
unconventional resources and improvements in technology development for all
forms of energy resources. This has contributed to falling prices and the increased
decoupling of economic growth and GHG emissions. Most countries have achieved
a more diversified energy mix with a growth in community ownerships and an
evolution of micro grids.
To better understand these unprecedented changes the 2016 World Energy
Resources report highlights the key trends and identifies the implications for the
energy sector.
KEY FINDINGS
SOLAR
Global installed capacity for solar-powered electricity has seen an exponential
growth, reaching around 227 GWe at the end of 2015, producing 1% of all electricity
used globally.
The total capacity for solar heating and cooling in operation in 2015 is estimated
at 435 GWth.
As solar PV module prices have declined around 80% since 2007 (from ~ US$4/W
in 2007 to ~ US$1.8/W in 2015), the cost associated with balancing the system
represents the next great challenge for the Solar PV industry.
E-STORAGE
E-storage has been characterised by rapid change, driven by reduced costs
(especially batteries) and increased industry requirement to manage system volatility.
As of end-2015, the global installed storage capacity was 146 GW, consisting
of 944 projects. There are already around 25 000 residential-scale units in
Germany alone.
Bottom-up projections suggest a global storage market of 1.4 GW/y by 2020, with
strong growth in electro-mechanical technologies in particular.
4
WORLD ENERGY COUNCIL | RESOURCES
MARINE ENERGY
0.5 GW of commercial marine energy generation capacity is in operation and another
1.7 GW under construction, with 99% of this accounted for by tidal range.
The total theoretical wave energy potential is said to be 32 PWh/y, but is
heterogeneous and geographically distributed, technology costs for marine energy
are still very high, hindering deployment.
URANIUM AND NUCLEAR
Global uranium production increased by 40% between 2004 and 2013, mainly
because of increased production by Kazakhstan, the world’s leading producer.
As of December 2015, 65 nuclear reactors were under construction with a
total capacity of 64 GW. Two-thirds (40) of the units under construction are located
in four countries: China, India, Russia and South Korea.
Currently there are more than 45 Small Modular Reactors designs under
development and four reactors under construction.
W A S T E -T O - E N E R G Y
Despite Waste-to-Energy (WtE) occupying less than 6% of the total waste
management market, the global WtE market was valued at approximately
US$25 billion in 2015 and is expected to reach US$36 billion by 2020, growing
at CAGR of around 7.5% between 2015 and 2020.
HYDROPOWER
Hydropower is the leading renewable source for electricity generation globally,
supplying 71% of all renewable electricity at the end of 2015. Undeveloped potential
is approximately 10 000 TWh/y worldwide.
The global hydropower capacity increased by more than 30% between 2007 and
2015 accounting to a total of 1 209 GW in 2015, of which 145 GW is pumped storage.
OIL
Oil remained the world’s leading fuel, accounting for 32.9% of global energy
consumption. Crude oil prices recorded the largest percentage decline
since 1986 (73%).
Roughly 63% of oil consumption comes from the transport sector. Oil substitution
is not yet imminent and is not expected to reach more than 5% for the next
five years.
5
WORLD ENERGY COUNCIL | RESOURCES
Unconventional oil recovery accounts for 30% of the global recoverable oil reserves
and oil shale contains at least three times as much oil as conventional crude oil
reserves, which are projected at around 1.2 trillion barrels.
N AT U R A L G A S
Natural gas is the second largest energy source in power generation, representing
22% of generated power globally and the only fossil fuel whose share of primary
energy consumption is projected to grow.
WIND
Global wind power generation capacity reached 432 GW in 2015, around 7% of
total global power generation capacity (420 GW onshore, 12 GW offshore). A record
of 63 GW was added in 2015 and total investment in the global wind sector was
US$109 billion in 2015.
COAL
Coal production declined with 0.6% in 2014 and with a further 2.8% in 2015, the first
decline in global coal production growth since the 1990s.
Coal still provides around 40% of the world’s electricity. However, climate change
mitigation demands, transition to cleaner energy forms and increased competition
from other resources are presenting challenges for the sector.
Asia presents the biggest market for coal and currently accounts for 66% of global
coal consumption.
CCS
CCS is an essential element of any low carbon energy future, but policy is the main
issue, not technology. The world’s first large-scale application of CO2 capture
technology in the power sector commenced operation in October 2014 at the
Boundary Dam power station in Saskatchewan, Canada.
There are 22 large-scale CCS projects currently in operation or under construction
around the world, with the capacity to capture up to 40 million tonnes of
CO2 per year (Mtpa).
GEOTHERMAL
Geothermal global output is estimated to be 75 TWh for heat and 75 TWh for power,
but is concentrated on geologic plate boundaries.
BIOENERGY
Bioenergy is the largest renewable energy source with 14% out of 18% renewables
in the energy mix and supplies 10% of global energy supply.
6
WORLD ENERGY COUNCIL | RESOURCES
FIGURE 1: COMPARATIVE PRIMARY ENERGY
CONSUMPTION OVER THE PAST 15 YEARS
COMPARATIVE PRIMARY ENERGY CONSUMPTION
5.73%
6.05% 0.22% 1.01%
0.54%
5.14%
6.44% 0.63% 0.06%
2005
22.89%
28.61%
0.70%
4.44%
2010
35.96%
29.84%
23.70%
6.79% 1.44%
0.45%
0.89%
2015
33.49%
23.85%
Oil
Gas
Hydro
Solar
Coal
Nuclear
Wind
Other renewables
29.20%
IMPLICATIONS FOR THE ENERGY SECTOR
There is already significant transition in the sector, however there are some
challenges that remain:
Despite some notable progress, the rate of improvements towards cleaner energy
is far slower than required to meet emissions targets. Public acceptance remains
a challenge, regardless of the energy source, with an increased ‘Not in my back yard’
(‘NIMBY’) attitude to the development of energy sources. Increased commodity and
energy price uncertainty, that results in higher risk, and larger investments with long
lead times are less appealing.
Without diversification and review of business models, national and international oil
and gas companies could struggle over the medium to long term. Incentive-assisted
renewable energy companies have created a boom in certain countries and regions.
However, as incentives are decreased, some companies might not be viable anymore.
Rare earth elements, used in especially renewable energies, create new dependencies
in the value chain and could represent possible future barriers to growth. Change
is at its slowest at the moment, but our research identifies that technologies will
change a lot quicker and the regulatory system is not keeping up, which may also
become a barrier.
7
32.94%
WORLD ENERGY COUNCIL | RESOURCES
Liberalised markets could reach their limit, as the lowest cost generation in the short
term can be perceived to provide the highest value. There is a significant need to
balance other aspects of the Energy Trilemma such as environmental considerations,
including increased resilience and security of supply. This is particularly important
for long-term planning in short-term power operations, with the lack and lag of new,
expanded, upgraded and smart infrastructure offering the potential to hinder new
energy developments.
Heat generation and cooling technologies are lagging behind in terms of innovation.
Increased use of natural gas combined with decreased use of coal will see energy-associated carbon dioxide emissions from natural gas surpass those from coal. Failure
to timeously plan for replacement of decommissioned baseload power plants might
pose a risk to energy reliability in some countries.
All of this creates a highly dynamic context for the energy sector.
8
WORLD ENERGY COUNCIL | RESOURCES
INTRODUCTION
In 2016 we are celebrating 83 years since the first publication World Energy
Resources (WER) in 1933. In this edition (24th) we cover 11 energy resources,
together with Carbon Capture and Storage (CCS) and energy-storage as
two relevant technologies.
This report presents a short summary of the full World Energy Resources report
that comprises a comprehensive and unique set of global energy resources data
and related information. This information allows energy decision-makers to
better understand the reality of the energy sector and the resource developments.
With more than 3 million downloads per year, the WER flagship study is a
reference tool for governments, industry, investors, IGOs, NGOs, academia and
the general public.
The various chapters are compiled with our network of member committees in
over 90 countries along with a panel of experts who provide insights from across
the globe.
WHAT HAS CHANGED?
Since the previous publication, some emerging energy issues have solidified the
level and extend of their impact on the energy environment. This would include
the CoP 21 Agreement in Paris; the continued increase in demand in China and India;
continued increase in growth in renewable energies; and growth in unconvential
9
WORLD ENERGY COUNCIL | RESOURCES
oil and gas. During this time, we have also experienced new developments such
as the low oil and gas price; the role of new technologies and the rise of community
ownership and co-operatives in the energy sector.
With long investment and long lead times, the energy industry has traditionally
been a long-term industry and therefore change could take a fairly long time,
especially on a global scale. When the global primary energy consumption numbers
over the past 15 years are compared, the changes are quite remarkable. Although
the global energy transition towards cleaner energy production is not moving
at the speed we would like, it is definitely gaining momentum. Figure 1 shows the
increased growth in renewable energy consumption in the context of the other
primary energy sources and Figure 2 gives the percentage of renewable energy
in electricity production in the various regions. Given that roughly 25% of global
greenhouse (GHG) emissions come from the electricity sector, this is a very positive
development. The transport sector consumes about 27% of energy demand, but
is roughly responsible for 14% of GHG emissions. This compares relatively well
to industry, consuming about 28% of energy demand and being responsible for
21% of GHG emissions.
With buildings consuming approximately 34% of energy demand, being responsible
for 6% of GHG emissions, and urbanisation increasing in most areas of the world,
it is clear that innovative technologies and design in urban areas can be instrumental
in achieving long term sustainability of the global energy system.
10
WORLD ENERGY COUNCIL | RESOURCES
FIGURE 2: SHARE OF RENEWABLE ENERGY
(INCLUDING HYDRO) IN ELECTRICITY PRODUCTION
Region
Share of renewable
energy in electricity
production (incl.
hydro) (%) in 2010
Share of renewable
energy in electricity
production (incl.
hydro) (%) in 2005
Share of renewable
energy in electricity
production (incl.
hydro) (%) in 2015
Africa
16.9%
17.4%
18.9%
Asia
13.9%
16.1%
20.3%
CIS
18%
16.7%
16.1%
Europe
20.1%
25.7%
34.2%
Latin America
59.3%
57.7%
52.4%
Middle East
4.3%
2.0%
2.2%
North America
24%
25.8%
27.7%
17.9%
18.6%
25.0%
Pacific
Source: Enerdata (2016) Energy Statistical Yearbook
Shale oil and gas technology is unlocking development of more resources at lower
costs. In addition to potentially vast shale oil and gas resources, the development
of renewables is increasing and becoming cost competitive. Also, energy efficiency
is increasing while energy intensity is decreasing, but this is counteracted by
population growth, economic growth and increased access to electricity, in especially
developing areas of the world.
The effects of Brexit on the EU and the UK energy policy still remain uncertain
and major changes cannot be expected in the near future. Planned investments
and financing of energy infrastructure is likely to be delayed in the UK, and if some
European utilities or investors decide to leave the UK, it could mean a reallocation
of capital into Europe and elsewhere.
For oil and gas producers around the world, 2016 is a year of further cost cutting,
restructuring, refinancing when possible, and, in some cases bankruptcy. The
transition to cleaner energy means funding for fossil fuel projects are becoming
more difficult and therefore it warrants a closer look at possible future impacts
of the CoP21 Agreement.
11
WORLD ENERGY COUNCIL | RESOURCES
The role of the Paris Agreement on shaping energy developments
Deemed as a historic breakthrough in international climate policy, Article 2 of the
Paris Agreement defines the three purposes of the instrument: to make mitigation
effective by holding the increase of temperature well below 2°C, pursuing efforts
to keep warming at 1.5°C above pre-industrial levels; to make adaptation possible
for all parties; and to make finance available to fund low carbon development and
build resilience to climate impacts. These three outcomes have an impact on energy
developments, primarily through the adoption of commitments labelled as Nationally
Determined Contributions (NDCs), which are only “intended” (hence INDCs) until
the Agreement enters into force.
The temperature target of Paris requires a profound transformation process and an
inherently new understanding of our energy systems. Credible and effective national
policies are crucial to translate the pledges made at Paris into domestic policy.
New policies will need to be put in place and old ones revisited: carbon emissions
will be priced; energy production and consumption technologies will be regulated;
funding for research and development will be made available; and low carbon assets
will be nurtured by financial markets. Key market disruptions will be experienced by
market participants and governments alike, including stranded assets and technology
innovation.
Energy prices
It is crucial to have a level playing field where all energy sources can compete on
equal terms, but providing, at the same time, the right signals to energy consumers.
In this respect subsidies play a significant role and need to be reviewed carefully.
Acknowledging the importance of a strong carbon price signal will be key to promote
adequate consumer behavior and to enable a growth path in low-carbon investments
that is consistent with the 2ºC scenario. This includes incentives for investments
in climate solutions for supply (i.e. renewables) and demand (i.e. enhancing energy
efficiency) and ensuring protection of the environment.
Stranded assets
One of the main risks of climate change mitigation strategies is the appearance
of stranded assets due to the combination of increased societal pressures,
stricter environmental regulation (such as carbon taxes and new standards), and
technological development (i.e. cleaner energy, renewable energy or new storage
technologies). Such stranded assets can already be observed in Europe with recent
gas power plants being mothballed or decommissioned due to overcapacity caused
by penetration of renewables supported by FiTs and other schemes.
12
WORLD ENERGY COUNCIL | RESOURCES
According to the journal Nature, the untapped coal, oil and natural gas reserves
that would remain unexploited in order to meet the 2oC target could amount
to 88%, 35% and 52% of global reserves respectively. The market values of the firms
that own fossil fuels assets may undergo major changes because of the reduction
both of future revenues and the firms’ balance sheets due to the loss of value
of those assets affected by climate change mitigation actions.
Technology disruption
More options and innovative solutions that reduce carbon emissions on a large scale
are needed to make a real difference in the years ahead. Research and development
(R&D) in clean energy technologies is crucial and increased investments are required
to move from the laboratory to reality.
TRENDS IN GLOBAL RENEWABLE ENERGY LEVELISED COST OF
ELECTRICITY
IN THE
TIME PERIOD
FROM 2010
UNTIL 2015
FIGURE 3:(LCOE)
TRENDS
IN GLOBAL
RENEWABLE
ENERGY
LEVELISED COST OF ELECTRICITY (LCOE) IN THE TIME
PERIOD FROM 2010 UNTIL 2015
0.35
0.331
2015 USD/kWh
0.3
0.285
0.25
0.245
0.2
0.157
0.15
0.159
0.126
0.1
0.05
0.046 0.046
0.071
0.06
0.056 0.055
0.071
0.08
0
Hydropower
Onshore Wind
Offshore Wind
Solar Pv
2015
2010
Source:
IRENA (2016)
Source: IRENA
(2016)
13
Solar Thermal
Biomass
Geothermal
WORLD ENERGY COUNCIL | RESOURCES
1. COAL
The world currently consumes over 7 700 Mt of coal which is used by a variety of
sectors including power generation, iron and steel production, cement manufacturing
and as a liquid fuel. Coal currently fuels 40% of the world’s electricity and is forecasted
to continue to supply a strategic share over the next three decades. The tables below
show the top coal producing countries and regions in the world for 2014 and 2015.
TABLE 1: TOP COAL PRODUCING COUNTRIES
Million Tonnes
Production
Country
Total production 2014*
Total production 2015**
Australia
503.3
485
China
4000
3747
Germany
186.5
184
India
659.6
677
Indonesia
470.8
392
Kazakhstan
115.6
106
Poland
136.9
136
Russia
357
373
South Africa
253.2
252
USA
906.9
813
TABLE 2: TOP COAL PRODUCING REGIONS
Million Tonnes
Production
Region
Total production 2014*
Total Africa
Total production 2015**
265.7
266
5 651.4
5440
Total CIS
544.8
527
Total E.U.
8 795.2
528
2.8
1
989.9
888
103
98
8,176.4
7861
Total Asia Pacific
Total Middle East
Total North America
Total S. & Cent. America
World
* BGR
** BP Statistical Review of World Energy 2016
14
WORLD ENERGY COUNCIL | RESOURCES
KEY FINDINGS
1. Coal is the second most important energy source, covering 30% of global
primary energy consumption. Coal is predominantly an indigenous fuel, that
contributes to security of supply of a country. The oversupply and price of
natural gas have negatively impacted the coal industry.
2. 75% of the global coal plants utilise subcritical technology. An increase in
efficiency throughout the world from today’s average of 33% to 40% could cut
global carbon dioxide emissions by 1.7 billion tonnes each year.
3. The implementation of carbon capture utilisation and storage (CCUS) is one
of the elementary strategies for climate protection.
4. Global coal consumption increased by 64% from 2000 to 2014. That classified
coal as the fastest growing fuel in absolute numbers within the indicated
period. 2014 and 2015 witnessed the first annual decrease in global thermal
coal production of 0.7% and 2.8% respectively, since 1999.
5. China contributes 50% to global coal demand and is shifting to clean
coal technologies. India’s coal consumption is set to increase, while the US
is closing or replacing coal with gas in power plants.
FIGURE 5: 2014 COUNTRY RANKING:
FIGURE 4: 2014 COUNTRY RANKING: COAL-FIRED POWER
COAL-FIRED POWER GENERATION (TWH)
GENERATION (TWH)
China*
4090
USA*
1711
India*
868
Japan*
299
Germany*
263
South Africa*
237
South Korea*
Russia*
211
156
Australia*
152
Poland*
130
Taiwan*
120
Indonesia*
110
United Kingdom*
97
Ukraine*
80
Kazakhstan*
77
Turkey*
74
Source: IEA, Electricity Information, Paris 2015 (*for Non-OECD-countries numbers for 2013)
Source: IEA, Electricity Information, Paris 2015 (*for Non-OECD-countries numbers for 2013)
15
WORLD ENERGY COUNCIL | RESOURCES
2. OIL
Oil remains the world’s leading fuel, accounting for 32.9% of total global energy
consumption. Although emerging economies continued to dominate the growth
in global energy consumption, growth in these countries (+1.6%) was well below its
ten-year average of 3.8%.
Several structural changes are underway in the oil industry, the emergence of nonOPEC supply, the trends in energy efficiency, the diminishing role of high-sulphur
oil with the environmental pressures in the marine fuel industry and in the power
generation sector, and the emergence of unconventional oil (shale oil, heavy oil, tight
oil and tar sands), and increased production both from mature and frontier fields.
TABLE 3: GLOBAL OIL DEMAND 2014 – 2018 (MB/D)
Region
OECD
Americas
2014
2015
Change
from
’14-‘15
in %
2016
Change
from
’15-’16
in %
2017
Change
from
’16-’17
in %
24.4 0.004%
2018
Change
from
’17-’18
in %
24.1
24.2
0.004%
24.3
0.004%
24.5 0.004%
OECD
Asia
Ocean.
8.1
8.0
-0.012%
7.9
-0.012%
7.9
0%
7.9
0%
OECD
Europe
13.4
13.3 -0.007%
13.3
0%
13.2
-0.07%
13.1
-0.07%
FSU
4.8
4.6
-0.041%
4.7
0.021%
4.7
0%
4.8
0.021%
Other
Europe
0.7
0.7
0%
0.7
0%
0.7
0%
0.7
0%
China
10.4
10.6
0.019%
10.9
0.028%
11.2
0.027%
11.5 0.026%
Other
Asia
12.1
12.5
0.033%
12.9
0.216%
13.3
0.031%
13.7
0.03%
Latin
America
6.8
6.9
0.014%
7.0
0.014%
7.1
0.014%
7.2
0.014%
Middle
East
8.1
8.3
0.024%
8.5
0.024%
8.8 0.035%
9.0 0.022%
Africa
3.9
4.1
0.051%
4.2
0.024%
4.4 0.047%
4.5
0.22%
World
92.4
93.3
0.009%
94.5
0.012%
96.9
0.012%
Source: IEA
16
95.7
0.012%
WORLD ENERGY COUNCIL | RESOURCES
KEY FINDINGS
1. Emerging economies account for 58.1% of global energy consumption and
global demand for liquid hydrocarbons will continue to grow. Chinese
consumption growth slowed to 1.5%, while India (+5.2%) recorded robust
increase in consumption. OECD consumption increased slightly (+0.1%) and
a rare increase in EU consumption (+1.6%), offset declines in the US (-0.9%) and
Japan (-1.2%), where consumption fell to the lowest level since 1991.1
2. The growth of population and the consumer class in Asia will support oil
demand increase and the main increase in consumption will come from
transportation sectors. Substitution of oil in the transport sector is not yet
imminent and is not expected to reach more than 5% for the next five years.
3. Despite the temporary price drop, the fundamentals of the oil industry
remain strong. Price fluctuations seen of late have been neither unexpected
nor unprecedented. The main drivers of price changes have been the
gradual building up of OPEC spare capacity and the emergence of non-OPEC
production, especially US Light Tight Oil (LTO).
4. New and increased use of technologies such as high-pressure, hightemperature (HPHT) drilling; multi-stage fracking; development in flow
assurance for mature fields; greater sophistication in well simulation
techniques, reservoirs modelling; 3-D seismic technologies, EOR
developments are having a positive impact on safety and E&P possibilities.
FIGURE 5: PRODUCT-MARKET CONSUMPTION TRENDS
FIGURE 5: PRODUCT-MARKET CONSUMPTION TRENDS
1600
1200
Million tonnes
800
400
0
2013
2014
Middle distillates
2013
2014
Motor gasoline
2013
2014
LPG naphtha
OECD
Source: IEA Medium Term Oil Report 2015
1. IEA (2016) Oil Briefing
Source: IEA Medium Term Oil Report 2015
17
2013
2014
Aviation fuels
Non-OECD
2013
2014
Residual fuel oil
2013
2014
Other products
WORLD ENERGY COUNCIL | RESOURCES
3. NATURAL GAS
Natural gas is the only fossil fuel whose share of the primary energy mix is expected
to grow and has the potential to play an important role in the world’s transition to
a cleaner, more affordable and secure energy future. It is the number three fuel,
reflecting 24% of global primary energy, and it is the second energy source in power
generation, representing a 22% share.
Advances in supply side technologies have changed the supply landscape and created
new prospects for affordable and secure supplies of natural gas. Natural gas markets
are becoming more interconnected as a result of gas-to-gas pricing, short-term trade
and consumer bargaining power.
The future of demand is highly uncertain, new policy frameworks and continued cost
improvements will be needed to make gas more competitive. Infrastructure build out,
government support and the closure of regulatory gaps are needed to unlock the
socioeconomic and environmental benefits of natural gas.
NEW SUPPLY
LANDSCAPE RECOVERABLE RESERVES)
NEWFIGURE
SUPPLY6:
LANDSCAPE
(TECHNICALLY
(TECHNICALLY RECOVERABLE RESERVES)
Poland
Shale gas: 4.1 tcm
Tight oil: 2bn bbl
Canada
Shale gas: 16.2 tcm
Tight oil: 9bn bbl
Turkey
Shale gas: 0.7 tcm
Tight oil: 5bn bbl
Iran
Total gas: 34.0 tcm
Total oil: 158bn bbl
Russia
Total gas: 32.6 tcm
Total oil: 103bn bbl
UK LNG
$5.40
United States
Shale gas: 17.6 tcm
Tight oil: 78bn bbl
Canaport
$6.04
Henry Hub
$1.93
Mexico
Shale gas: 15.4 tcm
Tight oil: 13bn bbl
Argentina
Shale gas: 22.7 tcm
Tight oil: 27bn bbl
Belgium
LNG
$5.17
Japan LNG
$7.16
Spain
LNG
$6.09
Algeria
Shale gas: 20.0 tcm
Tight oil: 6bn bbl
Rio de
Janeiro LNG
$7.16
Qatar
Total gas: 24.5 tcm
Total oil: 26bn bbl
China
Shale gas: 31.6 tcm
Tight oil: 32bn bbl
Saudi Arabia
Shale gas: 17.0 tcm*
South Africa
Shale gas: 11.0 tcm
Tanzania
Total gas: 1.6 tcm
Mozambique
Total gas: 2.8 tcm
Current unconventional gas producer
Potential new frontier for unconventional gas
Planned unconventional gas production by 2020
Potential new supplies of conventional gas
Sources: BP Statistical Review of World Energy, EIA, FERC and Reuters
Sources: BP Statistical Review of World Energy, EIA, FERC, and Reuters
18
Australia
Shale gas: 12.2 tcm
Tight oil: 16bn bbl
*Estimate
WORLD ENERGY COUNCIL | RESOURCES
KEY FINDINGS
1. Demand projections for natural gas exports to Asia, particularly China and
Japan, have been revised down as importing nations push to improve energy
security and reduce the impact of volatile commodity markets.
2. In particular, unconventional gas, shale and CBM, reflected more than
10% of global gas production in 2014 and is entering global markets as LNG,
disrupting the global supplier landscape and creating increased competition
in regional natural gas markets.
3. The shifting dynamics in natural gas pricing in recent years can be attributed
to regional supply and demand imbalances. North America prices collapsed
in 2009, driven by a domestic oversupply, while from 2011-2013, the Japanese
nuclear drove prices higher in Asia.
4. Currently, the fall in demand in Asia and growing export capacity in Asia and
North America, have created an oversupply globally. As further supplies come
to the market, it appears likely that the current market oversupply and low
price environment will continue in the short to medium-term.
TABLE 4: REGIONAL NATURAL GAS DATA BY REGION
2015
Region
Proved Reserves
Production
R/P Ratio
Bcm
Bcf
Bcm
Bcf
Years
Africa Total
14064
496666.5
211.8
7479.2
66.4
Asia Pacific
Total
15648.1
552607.7
556.7
19658.2
28.1
Europe &
Eurasia Total
56778.4
2005109.3
989.8
34955.2
57.4
7591.5
268091.0
178.5
6302.1
42.5
80040.9
2826617.7
617.9
21821.1
129.5
12751.8
450326.0
984.0
34750.4
13.0
186874.7
6599418.0
3538.6
124966.2
52.8
LAC Total
Middle East
Total
North
America Total
Global Total
Sources: BP Statistical Review of World Energy 2015, OPEC Annual Statistical Bulletin 2015, EIA International
Energy Statistics, CIA: The World Factbook, and published national sources
19
WORLD ENERGY COUNCIL | RESOURCES
4. URANIUM AND NUCLEAR
The Fukushima accident in March 2011 resulted in a developmental hiatus and
a nuclear retreat in some countries. However, with the benefit of five years of
hindsight, the true proportions of that accident are becoming clearer: a barely
perceptible direct impact on public health, but high economic and social costs.
The assessments of global uranium resources show that total identified resources
have grown by about 70% over the last ten years. As of January 2015 the total
identified resources of uranium are considered sufficient for over 100 years’ of supply
based on current requirements.
The development of nuclear power is today concentrated in a relatively small group
of countries. China, Korea, India and Russia account for 40 of the 65 reactors that
the IAEA records as under construction in December 2015. The countries that have
historically accounted for the majority of nuclear power development are now underrepresented in new construction. Currently there are more than 45 Small Modular
Reactors designs under development and four reactors under construction.
TABLE 5: URANIUM PRODUCTION AND RESOURCES
Country
2014 Production tU
Uranium resources
(tU)<US$130/Kg
Australia
5001
1174000
Canada
9134
357500
China
1500
120000
Kazakhstan
23127
285600
Namibia
3255
248200
Niger
4057
325000
Russia
2990
216500
1919
207400
2400
59400
56252
3698900
USA
Uzbekistan
Total
Source: “Uranium 2014: Resources, Production and Demand” OECD-NEA & IAEA, 2014. Uranium: From Mine
to Mill, World Nuclear Association, 2015
20
WORLD ENERGY COUNCIL | RESOURCES
KEY FINDINGS
1. Global nuclear power capacity reached 390 GWe at the end of 2015,
generating about 11% of the world electricity. As of December 2015,
65 reactors were under construction (6 more than in July 2012) with a total
generating capacity of 64 GW.
2. The key drivers and market players defining the future of nuclear power
are different from those 20 – 30 years ago and the emerging non-OECD
economies (mainly China and India) are expected to dominate future
prospects. The increasing need to moderate the local pollution effects of fossil
fuel use, means that nuclear is increasingly seen as a means to add large scale
baseload power generation while limiting the amount of GHG emissions.
3. The low share of fuel cost in total generating costs makes nuclear the lowestcost baseload electricity supply option in many markets. Uranium costs
account for only about 5% of total generating costs and thus protect plant
operators against resource price volatility. Generation IV reactors promise
to remove any future limitation on fuel supply for hundreds of years.
4. Nuclear desalination has been demonstrated to be a viable option to meet
the growing demand for potable water around the globe, providing hope to
areas in arid and semi-arid zones that face acute water shortages.
FIGURE 8: WORLD NUCLEAR ELECTRICITY
FIGURE
1: WORLD NUCLEAR ELECTRICITY PRODUCTION, TWH
PRODUCTION, TWH
3000
2500
2000
1500
1000
500
0
1971
1975
1979
1983
1987
1991
1995
1999
Source: International Atomic Energy Agency, Power Reactor Information System
Source: International Atomic Energy Agency, Power Reactor Information System
21
2003
2007
2011
2015
WORLD ENERGY COUNCIL | RESOURCES
5. HYDROPOWER
There has been a major upsurge in hydropower development globally in recent
years. The total installed capacity has grown by 39% from 2005 to 2015, with an
average growth rate of nearly 4% per year, with most of the growth concentrated
in developing countries.
It is estimated that 99% of the world’s electricity storage capacity is in the form
of hydropower, including pumped storage.2 It provides an array of energy services
beyond power, including black start capability, frequency regulation, inertial
response, spinning and non-spinning reserve and voltage support, which are
increasingly important to the stability of the energy system. Technological innovation
in hydropower include: a) increasing the scale of turbines (1 000 MW turbine in
development), b) advanced hydropower control technologies that enable renewable
hybrids, c) both conventional and pumped storage hydropower increasingly utilised
as a flexible resource for balancing variable renewable resources.
FIGURE 9: THE CONTRIBUTION OF HYDROPOWER
THE TO A LOW
CONTRIBUTION
OF HYDROPOWER
TO A LOW CARBON FUTURE
CARBON
FUTURE
% Hydro generation
<20%
21–40%
41–60%
61–80%
C02 emissions
0–200 gCO2/kWh
81–100%
201–400 gCO2/kWh
Data not available
401–600 gCO2/kWh
601–800 gCO2/kWh
801+ gCO2/kWh
Sources: BP Statistical Review of World Energy, EIA, FERC, and Reuters
2. IEA (2014)
22
WORLD ENERGY COUNCIL | RESOURCES
KEY FINDINGS
1. Hydropower is the leading renewable source for electricity generation
globally, supplying 71% of all renewable electricity. Reaching 1 064 GW of
installed capacity in 2016, it generated 16.4% of the world’s electricity from
all sources.
2. Significant new development is concentrated in China, Latin America and
Africa. Asia has the largest unutilised potential, estimated at 7 195 TWh/y,
making it the likely leading market for future development. China accounted
for 26% of the global installed capacity in 2015, far ahead of USA (8.4%), Brazil
(7.6%) and Canada (6.5%).
3. As hydropower has good synergies with all generation technologies, its role
is expected to increase in importance in the electricity systems of the future.
This is especially true of pumped hydro used as storage, but also increasingly
to balance the volatility caused by increased renewable energy in the system.
4. Consideration of water management benefits offered by hydropower facilities
includes flood control, water conservation during droughts or arid seasons.
TABLE 6: TOP HYDROPOWER CAPACITY AS OF 2015
Country
Total Capacity end
of 2015 (GW)
Added Capacity
in 2015 (GW)
Production
(TWh)
China
319
19
1,126
USA
102
0.1
250
Brazil
92
2.5
382
Canada
79
0.7
376
India
52
1.9
120
Russia
51
0.2
160
Source: REN21, IHA (2015)
23
WORLD ENERGY COUNCIL | RESOURCES
6. BIOENERGY
The World Energy Council defines bioenergy to include traditional biomass (example
forestry and agricultural residues), modern biomass and biofuels. It represents
the transformation of organic matter into a source of energy, whether it is collected
from natural surroundings or specifically grown for the purpose.
In developed countries, bioenergy is promoted as an alternative or more sustainable
source for hydrocarbons, especially for transportation fuels, like bioethanol and
biodiesel, the use of wood in combined heat and power generation and residential
heating. In developing countries bioenergy may represent opportunities for domestic
industrial development and economic growth. In least developed countries traditional
biomass is often the dominant domestic fuel, especially in more rural areas without
access to electricity or other energy sources. There are multiple challenges and
opportunities for bioenergy as a potential driver of sustainable development.
Lower energy prices do not favour short- to medium-term development of firstgeneration biofuels and investment in research and development (R&D) for advanced
biofuels produced from ligno-cellulosic biomass, waste or non-food feedstock is also
set to decline. Decreases in crude oil and biofuel feedstock prices should lead to a
decline in ethanol and biodiesel prices. Global ethanol and biodiesel production are
both expected to expand to reach, respectively, almost 134.5 and 39 billion litres by
2024. Subsequently, both ethanol and biodiesel prices are expected to recover in
nominal terms close to their 2014 levels.
TABLE 7: SHARE OF BIOFUELS PRODUCTION BY REGION
Region
Percentage
1993
Asia Pacific
2003
2013
2014
3.3%
9.5%
10.5%
Africa
1.0%
Middle East
Europe & Eurasia
1.1%
11.1%
17.1%
16.5%
S. & Cent.
America
71.4%
49.2%
28.5%
28.7%
North America
27.4%
36.4%
44.8%
44.1%
24
WORLD ENERGY COUNCIL | RESOURCES
KEY FINDINGS
1. Bioenergy is the largest renewable energy source with 14% out of 18%
renewables in the energy mix and supplying 10% of global energy supply.
In contrast to other energy sources, biomass can be converted into solid,
liquid and gaseous fuels. It is shifting from a traditional and indigenous energy
source to a modern and globally traded commodity.
2. The primary energy supply of forest biomass used worldwide is estimated
at about 56 EJ and overall woody biomass provides about 90% of the primary
energy annually sourced from all forms of biomass. Wood is also the source
of more than 52 million tonnes of charcoal used in cooking in many countries,
and for smelting of iron and other metal ores.
3. International trade is driven by pellets (27 million tonnes in 2015) and
liquid biofuels. With biofuels being the most viable and sustainable option
in replacing oil dependency, future demand will come from the need for
renewables in transport, followed by heating and electricity sectors.
PRIMARY
ENERGY
SUPPLYENERGY
OF BIOMASS
RESOURCES
GLOBALLY IN
FIGURE
9: PRIMARY
SUPPLY
OF BIOMASS
2013RESOURCES
(WBA GLOBAL
BIOENERGY
STATISTICS 2016)
GLOBALLY
IN 2013
1%
1%
0.3 %
2%
2%
2%
3%
4%
Fuelwood
7%
Charcoal
Black Liq.
Bioethanol
MSW
Biodiesel
10%
Biogas
Forest Res.
Pellets
Ind. Res.
HVO
68%
Source: Based on data from World Bioenergy Association (2016)
25
WORLD ENERGY COUNCIL | RESOURCES
7. WASTE-TO-ENERGY
The global WtE market was valued at US$25.32 billion in 2013, a growth of 5.5% on
the previous year. WtE technologies based on thermal energy conversion lead the
market, and accounted for 88.2% of total market revenue in 2013. The global market
is expected to maintain its steady growth to 2023, when it is estimated it would be
worth US$40 billion, growing at a CAGR of over 5.5% from 2016 to 2023.
WtE remains a costly option for waste disposal and energy generation, in comparison
with other established power generation sources and for waste management.
Combustion plants are no longer a significant source of particulate emissions, owing
to the implementation of governmental regulations on emission control strategies,
reducing the dioxin emissions by 99.9%.
WASTE GENERATION PER CAPITA (KG/DAY) TO GROSS NATIONAL
INCOME
(GNI)
INGENERATION
2014 IN SELECTED
COUNTRIES
FIGURE
10:RATIO
WASTE
PER CAPITA
(KG/DAY)
TO GROSS NATIONAL INCOME (GNI) RATIO IN 2014
Waste per Capita – kg
0.3
United States
0.25
0.2
0.15
0
Mexico
China
0.1
0.05
United Kingdom
Turkey
Nigeria
Russia
Brazil
Canada
Germany
Japan
South Korea
Poland
Indonesia
India
4
$10,000
$20,000
$30,000
$40,000
$50,000
$60,000
Gross National Income per Capita, PPP – $
Source: Navigant
World
Bank (2014)
Source:Research,
Navigant
Research,
World Bank (2014)
AMOUNT OF WASTE DISPOSED IN 2012, BY TECHNIQUE
FIGURE 11: AMOUNT OF WASTE DISPOSED IN 2012,
BY TECHNIQUE
Amount disposed
(million tonnes)
400
300
200
100
0
Dumps
Landfills
Compost
Source: Hoornweg
Bhada-Tata &
(2012)
Source: &
Hoornweg
Bhada-Tata (2012)
26
Recycled
WtE
Other
WORLD ENERGY COUNCIL | RESOURCES
KEY FINDINGS
1. Europe is the largest and most sophisticated market for WtE technologies,
accounting for 47.6% of total market revenue in 2013. The Asia-Pacific market
is dominated by Japan, which uses up to 60% of its solid waste for incineration.
However, the fastest market growth has been witnessed in China, which has
more than doubled its WtE capacity in the period 2011 – 2015.
2. Biological WtE technologies will experience faster growth at an average
of 9.7% per annum, as new technologies (e.g. anaerobic digestion) become
commercially viable and penetrate the market. From a regional perspective,
the Asia-Pacific region will register the fastest growth (CAGR of 7.5%), driven
by increasing waste generation and government initiatives in China and India
and higher technology penetration in Japan.
3. It is estimated that global waste generation will double by 2025 to over
6 million tonnes of waste per day and the rates are not expected to peak by
the end of this century. While OECD countries will reach ‘peak waste’ before
2050, and East Asia and Pacific countries by 2075, waste will continue to grow
in Sub-Saharan Africa. By 2100, global waste generation may hit 11 million
tonnes per day.
GROWTH OF ALL WTE TECHNOLOGIES GLOBALLY WITH
A CONSERVATIVE FORECAST UP TO 2025
FIGURE 12: GROWTH OF ALL WTE TECHNOLOGIES
GLOBALLY WITH A CONSERVATIVE FORECAST UP TO 2025
30
Billion Dollers
25
20
15
10
5
0
Years
2010
2011
2012
2013
2014
2015
2016
2017
2018
2019
2020
2021
2022
2023
2024
2025
2.1
2.8
4.34
4.9
7
8.4
9.1
11.9
13.3
14.7
16.1
18.2
20.3
22.4
24.5
26.6
All WTE technologies
Source: Ouda & Raza (2014)
Source: Ouda & Raza (2014)
27
WORLD ENERGY COUNCIL | RESOURCES
8. SOLAR ENERGY
Global installed capacity for solar-powered electricity has seen an exponential
growth, reaching around 227 GWe at the end of 2015. It produced 1% of all electricity
used globally. Major solar installation has been in regions with relatively less solar
resources (Europe and China), while potential in high resource regions (Africa and
Middle East) remains untapped. Germany has led PV capacity installations over
the last decade and continues as a leader followed by China, Japan, Italy and the
United States.
Expansion of solar capacity could be hindered by existing electricity infrastructure,
particularly in countries with young solar markets. Solar PV and other renewable
technologies are highly dependent on rare earth elements, which, besides general
unstainable mining practices, also carries a high risk of some supply disruption.
SOLAR PV CAPACITY IN 2014 AND ADDITIONS IN 2015,
TOP 10 COUNTRIES, (GW)
FIGURE 13: SOLAR PV CAPACITY IN 2014 AND ADDITIONS
IN 2015, TOP 10 COUNTRIES, (GW)
70
60
15.2
50
40
44
30
1.5
39.7
11
34.4
7.3
25.6
20
10
0.3
18.91
3.7
0.9
6.5
9.66
0
China
Germany
Japan
United States
Italy
PV Capacity in 2014 GW
Source: REN21 (2016)
Source: REN21 (2016)
28
United
Kingdom
France
2015 additions GW
2
0.9
0.1
4.66
5
5.1
Spain
India
Australia
WORLD ENERGY COUNCIL | RESOURCES
KEY FINDINGS
1. Costs for solar power are falling rapidly and “grid parity” has been achieved
in many countries, while new markets for the solar industry are opening
in emerging and developing countries. Policy and regulatory incentives,
oversupply of installation components, and advancements in technology
are driving the reduction in cost.
2. Technology is constantly improving, and new technologies such as Perovskite3
cells are approaching commercialisation. While there has been continuous
improvement in the conversion efficiency of PV cells, concentrated
photovoltaics (CPV) may hold the key in enabling rapid increases in solar
energy efficiency, recently reaching 46% for solar cells.
3. In order to prevent environmental damage from solar PV, there is a need for
strict and consistent regulation on processes over the entire life-cycle of
infrastructure. Disposal and recycling must be considered as more modules
reach the end of their lifespan.
AVERAGE LEVELISED COST OF ELECTRICITY FOR SOLAR PV
AND CSP IN 2014, BY REGION
FIGURE 14: AVERAGE LEVELISED COST OF ELECTRICITY
FOR SOLAR PV AND CSP IN 2014, BY REGION
0.3
2014 USD/kWh
0.25
0.2
0.23
0.16
0.24
0.22
0.2
0.19
0.15
0.27
0.25
0.24
0.17
0.17
0.12
0.1
0.11
0.05
0
0
Africa
Asia
Europe
Middle East
Solar PV
North America
Oceania
South America
CSP
Source: IRENA (2016)
Source: IRENA (2016)
3. Perovskite cells include perovskite (crystal) structured compounds that are simple to manufacture
and are expected to be relatively inexpensive to produce. They have experienced a steep rate of efficiency
improvement in laboratories over the past few years.
29
WORLD ENERGY COUNCIL | RESOURCES
9. GEOTHERMAL ENERGY
Geothermal energy contributes a small proportion of the world’s primary energy
consumption. Geothermal energy produces less than 1% of the world’s electricity
generation output. There were 315 MW of new geothermal power capacity installed
in 2015, raising the total capacity to 13.2 GW.
Turkey accounted for half of the new global capacity additions, followed by the
US, Mexico, Kenya, Japan and Germany. In terms of direct use of geothermal
heat, the countries with the largest utilisation, accounting for roughly 70% of direct
geothermal in 2015, are China, Turkey, Iceland, Japan, Hungary, the US and
New Zealand.
The earth estimated stored thermal energy down to 3 km within continental crust,
is roughly 43 x 106 EJ, which is considerably greater than the world’s total primary
energy consumption.
A disproportional percentage of installed generation capacity resides on island
nations or regions (43%), providing not only a valuable source of power generation,
but also both heat and heat storage over a wide spectrum of conditions.
FIGURE
15: CAPACITY
UNDER
DEVELOPMENT
FIGURE
1: CAPACITY
UNDER
DEVELOPMENT
BY COUNTRY (MW)
BY COUNTRY (MW)
4,500
Planned Capacity Additions
4,000
3,500
3,000
2,500
2,000
1,500
1,000
500
d
te
U
ni
In
do
ne
sia
St
at
es
Tu
rk
ey
Ke
ny
a
Et
hi
op
Ph
ia
ili
pp
in
es
Ic
el
an
d
M
e
N
x
ic
ew
o
Ze
al
an
G
d
ua
te
m
Co ala
lo
m
b
Ar ia
m
e
Co nia
st
a
Ri
ca
Ch
ile
In
di
a
G
er
m
an
y
Vi
et
na
m
N
ic
ar
ag
ua
Au
st
ra
lia
Ja
pa
Ar
n
ge
nt
in
a
D
jib
ou
ti
0
Source: GEA (2016)
Source: GEA (2016)
30
WORLD ENERGY COUNCIL | RESOURCES
KEY FINDINGS
1. In 2015, total power output totalled 75 TWh, the same number being also valid
for total heat output from geothermal energy (excluding ground heat pumps).
World geothermal heat use (direct & storage) reached 563 PJs in 2014.
2. Global investment in 2015 was US$2 billion, a 23% setback from 2014. During
the period 2010 – 2014, around US$20 billion were invested in geothermal
energy by 49 countries for both direct use and electric power.
3. Geothermal energy currently finds itself burdened by higher installation
costs and longer development periods, relative to solar and wind. As a result,
in many countries, geothermal energy projects have been and are reliant on
government incentives in order to compete against both natural gas and other
renewable generation.
4. The pace of geothermal development has been conditioned by legal
frameworks and particularly by conservation legislation. However, the pace
of development might accelerate due to climate change concerns and the
increasing need to decarbonise the energy sector.
AVERAGE LEVELISED COST OF ELECTRICITY FOR GEOTHERMAL
FIGURE
16: AVERAGE LEVELISED COST OF ELECTRICITY
IN 2014,
BY REGION
FOR GEOTHERMAL IN 2014, BY REGION
0.14
0.12
0.12
2014 USD / kWh
0.1
0.08
00.8
0.07
0.07
Asia
Eurasia
0.08
0.08
0.08
North America
Oceania
South America
0.06
0.04
0.02
0
Africa
Europe
Source: IRENA (2016)
Source: IRENA (2016)
31
WORLD ENERGY COUNCIL | RESOURCES
10. WIND ENERGY
World wind power generation capacity has reached 435 GW at the end of 2015,
around 7% of total global power generation capacity. A record of 64 GW was added
in 2015. The global growth rate of 17.2% was higher than in 2014 (16.4%).
Global wind power generation amounted to 950 TWh in 2015, nearly 4% of total
global power generation. Some countries have reached much higher percentages.
Denmark produced 42% of its electricity from wind turbines in 2015, the highest
figure yet recorded worldwide. In Germany wind power contributed a new record
of 13% of the country’s power consumption in 2015.
Global installed capacity of offshore wind capacity reached around 12 107 MW
end-2015, with 2 739 turbines across 73 offshore wind farms in 15 countries.
Currently, more than 92% (10 936 MW) of all offshore wind installations are in
European waters. Floating foundations technologies are in development and several
full-scale prototype floating wind turbines have been deployed.
FIGURE 17: SHARE OF THE GLOBAL TURBINE
GLOBAL
TOTAL INSTALLED
HYDROPOWER
CAPACITY
(GW)
MANUFACTURER
MARKET,
WITH RESPECTIVE
CAPACITY
BY COUNTRY
AT THE
END OF 2015, INCLUDING PUMPED STORAGE
ADDITIONS,
IN 2014
Others 6.9GW
Vestas (DK) 6.3GW
Siemens (DE) 5.1GW
CSIC Haizhuang (CN)
GE Wind (US) 4.7GW
Dongfang (CN)
Nordex (DE)
Europe
SEWind (CN)
Asia
America
Dk – Denmark
DE– Germany
US – United States
CN – China
IN – India
XEMC (CN
ES – Spain
Envision (CN)
Ming Yang (CN)
Goldwind (CN) 4.6GW
Gamesa (ES)
Enercon (DE) 4.0GW
Guodian United Power (CN)
Suzlon(IN) 3.0GW
Source: BTM Navigant (2015)
Source: BTM Navigant (2015)
32
WORLD ENERGY COUNCIL | RESOURCES
KEY FINDINGS
1. With current policy plans, global wind capacity could grow from 435 GW in
2015 to 977 GW in 2030 (905 GW onshore and 72 GW offshore wind). The
global leaders in wind power as at end-2015 are China, the US, Germany, India
and Spain. The total investments in the global wind sector reached a record
level of US$109.6 billion over the course of 2015.
2. For onshore wind, China has the lowest weighted average LCOE with
a range between US$50/MW – US$72/MW, while the highest weighted
average LCOE are found in Africa, Oceania and Middle East with US$95/MW,
US$97/MW and US$99/MW.
3. Wind deployment continues to be dominated by onshore wind, supported by
continual cost reductions, innovations are also reducing costs for offshore
wind. Floating foundations could be game changers in opening up significant
new markets with deeper waters.
4. Trends within the supplier industry in recent years show strong consolidation
of the major companies and the shift in the global wind market eastwards to
China and India.
ANNUAL NET GLOBAL WIND CAPACITY ADDITIONS, 2001–2015
FIGURE 18: ANNUAL NET GLOBAL WIND CAPACITY
ADDITIONS,
2001 – 2015
70
60
Capacity added (GW)
50
40
30
20
10
Onshore wind
Offshore wind
Source: IRENA, GWEC
Source: IRENA, GWEC
33
15
20
14
20
20
13
20
12
11
20
10
20
09
20
08
20
07
20
06
20
05
20
04
20
20
03
20
02
20
01
0
WORLD ENERGY COUNCIL | RESOURCES
11. MARINE ENERGY
To date only a handful of commercial ocean energy projects have been delivered,
reflecting the current immaturity and high costs of these technologies. 0.5 GW of
commercial ocean energy generation capacity is in operation and another 1.7 GW
under construction, with 99% of this accounted for by tidal range. Whilst relatively
few commercial scale wave, tidal stream or OTEC projects are operational, three
tidal stream commercial projects accounting for 17 MW of capacity are to be
commissioned shortly, (two in Scotland and one in France) and a 1 MW commercial
wave energy array in Sweden.
Sweden has begun construction of the world’s largest commercial wave energy array
at Sotenas. It will incorporate 42 devices and deliver 1.05 MW of capacity. They have
also recently installed a second project in Ghana consisting of 6 devices, together
providing 400 kW of capacity.
TABLE 9: REGIONAL THEORETICAL POTENTIAL OF
WAVE ENERGY
REGION
Wave Energy TWh/yr
Western and Northern Europe
2 800
Mediterranean Sea and Atlantic Archipelagos
(Azores, Cape Verde, Canaries)
1 300
North America and Greenland
4 000
Central America
1 500
South America
4 600
Africa
3 500
Asia
6 200
Australia, New Zealand and Pacific Islands
5 600
TOTAL
29 500
Source: (Mørk et al. 2010)
Note: The total resource potential is less than 32,000 TWh/yr quoted previously as the table accounts for only
theoretical wave power P≥ 5 kW/m and latitude ≤66.5º
34
WORLD ENERGY COUNCIL | RESOURCES
KEY FINDINGS
1. 2015 estimates the LCOE of wave energy at approximately US$500/
MWh whilst tidal sits at approximately US$440/MWh. The LCOE for smallscale OTEC plants (1 – 10 MW) ranges somewhere between US$190/MWh’
and US$940/MWh, however if the facility were to be scale up to between
50 – 400 MW the cost would fall dramatically and likely range between
US$70/MWh and US$300/MWh.
2. The high costs illustrate the immaturity of these technologies and the
relatively short gestation period that ocean energy technologies, with the
exception of tidal range, have undergone. Despite positive developments,
a large number of projects have been suspended as public and private
funds have been withdrawn, but many of the cost issues could be addressed
through ongoing RD&D efforts.
3. There is 15 GW of ocean energy projects at various stages of the development
pipeline with, the majority of these are tidal range (11.5 GW) followed by tidal
stream (2.6 GW), wave (0.8 GW) and OTEC (0.04 GW).
FIGURE
2: WAVE
ENERGY
INSTALLED
CAPACITY
IN OPERATION
FIGURE
19: WAVE
ENERGY
INSTALLED
CAPACITY
OR UNDER
CONSTRUCTION
IN OPERATION
OR UNDER CONSTRUCTION
1.2
Installed capacity (MW)
1.0
0.8
0.6
0.4
0.2
0
Sweden
Ghana
Portugal
Under construction
Source:
(OES 2016a)
Source: (OES
2016a)
35
Fully operational
Spain
China
WORLD ENERGY COUNCIL | RESOURCES
12. CARBON CAPTURE AND STORAGE (CCS)
The world’s first large-scale application of CO2 capture technology in the power
sector commenced operation in October 2014 at the Boundary Dam power station,
Canada. In the US, two additional demonstrations of large-scale CO2 capture in the
power sector, at the Kemper County Energy Facility in Mississippi and the Petra Nova
Carbon Capture Project in Texas are planned to come into operation in 2016 – 2017.
CCS is currently the only available technology that can significantly reduce GHG
emissions from certain industrial processes and it is a key technology option to
decarbonise the power sector.
In terms of the scale of CCS deployment, there are 22 large-scale CCS projects
currently in operation or under construction around the world, with the capacity
to capture up to 40 million tonnes of CO2 per year (Mtpa). These projects
cover a range of industries, including gas processing, power, fertiliser, steel-making,
hydrogen-production (refining applications) and chemicals. They are located
predominantly in North America, where the majority of CO2 capture capacity
is intended for use in EOR.4 5 6 7 8
TABLE 10: SELECTED KEY ESTIMATES OF EFFECTIVE
STORAGE RESOURCES
Nation
Estimated storage resource (Gigatonnes)
Deep saline formations
EOR/depleted fields
2,379 to 21,633
186 to 232
96
20
China7
3,000*
2.2
Australia8
33 to 230
17
USA5
Europe
6
Note: the example resource estimates above have been calculated based on geological characteristics and do
not account for economic or regulatory factors.
*Resources only calculated at theoretical level
4. Projects data is sourced from the Global CCS Institute. www.globalccsinstitute.com
5. US DOE/NETL (2015) Data refers to the USA plus parts of Canada.
6. Vangklide-Pedersen (2009)
7. Dahowski et al. (2009)
8. Carbon Storage Taskforce (2009)
36
WORLD ENERGY COUNCIL | RESOURCES
KEY FINDINGS
1. Even though the cost of CO2 transportation is relatively low compared
to the cost associated with capturing and storing the CO2, the scale
of investment in CO2 transportation infrastructure required to support
large-scale deployment of CCS will be considerable.
2. Total global CO2 capture capacity of projects in operation or under
construction is around 40 Mtpa. The large-scale projects in operation around
the world demonstrate the viability of CCS technology.
3. The Japanese Government is collaborating with technology providers in
industry to examine suitable storage sites and the economic feasibility of CCS
deployment. The South Korean Government CCS Master Plan includes a largescale CCS demonstration project operating within certain cost parameters by
2020, and commercial CCS deployment thereafter.
4. In Australia, considerable project activity continues. The Gorgon Carbon
Dioxide Injection Project is expected to be operational in 2017. It will be
Australia’s first large-scale CO2 injection project and the largest in the world
injecting CO2 into a deep saline formation. The Middle East has two large-scale
CCS projects. Main project efforts are centred in Saudi Arabia and Abu Dhabi,
although Qatar is also examining CCS opportunities.
FIGURE 10: STATUS OF NATIONAL ASSESSMENTS OF REGIONAL
STORAGE RESOURCES
FIGURE 20: STATUS OF NATIONAL ASSESSMENTS
OF REGIONAL STORAGE RESOURCES
Full
Moderate
Limited
Not
Source: Global CCS Institute, 2015: The Global Status of CCS 2015, Summary Report, Melbourne
Source: Global CCS Institute, 2015: The Global Status of CCS 2015
37
WORLD ENERGY COUNCIL | RESOURCES
13. E-STORAGE
The concept of energy storage is not new, though development has been mainly
restricted to one technology until recently. Pumped hydro storage accounts for well
over 95% of global installed energy storage capacity. Compressed air energy storage
currently has only two commercial plants (in Germany and the US), in total 400 MW,
with a third under development in the UK.
Battery storage capacity is increasing: for example, there are around
25 000 domestic installations in Germany alone in conjunction with solar PV
installations, with total capacity of 160 MWh. The total battery capacity in electric
vehicles is also growing rapidly. Millions of water heaters have been operated in
France for decades; they provide a massive benefit in reducing peak demand, by
shifting 5% i.e. 20 TWh from peak periods to low-demand periods. These small-scale
energy storage installations are not necessarily well represented in global statistics.
Large batteries are also being developed with installed capacity amounting to almost
750 MW worldwide. Sodium-sulphur became the dominant technology in the 2000s,
accounting for nearly 60% of stationary battery projects (441 MW). In recent years,
lithium-ion technology has become more popular. Flow batteries, if developed
further, could be a game changer in the medium term.
FIGURE
21: MAPPING
STORAGE
TECHNOLOGIES
FIGURE
21: MAPPING
STORAGE
TECHNOLOGIES
ACCORDING
ACCORDING TOCHARACTERISTICS
PERFORMANCE CHARACTERISTICS
TO PERFORMANCE
Discharge time at rated power
1 year
1 month
1 day
1 hour
1 min
1 sec
1 kWh
10 kWh
100 kWh
1 Mwh
10 Mwh
100 Mwh
1 Gwh
10 Gwh
100 Gwh
1 Twh
10 Twh
100 Twh
Energy capacity
Supercapacitors
Flywheels
Batteries
Thermal Energy Storage
Source: PwC (2015) following Sterner et al. (2014)
CAES: Compressed Air, LAES: Liquid Air, PtG: Power to Gas.
LAES
CAES
Pumped Hydro
Source: PwC (2015) following Sterner et al. (2014) CAES: Compressed Air, LAES: Liquid Air, PtG: Power to Gas.
38
PtG – H2
PtG – SNG
WORLD ENERGY COUNCIL | RESOURCES
KEY FINDINGS
1. The main areas of growth in the next five years are likely to be:
• Small-scale battery storage in conjunction with solar PV. There are already
around 25 000 residential-scale units in Germany alone, and this could
grow to 150 000 by 2020.
• Utility-scale electricity storage, for multiple purposes, especially
frequency response.
• Electric vehicles.
• Commercial, communications and software capabilities to allow multiple
small distributed storage, demand response and distributed generation
sources to be aggregated, in a ‘virtual powerplant’ or ‘swarm’.
• Pumped storage hydro, especially in south-east Asia, Africa and
Latin America.
• Isolated electricity systems such as islands, to aid integration of renewables in order to save fuel costs.
2. Most commercial interest is in battery storage and the costs of several storage
technologies will fall as production volumes increase.
3. The future outlook for energy storage markets is good due to an increasing
need, but the regulatory and legal frameworks are failing to keep pace.
FIGURE
22: LEVELISED
COST
OF STORAGE
2015 PERIOD
STUDY
FIGURE
7: LEVELISED
COST OF
STORAGE
IN 2015IN
STUDY
PERIOD
AND
2030
(€
2014)
AND 2030 (€ 2014)
800
700
600
EUE / MWh
500
400
300
200
100
0
PSP
CAES
Li
NaS
Lead
Redox
LCOS2015
Source:
Source: PwC,
2015 PwC, 2015
39
Thermo
Chem
Super
cap
LCOS 2030
FES
Thermo
Sens
Thermo
Lat
P2G
H2
P2G
SNG
WORLD ENERGY COUNCIL | RESOURCES
LIST OF TABLES AND FIGURES
FIGURES
• Figure 1: Comparative primary energy consumption over the past 15 years
• Figure 2: Share of renewable energy (including hydro) in electricity
production, by region in 2005, 2010 and 2015
• Figure 3: Trends in global renewable energy levelised cost of electricity (lcoe)
in the time period from 2010 until 2015
• Figure 4: 2014 Country ranking: coal-fired power generation (TWh)
• Figure 5: Product-market consumption trends
• Figure 6: New supply landscape (technically recoverable reserves)
• Figure 7: World nuclear electricity production, TWh
• Figure 8: The contribution of hydropower to a low carbon future
• Figure 9: Primary energy supply of biomass resources globally in 2013
• Figure 10: Waste generation per capita (kg/day) to gross national income (gni)
ratio in 2014 in selected countries
• Figure 11: Amount of waste disposed in 2012, by technique
• Figure 12: Growth of all wte technologies globally with a conservative forecast
up to 2025
• Figure 13: Solar pv capacity in 2014 and additions in 2015, top
10 countries, (gw)
• Figure 14: Average levelised cost of electricity for solar PV and CSP in 2014,
by region
• Figure 15: Capacity under development by country (MW)
• Figure 16: Average levelised cost of electricity for geothermal in 2014,
by region
• Figure 17: Annual net global wind capacity additions, 2001 – 2015
• Figure 18: Share of the global turbine manufacturer market, with respective
capacity additions, in 2014
• Figure 19: Wave energy installed capacity in operation or under construction
• Figure 20: Status of national assessments of regional storage resources
• Figure 21: Mapping storage technologies according to performance
characteristics
• Figure 23: Levelised cost of storage in 2015 study period and 2030 (€ 2014)
40
WORLD ENERGY COUNCIL | RESOURCES
TABLES
•
•
•
•
•
•
•
•
•
•
Table 1: Top coal producing countries in 2014 and 2015
Table 2: Top coal producing regions in 2014 and 2015
Table 3: Global oil demand, by region from 2014 – 2020
Table 4: Regional natural gas data sorted by region
Table 5: Uranium production and resources
Table 6: TOp hydropower capacity as of 2015, by country
Table 7: Share of biofuels production by region
Table 8: Constraints and risks to materials consumed by solar PV
Table 9: Regional theoretical potential of wave energy
Table 10: Selected key estimates of effective storage resources
41
WORLD ENERGY COUNCIL | RESOURCES
ACKNOWLEDGEMENTS
The project team would like to thank the many individuals who informed the project’s approach,
supplied information, provided ideas, and reviewed drafts. Their support and insights have made a
major contribution to the development of the report. A detailed breakdown of the Resources Study
Group members is available at the end of each chapter in the full report.
WORLD ENERGY COUNCIL:
Hans-Wilhelm Schiffer (Executive Chair); Zulandi Van der Westhuizen (Director Scenarios
& Resources); Corina Radu; Nnamdi Ibeanu; David Kenny Onyekpe; Elisa Notarianni;
Christoph Menzel
LEAD AUTHORS, PROJECT PARTNER,
PROJECT SUPPORTER
Coal Chapter
World Coal Association
Oil Chapter
Kenyan Oil Company, Enerstrat Consulting
Natural gas Chapter
Accenture Strategy, Project Partner
Uranium and nuclear Chapter
World Nuclear Association
Hydropower Chapter
International Hydro Association
Bioenergy Chapter
World Bioenergy Association
Waste-to-energy Chapter
BNEL
Solar energy Chapter
PwC India
Geothermal energy Chapter
Contact Energy
Wind energy Chapter
IRENA
Marine energy Chapter
Imperial College
Carbon capture and storage Chapter
Global CCS Institute
E-storage Chapter DNV-GL, Project Supporter
DataBGR
Urban impact
Arup, Project Supporter
43
WORLD ENERGY COUNCIL | RESOURCES
OFFICERS OF THE WORLD ENERGY COUNCIL
MARIE-JOSÉ NADEAU
JOSÉ DA COSTA CARVALHO NETO
Chair
Chair – Programme Committee
MARIE-JOSÉ NADEAU
JEAN-MARIE DAUGER
Chair
Chair – Communications & Strategy Committee
YOUNGHOON DAVID KIM
HASAN MURAT MERCAN
Co-chair
Vice Chair – 2016 Congress, Istanbul
MATAR AL NEYADI
BONANG MOHALE
Vice Chair – Special Responsibility
Gulf States/Middle East
Vice Chair – Africa
NUER BAIKELI
Vice Chair – Asia Pacific/South Asia
SHIGERU MURAKI
Vice Chair – Asia
O.H. (DEAN) OSKVIG
Vice Chair – North America
KLAUS-DIETER BARBKNECHT
Vice Chair – Finance
BRIAN A. STATHAM
Chair – Studies Committee
LEONHARD BIRNBAUM
Vice Chair – Europe
JOSÉ ANTONIO VARGAS LLERAS
Vice Chair – Latin America/Caribbean
OLEG BUDARGIN
Vice Chair – responsibility for
Regional Development
CHRISTOPH FREI
Secretary General
PATRONS OF THE WORLD ENERGY COUNCIL
Accenture Strategy
Marsh & McLennan Companies
Bloomberg New Energy Finance
Masdar
Electricité de France
Oliver Wyman
Emirates Nuclear Energy Corporation
PricewaterhouseCoopers
ENGIE
Siemens AG
GE Power
Swiss Re Corporate Solutions
Hydro-Québec
Tokyo Electric Power Co.
Korea Electric Power Corp.
VNG – Verbundnetz Gas AG
44
WORLD ENERGY COUNCIL
Algeria
India
Portugal
Argentina
Iran (Islamic Rep.)
Qatar
Armenia
Iraq
Romania
Austria
Ireland
Russian Federation
Bahrain
Israel
Saudi Arabia
Belgium
Italy
Senegal
Bolivia
Japan
Serbia
Botswana
Jordan
Singapore
Brazil
Kazakhstan
Slovakia
Bulgaria
Kenya
Slovenia
Cameroon
Korea (Rep.)
South Africa
Canada
Kuwait
Spain
Chad
Latvia
Sri Lanka
Chile
Lebanon
Swaziland
China
Libya
Sweden
Colombia
Lithuania
Switzerland
Congo (Dem. Rep.)
Luxembourg
Syria (Arab Rep.)
Côte d’Ivoire
Malaysia
Tanzania
Croatia
Mexico
Thailand
Cyprus
Monaco
Trinidad & Tobago
Czech Republic
Mongolia
Tunisia
Denmark
Morocco
Turkey
Ecuador
Namibia
Ukraine
Egypt (Arab Rep.)
Nepal
United Arab Emirates
Estonia
Netherlands
United Kingdom
Ethiopia
New Zealand
United States
Finland
Niger
Uruguay
France
Nigeria
Zimbabwe
Germany
Pakistan
United Kingdom
Ghana
Paraguay
United States
Greece
Peru
Uruguay
Hong Kong, China
Philippines
Zimbabwe
Iceland
Poland
62–64 Cornhill
London EC3V 3NH
United Kingdom
T +44 (0) 20 7734 5996
F +44 (0) 20 7734 5926
E [email protected]
www.worldenergy.org | @WECouncil

© Copyright 2026