
Trips and average duration by destination
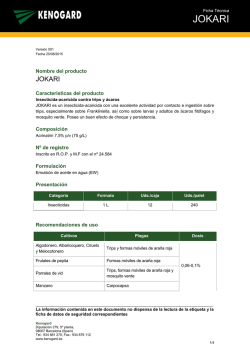
 28 September 2016
Encuesta de Turismo de Residentes (ETR/FAMILITUR)
Segundo trimestre de 2016
El número de viajes de los residentes en España baja un 8,5% en el
segundo trimestre y se sitúa en 42,8 millones
El gasto total disminuye un 5,3%, hasta los 8.508 millones de euros
Andalucía, Cataluña y Castilla y León son los principales destinos
Los residentes en España realizan 42,8 millones de viajes en el segundo trimestre de 2016,
un 8,5% menos que en el mismo periodo de 2015.
El 92,1% de los viajes tienen como destino principal el territorio nacional, con un descenso del
8,5% respecto al segundo trimestre del año pasado. Por su parte, los viajes al extranjero, que
representan el 7,9% del total, disminuyen un 8,9%.
Trips and average duration by destination
Trips
Total
TOTAL
Spain
Abroad
42,776,473
39,403,464
3,373,010
Average duration
%
100.0
92.1
7.9
Annual
variation
-8.5
-8.5
-8.9
Overnights
Annual
variation
3.0
2.7
6.4
-7.3
-5.9
-13.2
Debe tenerse en cuenta que en 2016 la Semana Santa se celebró en marzo, mientras que en
2015 tuvo lugar entre marzo y abril. Por ello, es conveniente analizar en su conjunto los datos
del primer semestre de cada año. Así, en los seis primeros meses de 2016 los viajes
realizados por los residentes se incrementan un 4,6% respecto al mismo periodo del año
anterior. Los viajes con destino principal España crecen un 4,6% y los viajes al extranjero
aumentan un 5,1%.
Si nos atenemos solo a los viajes realizados durante las vacaciones de Semana Santa1, en
2016 se realizaron más de 6,5 millones, un 6,1% más que en 2015.
1
Se tienen en cuenta el calendario escolar y los festivos de cada comunidad autónoma.
ETR/FAMILITUR SECOND QUARTER 2016 (1/10)
Viajes según motivo, alojamiento y transporte principal
En el segundo trimestre de 2016 los viajes de Ocio, recreo y vacaciones, que son el motivo
principal del 46,6% de los viajes, registran un descenso anual del 8,5%. Las Visitas a
familiares o amigos, que representan el 36,7% del total, disminuyen un 3,0%.
Por su parte, los viajes de Negocios y otros motivos profesionales y por Otros motivos2, se
reducen un 11,0% y un 31,0%, respectivamente.
El principal motivo para viajar durante el segundo trimestre del año es el ocio, tanto si el
destino es interno (45,9%) como extranjero (54,6%).
En los seis primeros meses de 2016 aumentan los viajes de ocio (9,7%) y las visitas a
familiares o amigos (10,3%). Por el contrario, los viajes de negocios disminuyen un 12,3% y
los realizados por otros motivos un 23,6%.
Trips by main purpose and destination of the trip
TOTAL
Leisure, recreation and holiday
Visiting relatives and friends
Business and professional
Other reasons
SPAIN
Leisure, recreation and holiday
Visiting relatives and friends
Business and professional
Other reasons
ABROAD
Leisure, recreation and holiday
Visiting relatives and friends
Business and professional
Other reasons
Trips
Total
%
42,776,473
19,932,250
15,694,839
4,803,486
2,345,898
39,403,464
18,091,453
14,882,731
4,225,457
2,203,822
3,373,010
1,840,797
812,108
578,029
-
100.0
46.6
36.7
11.2
5.5
100.0
45.9
37.8
10.7
5.6
100.0
54.6
24.1
17.1
-
Annual
variation
-8.5
-8.5
-3.0
-11.0
-31.0
-8.5
-8.5
-3.4
-10.8
-30.1
-8.9
-8.7
4.5
-12.6
-
Average duration
Overnights
Annual
variation
3.0
3.1
2.6
3.5
3.5
2.7
2.8
2.3
3.2
3.2
6.4
5.3
9.5
5.5
-
-7.3
-2.4
-13.0
-0.8
-14.7
-6.0
-2.6
-13.4
6.8
-5.6
-13.1
-1.1
-16.0
-22.9
-
No te: the data marked with "-" do no t have sufficient sampling suppo rt
En el 42,7% de los viajes con destino interno los residentes se alojan en vivienda de familiares
o amigos, lo que supone un descenso anual del 11,4%.
En los viajes al extranjero, el alojamiento hotelero es la opción preferida (54,6% de los viajes).
Este tipo de alojamiento registra una bajada del 9,7% respecto al segundo trimestre del año
pasado.
Durante el primer semestre del año los viajes con destino interno de residentes que se alojan
en vivienda de familiares o amigos aumentan un 3,2%. Por su lado, los viajes al extranjero en
alojamiento hotelero se incrementan un 5,3%.
2 En Otros motivos se incluye el turismo de compras, los desplazamientos al centro de estudios, otros viajes por
motivos de educación y formación, salud, motivos religiosos, los viajes de incentivos de empresa y todos los demás
viajes por motivos personales no incluidos en otra categoría.
ETR/FAMILITUR SECOND QUARTER 2016 (2/10)
Trips by main accomodation an destination of the trip
TOTAL
Rented accommodation
- Hotels or similar accommodation
- Rented dw elling
- Other rented accommodation
Non-rented accommodation
- Ow ned dw elling
- Accommodation by relatives or friends
- Other non-rented accommodation
SPAIN
Rented accommodation
- Hotels or similar accommodation
- Rented dw elling
- Other rented accommodation
Non-rented accommodation
- Ow ned dw elling
- Accommodation by relatives or friends
- Other non-rented accommodation
ABROAD
Rented accommodation
- Hotels or similar accommodation
- Other rented accommodation
Non-rented accommodation
Trips
Total
%
42,776,473
15,915,140
10,647,896
2,232,049
3,035,195
26,861,333
8,761,544
17,625,638
474,152
39,403,464
13,425,104
8,805,919
1,912,736
2,706,450
25,978,360
8,703,308
16,839,641
435,410
3,373,010
2,490,036
1,841,977
648,059
882,974
100.0
37.2
24.9
5.2
7.1
62.8
20.5
41.2
1.1
100.0
34.1
22.3
4.9
6.9
65.9
22.1
42.7
1.1
100.0
73.8
54.6
19.2
26.2
Annual
variation
Average duration
Overnights
Annual
variation
-8.5
-9.9
-7.2
7.3
-26.1
-7.7
3.0
-11.6
-26.4
-8.5
-10.3
-6.6
4.5
-27.1
-7.5
2.9
-11.4
-28.3
-8.9
-7.3
-9.7
0.4
-13.3
3.0
3.6
3.5
4.8
3.3
2.6
2.4
2.7
2.0
2.7
3.3
3.2
4.4
3.0
2.3
2.4
2.3
1.9
6.4
5.2
4.8
6.4
9.7
-7.3
0.8
3.4
-3.7
-7.6
-13.0
-11.3
-12.9
-25.8
-6.0
4.2
5.1
0.8
-0.3
-12.1
-10.9
-12.5
-23.3
-13.1
-10.4
-0.6
-28.7
-14.9
En cuanto al principal tipo de transporte utilizado, el vehículo propio concentra el 81,3% de los
viajes con destino interno, un 10,1% menos que en el mismo trimestre de 2015.
En el 68,8% de los viajes al extranjero se utiliza el transporte aéreo, con una reducción del
2,6%.
En el conjunto del semestre, los viajes internos en vehículo propio aumentan el 5,1% y los
viajes al extranjero en transporte aéreo crecen un 6,5%.
Trips by main means of transport and destination of the tri
TOTAL
Air transport
Private motor vehicle
Bus, coach
Train
Waterw ay
Other type of transport
SPAIN
Air transport
Private motor vehicle
Bus, coach
Train
Waterw ay
Other type of transport
ABROAD
Air transport
Private motor vehicle
Other
Trips
Total
%
42,776,473
4,411,482
32,802,779
2,470,081
2,189,315
438,398
464,419
39,403,464
2,091,564
32,052,218
2,327,606
2,172,611
332,392
427,072
3,373,010
2,319,917
750,561
302,531
100.0
10.3
76.7
5.8
5.1
1.0
1.1
100.0
5.3
81.3
5.9
5.5
0.8
1.1
100.0
68.8
22.3
9.0
Annual
variation
-8.5
3.3
-10.3
6.5
-12.4
-5.2
-27.9
-8.5
10.7
-10.1
7.6
-11.5
5.9
-27.5
-8.9
-2.6
-18.3
-25.0
Average duration
Overnights
Annual
variation
3.0
6.0
2.5
3.7
3.2
5.2
3.9
2.7
4.8
2.4
3.5
3.1
4.4
4.0
6.4
7.1
3.9
7.6
-7.3
-11.7
-8.7
-1.8
-1.6
-27.3
-4.1
-6.0
-5.3
-7.7
-3.7
-3.4
-18.3
3.0
-13.1
-13.2
-25.0
-3.6
ETR/FAMILITUR SECOND QUARTER 2016 (3/10)
Principales destinos
Las principales comunidades autónomas de destino de los viajes de los residentes en España
en el segundo trimestre son Andalucía (con el 17,8% del total de viajes), Cataluña (13,4%) y
Castilla y León (9,0%).
Si se relacionan los viajes internos de los residentes con la población de destino, el fenómeno
viajero tiene más intensidad en Cantabria (con 1.649 viajes por cada 1.000 habitantes3), en
Castilla - La Mancha (1.549 viajes por 1.000 habitantes) y en Castilla y León (1.534 viajes por
1.000 habitantes).
Trips by destination (abroad and autonomous regions)
Trips
Total
TOTAL
Abroad
Andalucía
Aragón
Asturias, Principado de
Balears, Illes
Canarias
Cantabria
Castilla y León
Castilla - La Mancha
Cataluña
Comunitat Valenciana
Extremadura
Galicia
Madrid, Comunidad de
Murcia, Región de
Navarra, Comunidad Foral de
País Vasco
Rioja, La
Ceuta
Melilla
Trips per 1,000 inhabitants* Average duration
Total
Index on
Overnights
average
%
42,776,473
3,373,010
7,601,626
1,701,103
890,404
829,048
1,492,165
1,031,675
3,832,207
3,232,282
5,713,541
3,681,096
1,001,783
2,057,845
3,419,905
873,858
546,746
1,132,076
341,116
-
100.0
7.9
17.8
4.0
2.1
1.9
3.5
2.4
9.0
7.6
13.4
8.6
2.3
4.8
8.0
2.0
1.3
2.6
0.8
-
848
..
900
1,282
851
748
747
1,649
1,534
1,549
760
724
928
737
546
632
885
568
1,181
-
100.0
..
106.1
151.3
100.3
88.2
88.1
194.6
181.0
182.7
89.7
85.4
109.4
86.9
64.4
74.6
104.4
67.0
139.3
-
3.0
6.4
2.8
2.4
2.5
4.4
3.1
2.6
2.3
2.1
2.5
3.3
3.0
2.8
2.7
2.4
2.4
2.5
2.4
-
No te: the data marked with "-" do no t have sufficient sampling suppo rt. ".." indicates that data do no t exist.
* This indicato r co nsiders bo th the trips o f the po pulatio n o f 15 years and o ver and the po pulatio n aged 15 and o ver resident in destinatio n.
3
This indicator considers both the trips of the population of 15 years and over and the population aged 15 and over
resident in origin.
ETR/FAMILITUR SECOND QUARTER 2016 (4/10)
Comunidades autónomas de origen
Los viajes realizados por los residentes en Comunidad de Madrid suponen el 17,9% de los viajes
del segundo trimestre. Por detrás se sitúan Andalucía y Cataluña, con el 16,7% y el 16,1%,
respectivamente.
Trips by autonomous region of residence of travelers
Trips
Total
TOTAL
Andalucía
Aragón
Asturias, Principado de
Balears, Illes
Canarias
Cantabria
Castilla y León
Castilla - La Mancha
Cataluña
Comunitat Valenciana
Extremadura
Galicia
Madrid, Comunidad de
Murcia, Región de
Navarra, Comunidad Foral d
País Vasco
Rioja, La
Ceuta
Melilla
Trips per 1,000 inhabitants* Average duration
Total
Index on
Overnights
average
%
42,776,473
7,162,878
1,573,162
1,173,760
668,089
1,466,178
639,926
2,651,799
2,096,728
6,866,260
3,231,078
849,813
1,975,015
7,664,963
985,411
670,213
2,648,707
321,183
82,221
49,088
100.0
16.7
3.7
2.7
1.6
3.4
1.5
6.2
4.9
16.1
7.6
2.0
4.6
17.9
2.3
1.6
6.2
0.8
0.2
0.1
924
848
1,222
1,120
640
732
1,137
1,110
1,056
910
665
793
696
1,199
721
1049
1,172
1,016
1,053
584
100.0
91.7
132.2
121.2
69.2
79.2
123.0
120.1
114.2
98.4
72.0
85.8
75.3
129.7
78.0
113.5
126.8
109.9
114.0
63.2
3.0
2.8
2.9
3.2
3.9
3.5
2.7
2.9
3.0
3.0
2.9
2.8
2.9
2.7
3.0
3.1
3.4
3.4
3.1
4.7
* This indicato r co nsiders bo th the trips o f the po pulatio n o f 15 years and o ver and the po pulatio n aged 15 and o ver resident in o rigin
ETR/FAMILITUR SECOND QUARTER 2016 (5/10)
Eliminando el efecto del tamaño de cada comunidad, los más viajeros son los residentes en
Aragón (1.222 viajes por cada 1.000 habitantes4), Comunidad de Madrid (1.199) y País Vasco
(1.172). Por el contrario, los menos viajeros son los residentes en Illes Balears (640 viajes por
cada 1.000 habitantes), Comunitat Valenciana (665) y Galicia (696).
Trips per 1,000 inhabitants by autonomous region of residence of travelers
1,400
1,222
1,199
1,200
1,172
1,137
1,120
1,110
1,056
1,053
1,049
1,016
1,000
924
910
848
793
800
732
721
696
665
640
584
600
400
200
Melilla
Balears, Illes
Comunitat Valenciana
Galicia
Murcia, Región de
Canarias
Extremadura
Andalucía
Cataluña
TOTAL
Rioja, La
Navarra, Comunidad Foral de
Ceuta
Castilla - La Mancha
Castilla y León
Asturias, Principado de
Cantabria
País Vasco
Madrid, Comunidad de
Aragón
0
Gasto de los viajes
El gasto total de los viajes del segundo trimestre supera los 8.500 millones de euros, un 5,3%
menos que en el mismo periodo de 2015.
En los viajes con destino nacional el gasto total se reduce un 5,2%, mientras que en los
realizados al extranjero la bajada es del 5,6%.
El gasto medio diario se sitúa en 55 euros en los viajes con destino interno y en 126 euros en
los viajes al extranjero.
Durante el primer semestre de 2016 el gasto total de los viajes de los residentes se incrementa
un 12,2%. El crecimiento es de un 11,9% en los viajes internos y del 13,0% en los viajes al
extranjero.
Expenditure by destination
Total expenditure
Total
(millions
TOTAL
Spain
Abroad
4
8,508.3
5,791.1
2,717.2
%
Annual
variation
100.0
68.1
31.9
-5.3
-5.2
-5.6
Average expenditure
by tourist
Daily average
Total
(euros)
Total
(euros)
199
147
806
Annual
variation
3.5
3.6
3.7
expenditure
67
55
126
Annual
variation
11.7
10.2
19.3
Se considera la población residente de 15 o más años.
ETR/FAMILITUR SECOND QUARTER 2016 (6/10)
En los viajes internos, el gasto en bares y restaurantes representa el mayor porcentaje del
gasto total (24,6%) seguido del gasto en alojamiento (23,1%). El primero baja un 20,6%
respecto al segundo trimestre de 2015, mientras que el segundo aumenta un 1,3%.
En los viajes al extranjero, el gasto en transporte supone el 32,2% del total, con un incremento
anual del 5,6%.
En los seis primeros meses del año el gasto en bares y restaurantes en los viajes internos
disminuye un 3,1% respecto al mismo periodo de 2015. Por su parte, el gasto en transporte
en los viajes al extranjero aumenta un 25,8%.
Expenditure according items by destination
Total
Spain
Abroad
(millions
%
Annual
(millions
%
Annual
(millions
%
Annual
of
variation of
variation of
variation
)
)
)
8,508.3
100.0
-5.3
5,791.1
100.0
-5.2
2,717.2
100.0
-5.6
TOTAL EXPENDITURE
Expenditure on tourist package
829.0
9.7
-6.7
389.2
6.7
4.9
439.8
16.2
-15.0
90.3
-5.2
5,401.9
93.3
-5.8
2,277.4
83.8
-3.5
Expenditure excluded of tourist package 7,679.3
- Expenditure on accommodation
1,895.6
22.3
4.6
1,340.4
23.1
1.3
555.2
20.4
13.4
- Expenditure on transport
2,190.3
25.7
-9.0
1,315.7
22.7
-16.6
874.6
32.2
5.6
- Expenditure on food and drinks
1,896.6
22.3
-20.2
1,427.4
24.6
-20.6
469.2
17.3
-18.7
- Other expenditure
1,696.8
19.9
12.9
1,318.4
22.8
27.1
378.4
13.9
-18.7
Atendiendo a la comunidad autónoma de destino principal, los gastos medios diarios más
altos se registran en los viajes a Canarias (79 euros), Illes Balears (77) y Comunidad de Madrid
(73). Los más bajos se dan en Castilla-La Mancha (39 euros), Extremadura (43) y Castilla y
León (45).
Por origen, el gasto medio diario más alto lo realizan los residentes en Illes Balears (78 euros),
Cataluña (75) y Canarias (74).
Por el contrario, los más bajos se dan en Andalucía (58 euros) y Castilla y León (61).
ETR/FAMILITUR SECOND QUARTER 2016 (7/10)
Datos mensuales
En el mes de abril se realizan 12,3 millones de viajes, en mayo 15,4 millones y en junio 15,1
millones. Los viajes realizados en junio tienen una duración media de 3,1 pernoctaciones, los de
abril 3,0 y los de mayo 2,8.
Mayo es el mes con menor porcentaje de viajes dentro de la comunidad autónoma de residencia
(48,2%, frente al 52,6% de abril). Esto se debe al mayor porcentaje de viajes a otra comunidad
autónoma, que representan en mayo el 44,5% de los viajes del mes.
El ocio es el principal motivo para viajar los tres meses del trimestre, acumulando en junio más de
la mitad de los viajes (51,0%).
El tipo de alojamiento elegido presenta mucha estabilidad en el trimestre, con un peso del
alojamiento hotelero alrededor del 25% en todos los meses. Los viajes a alojamientos no de
mercado superan el 63% de los viajes de abril y de mayo. En junio, este porcentaje se queda en
el 61,6%, en favor del resto de alojamientos de mercado, que acumulan el 13,5% de los viajes.
Trips by month and main characteristics
April
May
Trips
Total
TOTAL
TYPE OF DESTINATION
Spain
Within the autonomous region
To other autonomous region
Abroad
PURPOSE
Leisure, recreation and holidays
Visiting relatives or friends
Business and professional
Other reasons
ACCOMMODATION
Hotels and similar accommodation
Other rented accommodation
Non-rented accommodation
June
Trips
Total
%
Trips
Total
%
%
12,273,482
100.0
15,419,595
100.0
15,083,396
100.0
11,270,617
6,455,665
4,814,952
1,002,865
91.8
52.6
39.2
8.2
14,299,494
7,437,000
6,862,494
1,120,101
92.7
48.2
44.5
7.3
13,833,353
7,575,152
6,258,201
1,250,044
91.7
50.2
41.5
8.3
5,064,046
4,875,376
1,575,087
758,972
41.3
39.7
12.8
6.2
7,176,505
5,931,090
1,562,232
749,768
46.5
38.5
10.1
4.9
7,691,699
4,888,373
1,666,167
837,158
51.0
32.4
11.0
5.6
3,074,353
1,370,613
7,828,516
25.0
11.2
63.8
3,820,657
1,860,511
9,738,427
24.8
12.1
63.2
3,752,886
2,036,120
9,294,391
24.9
13.5
61.6
ETR/FAMILITUR SECOND QUARTER 2016 (8/10)
Excursiones
La población residente de 15 o más años realiza 59,4 millones de excursiones5 en el segundo
trimestre de 2016, con un incremento anual del 11,6%. El 93,7% de las excursiones son por
motivos personales y el 6,3% por motivos profesionales.
El 85,8% de las excursiones se hacen dentro de la comunidad autónoma de residencia, con un
incremento anual del 13,9%.
El 13,1% de las excursiones tienen como destino otra comunidad y el 1,1% el extranjero. El
número de excursiones sube un 1,2% en las primeras y baja un 18,9% en las que tienen como
destino el extranjero.
Durante el primer semestre del 2016, las excursiones realizadas por la población residente se
incrementan un 7,1%.
Same-day visits by destination
Same-day visits
Total
TOTAL
SPAIN
Within the autonomous region
To other autonomous region
ABROAD
Annual
variation
%
59,381,419
58,743,896
50,949,295
7,794,601
637,523
100.0
98.9
85.8
13.1
1.1
11.6
12.0
13.9
1.2
-18.9
5 A same-day visit is considered to be any visit without overnight stay made out of the usual environment of the
individual. These exclude those which are part of the routine of the individual, as well as those made from second
homes, from a cruise or any accommodation other than the usual.
ETR/FAMILITUR SECOND QUARTER 2016 (9/10)
Methodological note
The Tourism survey for Spanish residents is a continuous survey with the main objective is to
provide monthly, quarterly and annual estimations of the trips made by the resident population
in Spain and the main characteristics such as destination, duration, purpose, accommodation,
transport means, costs and sociodemographic characteristics of the travellers, amongst
others. The diffusion of results and their disaggregation degree, depending on the study
variable group, will be made with monthly, quarterly or annual reference.
The information is obtained by personal interviews to persons aged 15 or older, selected at
random in a sample of resident houses, that collaborate three times in alternative months along
six months, leave the sample for six months, and are interviewed three other times during the
next semester. People selected provide information on the trips made in the two months prior
to that of the interview. With an expected effective monthly sample of about 8,200 people, the
information of a reference month is provided by about 16,400 people. Furthermore, the rotating
panel scheme provides the efficient estimation of the annual change.
The complete methodology of the survey is available for consultation in the web site of the INE 6.
For further information see INEbase – www.ine.es/en/
All press releases at: www.ine.es/prensa/prensa_en.htm
Press office: Telephone numbers: 91 583 93 63 / 94 08 – Fax: 91 583 90 87 - [email protected]
Information Area: Telephone number: 91 583 91 00 – Fax: 91 583 91 58 – www.ine.es/infoine
6
http://www.ine.es/en/daco/daco42/etr/etr_metodologia_en.pdf
ETR/FAMILITUR SECOND QUARTER 2016 (10/10)
Tourism Survey of Residents (ETR/FAMILITUR)
Second Quarter 2016
1. Trips by destination
Quarterly data
Trips
TOTAL
Spain
Abroad
%
42,776,473
39,403,464
3,373,010
Annual
variation
100.0
92.1
7.9
Accumulated data
Trips
%
-8.5
-8.5
-8.9
83,081,938
76,292,816
6,789,122
Annual
variation
100.0
91.8
8.2
4.6
4.6
5.1
2. Trips by purpose of the trip and main destination
Quarterly data
Trips
TOTAL
Leisure, recreation and holidays
Visiting relatives and friends
Business and professional
Other reasons
SPAIN
Leisure, recreation and holidays
Visiting relatives and friends
Business and professional
Other reasons
ABROAD
Leisure, recreation and holidays
Visiting relatives and friends
Business and professional
Other reasons
%
42,776,473
19,932,250
15,694,839
4,803,486
2,345,898
39,403,464
18,091,453
14,882,731
4,225,457
2,203,822
3,373,010
1,840,797
812,108
578,029
-
Annual
variation
100.0
46.6
36.7
11.2
5.5
100.0
45.9
37.8
10.7
5.6
100.0
54.6
24.1
17.1
-
Accumulated data
Trips
%
-8.5
-8.5
-3.0
-11.0
-31.0
-8.5
-8.5
-3.4
-10.8
-30.1
-8.9
-8.7
4.5
-12.6
-
83,081,938
36,049,162
33,676,588
8,634,274
4,721,914
76,292,816
32,320,701
31,899,967
7,627,502
4,444,647
6,789,122
3,728,461
1,776,621
1,006,772
-
Annual
variation
100.0
43.4
40.5
10.4
5.7
100.0
42.4
41.8
10.0
5.8
100.0
54.9
26.2
14.8
-
4.6
9.7
10.3
-12.3
-23.6
4.6
8.9
10.0
-10.8
-22.4
5.1
17.0
16.2
-22.1
-
Note: the data marked with "-" do not have sufficient sampling support
3. Trips by main accommodation and destination of the trip
Quarterly data
Trips
TOTAL
Rented accommodation
- Hotels or similar accommodation
- Rented dwelling
- Other rented accommodation
Non-rented accommodation
- Owned dwelling
- Accommodation by relatives or friends
- Other non-rented accommodation
SPAIN
Rented accommodation
- Hotels or similar accommodation
- Rented dwelling
- Other rented accommodation
Non-rented accommodation
- Owned dwelling
- Accommodation by relatives or friends
- Other non-rented accommodation
ABROAD
Rented accommodation
- Hotels or similar accommodation
- Other rented accommodation
Non-rented accommodation
%
Annual
variation
42,776,473
15,915,140
10,647,896
2,232,049
3,035,195
26,861,333
8,761,544
17,625,638
474,152
39,403,464
13,425,104
8,805,919
1,912,736
2,706,450
25,978,360
8,703,308
16,839,641
435,410
3,373,010
100.0
37.2
24.9
5.2
7.1
62.8
20.5
41.2
1.1
100.0
34.1
22.3
4.9
6.9
65.9
22.1
42.7
1.1
100.0
-8.5
-9.9
-7.2
7.3
-26.1
-7.7
3.0
-11.6
-26.4
-8.5
-10.3
-6.6
4.5
-27.1
-7.5
2.9
-11.4
-28.3
-8.9
2,490,036
1,841,977
648,059
882,974
73.8
54.6
19.2
26.2
-7.3
-9.7
0.4
-13.3
ETR/FAMILITUR (ANNEX OF TABLES) - SECOND QUARTER 2016 (1/7)
28th September 2016
Accumulated data
Trips
%
83,081,938
29,516,555
19,896,116
4,242,005
5,378,434
53,565,383
15,976,012
36,824,749
764,622
76,292,816
24,799,099
16,301,945
3,610,937
4,886,217
51,493,718
15,767,437
35,018,556
707,724
6,789,122
4,717,457
3,594,172
1,123,285
2,071,665
Annual
variation
100.0
35.5
23.9
5.1
6.5
64.5
19.2
44.3
0.9
100.0
32.5
21.4
4.7
6.4
67.5
20.7
45.9
0.9
100.0
69.5
52.9
16.5
30.5
4.6
3.1
3.0
16.2
-5.2
5.5
14.7
3.0
-30.4
4.6
2.2
2.5
11.2
-4.5
5.8
14.2
3.2
-25.6
5.1
8.0
5.3
17.3
-1.0
4. Overnights by destination
Quaterly data
Overnights
TOTAL
Spain
Abroad
%
Annual
variation
Accumulated data
Overnights
%
Annual
variation
127,277,626
100.0
-15.2
265,758,133
100.0
4.2
105,663,717
21,613,910
83.0
17.0
-14.0
-20.9
217,385,024
48,373,110
81.8
18.2
5.7
-2.1
5. Overnights by purpose of the trip and main destination
Quaterly data
Overnights
TOTAL
Leisure, recreation and holidays
Visiting relatives and friends
Business and professional
Other reasons
SPAIN
Leisure, recreation and holidays
Visiting relatives and friends
Business and professional
Other reasons
ABROAD
Leisure, recreation and holidays
Visiting relatives and friends
Business and professional
Other reasons
%
127,277,626
60,886,270
41,510,235
16,742,109
8,139,012
105,663,717
51,179,514
33,835,073
13,553,925
7,095,204
21,613,910
9,706,756
7,675,162
3,188,184
-
Annual
variation
100.0
47.8
32.6
13.2
6.4
100.0
48.4
32.0
12.8
6.7
100.0
44.9
35.5
14.8
-
-15.2
-10.6
-15.6
-11.7
-41.2
-14.0
-10.8
-16.3
-4.7
-34.0
-20.9
-9.7
-12.3
-32.6
-
Accumulated data
Overnights
%
265,758,133
112,364,264
107,531,816
28,285,336
17,576,717
217,385,024
93,427,999
86,241,379
23,059,426
14,656,220
48,373,110
18,936,265
21,290,437
5,225,910
-
Annual
variation
100.0
42.3
40.5
10.6
6.6
100.0
43.0
39.7
10.6
6.7
100.0
39.1
44.0
10.8
-
4.2
14.0
10.6
-17.0
-30.1
5.7
13.1
9.3
-6.9
-24.2
-2.1
18.6
16.3
-43.9
-
Note: the data marked with "-" do not have sufficient sampling support
6. Overnights by main accommodation and destination of the trip
Quaterly data
Overnights
TOTAL
Rented accommodation
- Hotels or similar accommodation
- Rented dwelling
- Other rented accommodation
Non-rented accommodation
- Owned dwelling
- Accommodation by relatives or friends
- Other non-rented accommodation
SPAIN
Rented accommodation
- Hotels or similar accommodation
- Rented dwelling
- Other rented accommodation
Non-rented accommodation
- Owned dwelling
- Accommodation by relatives or friends
- Other non-rented accommodation
ABROAD
Rented accommodation
- Hotels or similar accommodation
- Other rented accommodation
Non-rented accommodation
%
Annual
variation
Accumulated data
Overnights
%
Annual
variation
127,277,626
100.0
-15.2
265,758,133
100.0
4.2
57,795,192
37,058,038
10,799,075
9,938,079
69,482,434
20,889,782
47,628,838
963,814
105,663,717
44,736,578
28,148,049
8,461,827
8,126,702
60,927,139
20,619,476
39,496,954
810,708
21,613,910
13,058,615
8,909,989
4,148,626
8,555,295
45.4
29.1
8.5
7.8
54.6
16.4
37.4
0.8
100.0
42.3
26.6
8.0
7.7
57.7
19.5
37.4
0.8
100.0
60.4
41.2
19.2
39.6
-9.1
-4.0
3.3
-31.8
-19.7
-8.6
-23.0
-45.4
-14.0
-6.6
-1.8
5.3
-27.3
-18.7
-8.3
-22.5
-45.0
-20.9
-16.9
-10.2
-28.5
-26.2
103,096,198
65,796,745
19,308,414
17,991,038
162,661,935
43,307,001
117,530,586
1,824,348
217,385,024
78,538,851
48,543,759
14,966,183
15,028,909
138,846,173
41,644,722
95,690,227
1,511,224
48,373,110
24,557,347
17,252,986
7,304,361
23,815,763
38.8
24.8
7.3
6.8
61.2
16.3
44.2
0.7
100.0
36.1
22.3
6.9
6.9
63.9
19.2
44.0
0.7
100.0
50.8
35.7
15.1
49.2
1.2
5.7
-0.7
-10.6
6.2
17.3
3.8
-40.2
5.7
3.7
4.4
7.3
-1.8
6.9
15.0
4.7
-32.4
-2.1
-5.8
9.5
-29.1
2.1
ETR/FAMILITUR (ANNEX OF TABLES) - SECOND QUARTER 2016 (2/7)
28th September 2016
7. Average duration by main destination
Quaterly data
Average
duration
TOTAL
Spain
Abroad
Accumulated data
Average
Annual
duration
variation
Annual
variation
3.0
2.7
6.4
-7.3
-5.9
-13.2
3.2
2.8
7.1
-0.4
1.1
-6.8
8. Average duration by purpose of the trip and main destination
Quaterly data
Average
duration
TOTAL
Leisure, recreation and holidays
Visiting relatives and friends
Business and professional
Other reasons
SPAIN
Leisure, recreation and holidays
Visiting relatives and friends
Business and professional
Other reasons
ABROAD
Leisure, recreation and holidays
Visiting relatives and friends
Business and professional
Other reasons
Accumulated data
Annual
variation
3.0
3.1
2.6
3.5
3.5
2.7
2.8
2.3
3.2
3.2
6.4
5.3
9.5
5.5
-
Average
duration
-7.3
-2.4
-13.0
-0.8
-14.7
-6.0
-2.6
-13.4
6.8
-5.6
-13.1
-1.1
-16.0
-22.9
-
Annual
variation
3.2
3.1
3.2
3.3
3.7
2.8
2.9
2.7
3.0
3.3
7.1
5.1
12.0
5.2
-
-0.4
3.9
0.3
-5.4
-8.5
1.1
3.9
-0.6
4.3
-2.3
-6.8
1.4
0.0
-27.9
-
Note: the data marked with "-" do not have sufficient sampling support
9. Average duration by main accommodation and destination of the trip
Quaterly data
TOTAL
Rented accommodation
- Hotels or similar accommodation
- Rented dwelling
- Other rented accommodation
Non-rented accommodation
- Owned dwelling
- Accommodation by relatives or friends
- Other non-rented accommodation
SPAIN
Rented accommodation
- Hotels or similar accommodation
- Rented dwelling
- Other rented accommodation
Non-rented accommodation
- Owned dwelling
- Accommodation by relatives or friends
- Other non-rented accommodation
ABROAD
Rented accommodation
- Hotels or similar accommodation
- Other rented accommodation
Non-rented accommodation
Accumulated data
Average
Annual
Average
duration
variation
duration
3.0
3.6
3.5
4.8
3.3
2.6
2.4
2.7
2.0
2.7
3.3
3.2
4.4
3.0
2.3
2.4
2.3
1.9
6.4
-7.3
0.8
3.4
-3.7
-7.6
-13.0
-11.3
-12.9
-25.8
-6.0
4.2
5.1
0.8
-0.3
-12.1
-10.9
-12.5
-23.3
-13.1
5.2
4.8
6.4
9.7
-10.4
-0.6
-28.7
-14.9
ETR/FAMILITUR (ANNEX OF TABLES) - SECOND QUARTER 2016 (3/7)
28th September 2016
Annual
variation
3.2
3.5
3.3
4.6
3.3
3.0
2.7
3.2
2.4
2.8
3.2
3.0
4.1
3.1
2.7
2.6
2.7
2.1
7.1
5.2
4.8
6.5
11.5
-0.4
-1.8
2.6
-14.5
-5.7
0.7
2.2
0.8
-14.1
1.1
1.5
1.8
-3.5
2.9
1.1
0.7
1.4
-9.2
-6.8
-12.8
3.9
-39.6
3.1
10. Total expenditure by destination
Quaterly data
Total expenditure
(millions of euros)
TOTAL
Spain
Abroad
%
Annual
variation
Accumulated data
Total expenditure
(millions of euros)
%
Annual
variation
8,508.3
100.0
-5.3
16,498.6
100.0
12.2
5,791.1
68.1
-5.2
11,263.5
68.3
11.9
2,717.2
31.9
-5.6
5,235.1
31.7
13.0
11. Total expenditure by purpose of the trip and main destination
Quaterly data
Total expenditure
(millions of euros)
TOTAL
Leisure, recreation and holidays
Visiting relatives and friends
Business and professional
Other reasons
SPAIN
Leisure, recreation and holidays
Visiting relatives and friends
Business and professional
Other reasons
ABROAD
Leisure, recreation and holidays
Visiting relatives and friends
Business and professional
Other reasons
%
Annual
variation
Accumulated data
Total expenditure
(millions of euros)
%
Annual
variation
8,508.3
100.0
-5.3
16,498.6
100.0
12.2
4,473.2
1,793.9
1,806.3
435.0
52.6
21.1
21.2
5.1
-2.9
-1.9
3.9
-46.5
5,791.1
100.0
-5.2
3,013.6
1,301.5
1,145.0
330.9
2,717.2
1,459.5
492.4
661.3
-
52.0
22.5
19.8
5.7
100.0
53.7
18.1
24.3
-
-3.0
-5.3
1.8
-34.2
-5.6
-2.6
8.3
7.7
-
8,234.7
4,141.9
3,186.9
935.1
11,263.5
5,503.0
2,988.5
2,080.6
691.4
5,235.1
2,731.7
1,153.4
1,106.4
-
49.9
25.1
19.3
5.7
100.0
48.9
26.5
18.5
6.1
100.0
52.2
22.0
21.1
-
21.8
18.0
4.8
-32.7
11.9
20.5
14.3
6.4
-25.7
13.0
24.5
28.9
1.9
-
Note: the data marked with "-" do not have sufficient sampling support
12. Total expenditure by main accommodation and destination of the trip
Quaterly data
Total expenditure
(millions of euros)
TOTAL
Rented accommodation
- Hotels or similar accommodation
- Rented dwelling
- Other rented accommodation
Non-rented accommodation
- Owned dwelling
- Accommodation by relatives or friends
- Other non-rented accommodation
SPAIN
Rented accommodation
- Hotels or similar accommodation
- Rented dwelling
- Other rented accommodation
Non-rented accommodation
- Owned dwelling
- Accommodation by relatives or friends
- Other non-rented accommodation
ABROAD
Rented accommodation
- Hotels or similar accommodation
- Other rented accommodation
Non-rented accommodation
%
Annual
variation
8,508.3
6,073.3
4,656.8
758.8
657.7
2,435.0
556.3
1,832.0
46.6
5,791.1
3,848.6
2,913.1
496.5
439.0
1,942.5
548.5
1,356.0
38.0
2,717.2
100.0
71.4
54.7
8.9
7.7
28.6
6.5
21.5
0.5
100.0
66.5
50.3
8.6
7.6
33.5
9.5
23.4
0.7
100.0
-5.3
-2.2
2.5
6.1
-30.9
-12.2
-4.8
-13.7
-29.4
-5.2
-1.2
4.1
3.9
-29.1
-12.2
-2.9
-15.3
-17.3
-5.6
2,224.8
1,743.7
481.1
492.4
81.9
64.2
17.7
18.1
-4.0
-0.2
-15.6
-12.3
ETR/FAMILITUR (ANNEX OF TABLES) - SECOND QUARTER 2016 (4/7)
28th September 2016
Accumulated data
Total expenditure
(millions of euros)
16,498.6
11,014.6
8,472.4
1,380.3
1,161.9
5,484.0
1,180.8
4,231.6
71.6
11,263.5
6,968.8
5,272.2
889.3
807.3
4,294.6
1,116.4
3,121.0
57.2
5,235.1
4,045.8
3,200.2
845.6
1,189.4
%
Annual
variation
100.0
66.8
51.4
8.4
7.0
33.2
7.2
25.6
0.4
100.0
61.9
46.8
7.9
7.2
38.1
9.9
27.7
0.5
100.0
77.3
61.1
16.2
22.7
12.2
13.0
17.7
13.0
-12.8
10.8
20.8
11.0
-55.6
11.9
12.4
15.5
10.0
-2.7
11.1
18.5
11.2
-51.3
13.0
14.0
21.6
-7.6
9.6
13. Average expenditure by destination
Quaterly data
Average expenditure
by person (euros)
TOTAL
Spain
Abroad
Accumulated data
Average expenditure
by person (euros)
Annual
variation
Annual
variation
199
3.5
199
7.3
147
806
3.6
3.7
148
771
7.0
7.5
14. Average expenditure by purpose of the trip and main destination
Quaterly data
Average expenditure
Annual
by person (euros)
variation
TOTAL
Leisure, recreation and holidays
Visiting relatives and friends
Business and professional
Other reasons
SPAIN
Leisure, recreation and holidays
Visiting relatives and friends
Business and professional
Other reasons
ABROAD
Leisure, recreation and holidays
Visiting relatives and friends
Business and professional
Other reasons
199
224
114
376
185
147
167
87
271
150
806
793
606
1,144
-
3.5
6.1
1.2
16.7
-22.5
3.6
6.0
-2.0
14.1
-5.9
3.7
6.7
3.7
23.2
-
Accumulated data
Average expenditure
Annual
by person (euros)
variation
199
228
123
369
198
148
170
94
273
156
771
733
649
1,099
-
7.3
11.0
7.0
19.5
-11.9
7.0
10.6
3.9
19.3
-4.3
7.5
6.4
10.9
30.9
-
Note: the data marked with "-" do not have sufficient sampling support
15. Average expenditure by main accommodation and destination of the trip
TOTAL
Rented accommodation
- Hotels or similar accommodation
- Rented dwelling
- Other rented accommodation
Non-rented accommodation
- Owned dwelling
- Accommodation by relatives or friends
- Other non-rented accommodation
SPAIN
Rented accommodation
- Hotels or similar accommodation
- Rented dwelling
- Other rented accommodation
Non-rented accommodation
- Owned dwelling
- Accommodation by relatives or friends
- Other non-rented accommodation
ABROAD
Rented accommodation
- Hotels or similar accommodation
- Other rented accommodation
Non-rented accommodation
Quaterly data
Average expenditure
Annual
Accumulated data
Average expenditure
Annual
by person (euros)
variation
by person (euros)
variation
199
3.5
199
7.3
382
437
340
217
91
63
104
98
147
287
331
260
162
75
63
81
87
806
8.5
10.4
-1.1
-6.5
-4.9
-7.6
-2.3
-4.1
3.6
10.2
11.5
-0.5
-2.8
-5.1
-5.7
-4.3
15.2
3.7
373
426
325
216
102
74
115
94
148
281
323
246
165
83
71
89
81
771
9.6
14.3
-2.8
-8.0
5.0
5.2
7.8
-36.2
7.0
10.0
12.7
-1.0
1.8
5.1
3.8
7.8
-34.6
7.5
893
947
742
558
3.6
10.5
-15.9
1.2
858
890
753
574
5.6
15.4
-21.3
10.7
ETR/FAMILITUR (ANNEX OF TABLES) - SECOND QUARTER 2016 (5/7)
28th September 2016
16. Daily average expenditure by destination
Quaterly data
Daily average
expenditure (euros)
TOTAL
Spain
Abroad
Accumulated data
Daily average
expenditure (euros)
Annual
variation
67
55
126
11.7
10.2
19.3
Annual
variation
62
52
108
7.7
5.8
15.4
17. Daily average expenditure by purpose of the trip and main destination
Quaterly data
Accumulated data
Daily average
expenditure (euros)
TOTAL
Leisure, recreation and holidays
Visiting relatives and friends
Business and professional
Other reasons
SPAIN
Leisure, recreation and holidays
Visiting relatives and friends
Business and professional
Other reasons
ABROAD
Leisure, recreation and holidays
Visiting relatives and friends
Business and professional
Other reasons
Annual
variation
67
73
43
108
53
55
59
38
84
47
126
150
64
207
-
Daily average
expenditure (euros)
11.7
8.7
16.3
17.6
-9.1
10.2
8.8
13.2
6.8
-0.3
19.3
7.9
23.5
59.8
-
Annual
variation
62
73
39
113
53
52
59
35
90
47
108
144
54
212
-
7.7
6.8
6.7
26.3
-3.8
5.8
6.5
4.6
14.4
-2.0
15.4
5.0
10.9
81.6
-
Note: the data marked with "-" do not have sufficient sampling support
18. Daily average expenditure by main accommodation and destination
Quaterly data
Accumulated data
Daily average
Annual
expenditure (euros)
TOTAL
Rented accommodation
- Hotels or similar accommodation
- Rented dwelling
- Other rented accommodation
Non-rented accommodation
- Owned dwelling
- Accommodation by relatives or friend
- Other non-rented accommodation
SPAIN
Rented accommodation
- Hotels or similar accommodation
- Rented dwelling
- Other rented accommodation
Non-rented accommodation
- Owned dwelling
- Accommodation by relatives or friend
- Other non-rented accommodation
ABROAD
Rented accommodation
- Hotels or similar accommodation
- Other rented accommodation
Non-rented accommodation
Daily average
variation
expenditure (euros)
67
105
126
70
66
35
27
38
48
55
86
103
59
54
32
27
34
47
126
11.7
7.6
6.7
2.7
1.2
9.3
4.2
12.1
29.3
10.2
5.8
6.0
-1.3
-2.5
8.0
5.9
9.3
50.3
19.3
170
196
116
58
15.6
11.1
17.9
18.9
ETR/FAMILITUR (ANNEX OF TABLES) - SECOND QUARTER 2016 (6/7)
28th September 2016
Annual
62
107
129
71
65
34
27
36
39
52
89
109
59
54
31
27
33
38
108
165
185
116
50
variation
7.7
11.6
11.4
13.8
-2.5
4.3
3.0
6.9
-25.7
5.8
8.4
10.7
2.5
-1.0
3.9
3.1
6.3
-28.0
15.4
21.0
11.1
30.3
7.3
19. Expenditure according items by destination
Total
Spain
(millions
of euros)
TOTAL
Expenditure on tourist package
Expenditure excluded on tourist package
- Expenditure on accommodation
- Expenditure on transport
- Expenditure on food and drinks
- Other expenditure
%
Annual
variation
Abroad
(millions
of euros)
%
Annual
variation
(millions
of euros)
%
Annual
variation
8,508.3
100.0
-5.3
5,791.1
100.0
-5.2
2,717.2
100.0
-5.6
829.0
7,679.3
1,895.6
2,190.3
1,896.6
1,696.8
9.7
90.3
22.3
25.7
22.3
19.9
-6.7
-5.2
4.6
-9.0
-20.2
12.9
389.2
5,401.9
1,340.4
1,315.7
1,427.4
1,318.4
6.7
93.3
23.1
22.7
24.6
22.8
4.9
-5.8
1.3
-16.6
-20.6
27.1
439.8
2,277.4
555.2
874.6
469.2
378.4
16.2
83.8
20.4
32.2
17.3
13.9
-15.0
-3.5
13.4
5.6
-18.7
-18.7
20. Trips, overnights and expenditure by autonomous region of residence of travelers
Trips
Overnights
Total
TOTAL
Andalucía
Aragón
Asturias, Principado de
Balears, Illes
Canarias
Cantabria
Castilla y León
Castilla - La Mancha
Cataluña
Comunitat Valenciana
Extremadura
Galicia
Madrid, Comunidad de
Murcia, Región de
Navarra, Comunidad Foral de
País Vasco
Rioja, La
Ceuta
Melilla
%
Total
Total expenditure
(millions of euros)
%
Total
%
Average
expenditure by
person (euros)
Daily average
expenditure
(euros)
Total
Total
42,776,473
100.0
127,277,626
100.0
8,508.3
100.0
199
67
7,162,878
16.7
20,405,217
16.0
1,187.6
14.0
166
58
1,573,162
3.7
4,624,791
3.6
286.6
3.4
182
62
1,173,760
2.7
3,811,613
3.0
245.1
2.9
209
64
668,089
1.6
2,599,372
2.0
201.6
2.4
302
78
1,466,178
3.4
5,092,604
4.0
374.8
4.4
256
74
639,926
1.5
1,729,728
1.4
124.2
1.5
194
72
2,651,799
6.2
7,703,361
6.1
466.6
5.5
176
61
2,096,728
4.9
6,215,330
4.9
397.5
4.7
190
64
6,866,260
16.1
20,848,029
16.4
1,556.4
18.3
227
75
3,231,078
7.6
9,395,538
7.4
658.1
7.7
204
70
849,813
2.0
2,397,395
1.9
151.2
1.8
178
63
1,975,015
4.6
5,767,024
4.5
362.9
4.3
184
63
7,664,963
17.9
20,941,903
16.5
1,482.1
17.4
193
71
985,411
2.3
3,001,831
2.4
200.4
2.4
203
67
670,213
1.6
2,084,038
1.6
140.0
1.6
209
67
2,648,707
6.2
9,088,939
7.1
573.6
6.7
217
63
321,183
0.8
1,084,581
0.9
67.2
0.8
209
62
82,221
49,088
0.2
0.1
253,211
233,121
0.2
0.2
14.1
18.5
0.2
0.2
171
376
56
79
21. Trips, overnights and expenditure by destination (abroad and autonomous regions)
Trips
Overnights
Total
TOTAL
Abroad
Andalucía
Aragón
Asturias, Principado de
Balears, Illes
Canarias
Cantabria
Castilla y León
Castilla - La Mancha
Cataluña
Comunitat Valenciana
Extremadura
Galicia
Madrid, Comunidad de
Murcia, Región de
Navarra, Comunidad Foral de
País Vasco
Rioja, La
Ceuta
Melilla
%
42,776,473
3,373,010
7,601,626
1,701,103
890,404
829,048
1,492,165
1,031,675
3,832,207
3,232,282
5,713,541
3,681,096
1,001,783
2,057,845
3,419,905
873,858
546,746
1,132,076
341,116
-
Note: the data marked with "-" do not have sufficient sampling support
ETR/FAMILITUR (ANNEX OF TABLES) - SECOND QUARTER 2016 (7/7)
28th September 2016
Total
100.0
7.9
17.8
4.0
2.1
1.9
3.5
2.4
9.0
7.6
13.4
8.6
2.3
4.8
8.0
2.0
1.3
2.6
0.8
-
Total expenditure
(millions of euros)
%
127,277,626
21,613,910
21,294,572
4,117,647
2,204,087
3,608,637
4,693,700
2,712,988
8,730,812
6,681,863
14,367,610
12,245,747
2,999,013
5,685,329
9,175,186
2,090,148
1,327,010
2,809,036
828,153
-
Total
100.0
17.0
16.7
3.2
1.7
2.8
3.7
2.1
6.9
5.2
11.3
9.6
2.4
4.5
7.2
1.6
1.0
2.2
0.7
-
%
8,508.3
2,717.2
1,089.6
198.9
102.9
276.1
370.6
131.4
394.1
257.7
847.7
612.1
128.8
308.4
674.1
101.0
73.3
178.9
39.2
-
100.0
31.9
12.8
2.3
1.2
3.2
4.4
1.5
4.6
3.0
10.0
7.2
1.5
3.6
7.9
1.2
0.9
2.1
0.5
-
Average
expenditure by
person (euros)
Daily average
expenditure
(euros)
Total
Total
199
806
143
117
116
333
248
127
103
80
148
166
129
150
197
116
134
158
115
-
67
126
51
48
47
77
79
48
45
39
59
50
43
54
73
48
55
64
47
-
© Copyright 2026