
Country Report 2016
EUROPEAN COMMISSION Brussels, 26.2.2016 SWD(2016) 78 final COMMISSION STAFF WORKING DOCUMENT Country Report Spain 2016 Including an In-Depth Review on the prevention and correction of macroeconomic imbalances This document is a European Commission staff working document. It does not constitute the official position of the Commission, nor does it prejudge any such position. EN EN CONTENTS Executive summary 1 1. Scene setter: economic situation and outlook 4 2. Imbalances, risks and adjustment issues 12 2.1. External sustainability and competitiveness 12 2.2. Euro area spillovers 23 2.3. Indebtedness and deleveraging 26 2.4. Labour market adjustment 35 2.5. Potential growth 45 2.6. MIP Assessment Matrix 52 3. Additional structural issues 54 3.1 Research and innovation 54 3.2. Skills and education 56 3.3. Social policies 59 3.4. Product and services markets 63 3.5. Public administration, fiscal frameworks and taxation 76 A. Overview table 84 B. MIP scoreboard 89 C. Standard tables 90 LIST OF TABLES 1.1. Key economic, financial and social indicators - Spain 11 2.1.1. Current account and net international investment position scenarios 20 2.6.1. MIP Assessment matrix (*) – Spain 52 3.4.1. Business environment factors with highest importance on company growth. 65 3.5.1. Implementation of the Stability law’s corrective measures in 2014 and 2015 81 B.1. The MIP scoreboard for Spain 89 C.1. Financial market indicators 90 C.2. Labour market and social indicators 90 C.3. Labour market and social indicators (continued) 91 C.4. Structural policy and business environment indicators 92 C.5. Green growth 93 LIST OF GRAPHS 1.1. Real GDP growth and contributions 4 1.2. Net lending (+)/net borrowing (-) by sector 5 1.3. Employment growth and unemployment 6 1.4. Breakdown of the change of unit labour costs in Spain 6 1.5. Youth and long-term unemployment 6 1.6. Poverty indicators 7 2.1.1. Adjustment in the current account 12 2.1.2. Net international investment position and current account balance 13 2.1.3. Changes in share of exports of goods in EU economies (values) 13 2.1.4. Spanish exports by geographical destination 13 2.1.5. Breakdown of export market share changes (in values) of Spanish exports of goods 14 2.1.6. World market shares of Spanish exports of services 15 2.1.7. Share of exports by enterprise size (number of employees. Industry) 15 2.1.8. Structure of Spanish exports of goods 15 2.1.9. Breakdown of Spanish exports by technological content 16 2.1.10. Exports of medium-high and high technology goods in the EU in 2014 16 2.1.11. Density function of export values per quality rank 17 2.1.12. Shares of top-quality exports by country (value) 17 2.1.13. Energy dependence by country (2013) 18 2.1.14. Import content of exports of medium-high and high technology products (mid-2000s) 18 2.1.15. Cyclically-adjusted current account balance 19 2.1.16. Contribution to changes in the NIIP 19 2.1.17. Evolution of the share of tradable sectors in gross value added and employment 21 2.1.18. Unit labour costs in Spain (year-on-year changes) 21 2.2.1. Spanish exports by destination to EU countries(2013) 23 2.2.2. Foreign claims of Spanish banks on EU countries, by sector 23 2.2.3. Spanish imports by country of origin 24 2.2.4. Spanish foreign liabilities by trade partner 24 2.2.5. Responses of GDP to an increase in the Spanish risk premium 25 2.3.1. Breakdown of debt in Spain by sector, quarterly non-consolidated 26 2.3.2. Breakdown of year-on-year changes in debt-to-GDP ratio for households in Spain 27 2.3.3. New loans to households in Spain 27 2.3.4. Breakdown of year-on-year changes in debt-to-GDP ratios for non-financial corporations in Spain 28 2.3.5. Bank financing to non-financial corporations in Spain - contributions to annual growth 28 2.3.6. Leverage of non-financial corporations in Spain 29 2.3.7. The stock of bank loans to the private sector in Spain 32 2.3.8. New loans to the corporate sector in Spain 32 2.3.9. Non-performing loan ratio in Spain 33 2.3.10. Valuation gap in the Spanish housing market according to the price-to-rent and price-toincome ratios 34 2.4.1. Unemployment rate, GDP and employment growth in the market sector 35 2.4.2. Wages and unit labour cost 36 2.4.3. Coverage of firm level collective bargaining 37 2.4.4. Wage growth in tradable and non-tradable sectors 37 2.4.5. The evolution of employment in non-market sectors 38 2.4.6. The evolution of the job finding rate before and after the reform 38 2.4.7. The evolution of the job separation rate before and after the reform 39 2.4.8. Job finding rate by duration of unemployment 39 2.4.9. Long-term unemployment by skills level 40 2.4.10. Beveridge curve for Spain 40 2.4.11. Skills mismatch and unemployment rate 41 2.4.12. Newly signed temporary and permanent contracts 43 2.5.1. Contributions to potential growth, ES and EA 45 2.5.2. Labour inputs' contribution to potential growth 46 2.5.3. Total Factor Productivity, ES and EA-12 47 2.5.4. Capital intensity and capital productivity 47 2.5.5. Allocative Efficiency, Spain 48 2.5.6. Total factor productivity growth rates for selected sectors, Spain, 1990–2007 49 3.1.1. Spain. Evolution of business R&D intensity and public R&D intensity 54 3.1.2. Summary innovation index 55 3.2.1. Adults participating in education and training (% of the population), total, ages 25-64 57 3.3.1. Poverty and social exclusion in Spain 59 3.3.2. Poverty and social exclusion in Spain by age 60 3.4.1. Share of large companies and economic development. 63 3.4.2. Labour productivity by enterprise size 63 3.4.3. Productivity level by industry sector and enterprise size class 64 3.4.4. Average firm size per age, 2013 3.4.5. Productivity gap between largest (250 or more employees) and smallest companies (less than 9 employees) and technological development. 3.4.6. 64 65 Share of professional services in gross value added and in total employment. Apparent labour productivity 66 3.4.7. Forward linkage effects. Other business activity sector and total economy 69 3.4.8. Changes in gross value added deflator by component in selected sectors. 69 3.4.9. Gross operating rate, investment rate and number of persons employed per enterprise. Professional services vs. total business economy. 3.4.10. 70 Spain. Cumulated number of ordinary laws in force and cumulated number of powers devolved to regions, 1980-2015 70 3.4.11. Summary results of Doing business subnational in Spain 71 3.4.12. Standard deviation of distance to frontier in selected Doing Business indicators. 71 3.4.13. High-speed line (HSL) network in Spain compared to other EU countries, 2014 74 3.4.14. Number of passenger-kilometres per kilometre of HSL network in Spain compared to other countries, 2013 74 3.5.1. Regional budget execution in 2015: contributions to expenditure growth 82 3.5.2. Spain. Regional governments deficit with and without an expenditure rule 82 LIST OF BOXES 1.1. Investment challenges 8 1.2. Contribution of the EU Budget structural change 10 2.3.1. Long-term projections of general government debt 31 2.4.1. New employment and social dialogue agreement marks a turning point 36 2.5.1. Potential macroeconomic impact of structural reforms 51 3.4.1. Size-contingent regulations in Spanish legislation 67 3.5.1. PIT reform – EUROMOD simulations 79 EXECUTIVE SUMMARY The Spanish economy has experienced a significant turnaround in recent years, also thanks to reforms undertaken in response to the crisis. Structural reforms helped ease existing rigidities in labour and product markets. The successful completion of the financial assistance programme facilitated the repair of the banking sector. Helped by monetary policy and a reinforced euro area governance framework, this broke the link between the financial sector and the sovereign debt and paved the way for a return of capital inflows and improved financial conditions. Substantial external adjustment also took place, also supported by cost-competitiveness gains. All these elements underpinned an increase in confidence in the Spanish economy, and growth resumed in 2013. Since then, internal and external rebalancing has advanced, and the current account has moved into surplus and Spain has been able to achieve, for the first time in almost 30 years, a current account surplus in a period of positive growth. The recovery strengthened in 2015, with growth well above the euro-area average. GDP is expected to have expanded by a robust 3.2% in 2015 as a whole. Growth was driven by domestic demand, boosted by improved access to credit for firms and households and increased confidence, together with declining oil prices. The recovery was accompanied by strong job creation in a context of continued wage moderation. Growth is expected to ease going forward, but remain robust. However, there are downward risks to this growth outlook mainly stemming from the external sector. Specifically, growth could be negatively affected by a more pronounced slowdown than expected in some main emerging economies and a deceleration in the reform agenda in 2015. The current account balance continued to improve. Favourable external developments and enhanced competitiveness sustained exports. However, the high responsiveness of imports to increases in final demand still implied a negative contribution of the external sector to growth. Furthermore, the current account surplus is largely due to the fall in oil prices that helped reduce the import bill. A return of oil prices to higher levels would slow down the progress in reducing net external liabilities. 1 Labour market reforms have increased the responsiveness of employment to growth. Compared to previous upturns, job creation has resumed at an earlier phase of the recovery, when GDP growth was still modest. Employment in full time equivalent terms is expected to have expanded by 3 % in 2015, helped by wage moderation and the increased flexibility introduced by labour market reforms in previous years. Although unemployment decreased at a record pace in 2015, at above 20% of the labour force it remains among the highest in the EU. The adjustment of the identified imbalances is advancing, but ensuring a balanced, durable and inclusive growth path over the long term remains a challenge. Although the return to growth reduces risks, Spain has not left the crisis unscathed. The stock of imbalances remains high and their nature, magnitude and interrelations still make Spain vulnerable to shocks. In particular, high private and public debt, reflected in the very high level of net external liabilities, exposes the country to risks stemming from shifts in market sentiment and is a burden for the economy. While the still negative inflation environment supports households' real disposable incomes and domestic demand, it also hinders faster deleveraging. Moreover, still high unemployment and the risk of labour market exclusion, affecting in particular young and low skilled people, hampers adjustment and implies high social costs. Furthermore, low productivity growth makes competitiveness gains hinge upon cost advantages, also affecting working conditions and social cohesion. If protracted, it hampers the transition of the economy to a more knowledge-intensive growth model. Overall, Spain has made some progress in addressing the 2015 country-specific recommendations. During the past year, Spain has made substantial progress to finalise the reform of its financial sector. The implementing legislation of the savings bank reform has been adopted and insolvency reforms recently introduced in Spain should support an improvement in the quality of bank assets. Spain has also made some progress in the labour market area. The latest framework for collective bargaining agreements has been a step forward in wage setting. Also some positive steps have been taken in the area of active labour market policies. However, no decisive measures have been taken to Executive summary promote labour market participation, regional mobility, or to streamline minimum income schemes. Spain has also made some progress to improve the business environment. In particular, some measures have been adopted to remove barriers preventing companies from growing, and has accelerated the implementation of the law on market unity. However, the planned reform of professional services has not yet been adopted. Finally, progress in the area of public finances has been limited. Although some measures have been taken to increase transparency in regions' finances, there has been only limited policy action to improve the cost-effectiveness of the healthcare sector and rationalise hospital pharmaceutical spending. Regarding the progress in reaching the national targets under the Europe 2020 Strategy, Spain is performing well in tertiary education attainment and reducing greenhouse gas emissions, while more effort is needed in employment rate, reducing early school leaving, R&D investment, renewable energy, energy efficiency and reducing poverty. The main findings of the in-depth review contained in this country report and the related policy challenges are as follows: The sizeable current account adjustment experienced in recent years has not yet translated into a significant reduction in Spain’s external liabilities. Spain’s net external liabilities still stand at over 90% of GDP, and are mostly made up of debt instruments. This implies a high repayment burden for the economy, irrespective of the business cycle. Reducing the vulnerabilities associated with the large stock of external liabilities requires a combination of high nominal growth rates and high current account surpluses over a protracted period of time. Higher inflows of foreign direct investment would also help. The large size of the Spanish economy and its intense trade and financial links with other euro area Member States makes it a potentially important source of spillovers to these countries; at the same time, a sustained recovery of the Spanish economy hinges upon external demand. The high government debt remains a burden for the economy and a source of vulnerability. The general government deficit is falling mainly against the backdrop of dynamic growth, as recent windfall gains have not been used to accelerate its reduction. At a projected 4.8% of GDP in 2015, it remains among the highest in the euro area. The general government debt is projected to have reached over 100% of GDP in 2015, and is forecast to peak in 2016, before decreasing in 2017. Private sector debt continues to decline but remains high, making the country vulnerable to shocks. Deleveraging needs are estimated to be still large for both households and non-financial corporations. While in recent years debt reduction took place mainly through negative credit flows, it is now mainly driven by nominal GDP growth, as credit has started flowing again. Accordingly, the negative impact of debt reduction on growth has eased significantly. However, the low inflation environment remains an obstacle to debt reduction. Banking sector stabilisation is progressing well, strengthening the resilience of the economy. The outstanding volume of credit is still decreasing, also reflecting ongoing debt reduction by households and enterprises. However, new bank lending to less indebted firms and households is picking up. While access to alternative forms of financing is improving slowly, SMEs remain largely dependent on bank funding. Job creation was strong during 2015. However, unemployment remains very high, in particular for youth. Long-term unemployment is also very high and risks becoming entrenched, leading to an increase in poverty and/or social exclusion. Moreover, labour market duality between permanent and temporary contracts remains high, negatively affecting working conditions and social cohesion. Low potential growth amplifies the risks related to macroeconomic imbalances. Weak productivity dynamics have been at the root of Spain's low growth potential. Raising Spain's 2 Executive summary growth potential requires reducing the rate of structural unemployment, but the chief factor constraining potential growth remains productivity, which ultimately depends on the economy’s ability to boost its innovation capacity and reallocate resources efficiently across sectors and firms. Other key economic issues analysed in this report which point to particular challenges facing Spain’s economy are the following: Spain's R&D intensity and innovation performance keeps declining, against the backdrop of a relatively low number of innovative firms, limited incentives for university-business cooperation and institutional weaknesses leading to overlapping bodies and programmes to foster innovation activities. Moreover, Spain's science funding is not based on performance, which reduces the incentives to improve the quality and relevance of scientific outputs. In spite of significant improvements, the early school-leaving rate remains high and restrains the reduction of the country's educational gaps. Tertiary attainment is high, but there are skills mismatches in the labour market. The average low skills' level of the labour force hampers the transition of the Spanish economy towards higher-value activities. This in turn limits the capacity of the labour market to provide opportunities for the high number of tertiary education graduates in knowledge-intensive sectors. Despite improvements in the labour market, poverty is still a major concern. Indicators measuring poverty and social exclusion are very high compared to the EU average, and deteriorated further in 2014. This suggests that despite improvements in the labour market, the social impact of the crisis may take time to revert. In addition to the still difficult labour market conditions, the poverty reduction impact of social transfers remains low, especially for children. Furthermore, there remain wide regional disparities in delivery arrangements, eligibility requirements and adequacy of minimum income support schemes. 3 Spain's fragmented internal market regulations and obstacles to access to regulated professions contribute to low productivity. The small average size of Spanish firms also helps explain the economy’s persistently low productivity. Spain's highly decentralised administration creates coordination challenges, in various policy areas such as active labour market policies, research and innovation, retail trade, business licensing, etc. Moreover, there is no horizontal and coherent nation-wide public procurement policy, neither are there sufficient controls on the proper implementation of public procurement rules, especially at sub-central government level. Despite a rebound in business investment, structural barriers to investment remain. In 2015, business investment strengthened, underpinned by dynamic demand conditions, low borrowing costs, and ongoing balance sheet repair by the corporate sector and households. However, structural barriers to investment remain in the form of regulatory barriers and administrative burden, corporate taxation and access to finance, framework conditions for research and innovation, and in the area of labour market legislation. SCENE SETTER: ECONOMIC SITUATION AND OUTLOOK The Spanish economy gathered momentum in 2015. Improved access to credit for both firms and households and enhanced confidence, together with declining oil prices, supported domestic demand, and in particular private consumption. Favourable external developments and enhanced competitiveness limited the drag on growth from net exports. Despite decelerating slightly in the second half of the year, the GDP is forecast to have expanded by a robust 3.2 % in 2015 as a whole. Strong private consumption was underpinned by strong job creation, as well as by negative inflation in 2015, which sustained households' real disposable income in a context of continued wage moderation. Investment also continued to grow strongly, especially in equipment, but also non-residential construction. In turn, residential construction also expanded, although still at a modest pace. The emergence of new credit flowing to the economy implies that the drag on domestic demand from private sector deleveraging is easing. Growth is expected to remain robust. Notwithstanding some deceleration, real GDP growth in 2016 and 2017 is expected to be accompanied by broadly positive labour market developments and with low oil prices continuing to provide a powerful tailwind. Private consumption and investment are set to remain the main drivers of growth in the coming years (Graph 1.1). Downward risks prevail in the short term. These stem mainly from the external sector. Specifically, growth could be negatively affected by a more pronounced slowdown than expected in some main emerging economies and a possible deceleration in the reform agenda. Moreover, the recovery has been sustained by favourable external developments (oil prices and the depreciation of the euro) and supportive monetary policy. If some of these tailwinds were to abate over the short term, the recovery could lose traction. Graph 1.1: Real GDP growth and contributions 8 6 4 2 %, pps 1. 0 -2 -4 -6 -8 00 01 02 03 04 05 06 07 08 09 10 11 12 13 14 15 16 Inventories investment Consumption Real GDP growth Investment (GFCF) Net exports Source: European Commission The external balance continued to improve. Exports held up well, and are expected to have grown by 6 % in 2015. However, imports outpaced exports and are set to have expanded by 7.9 %, following the strong improvement observed in domestic demand. According to the Commission winter 2016 economic forecast, in 2015 net exports are expected to have provided a negative contribution to growth of 0.4 pps. However, the current account surplus is expected to have increased by 0.5 pps., to 1.5 % of GDP in 2015, helped by a lower deficit of the balance of incomes and low oil prices. Nevertheless, the accumulated non-energy surplus of goods up to November 2015 shrank by almost 85 % with respect to the same period in 2014, whereas the energy deficit narrowed by some 30 %. Looking forward, the net exports' contribution to growth is expected to become progressively neutral. Exports are expected to gather steam progressively, fuelled by continued improvements in competitiveness and recovering growth in Spain’s main export markets. Imports are forecast to decelerate, in line with domestic and final demand. Accordingly, net exports’ negative contribution to growth is expected to narrow to 0.2 pps. in 2016 and to turn broadly neutral in 2017. The current account surplus is set to narrow progressively to 1.3 % of GDP by 2017. 4 1. Scene setter: economic situation and outlook Inflation continues to be negative, mainly due to the fall in energy prices. The harmonised index of consumer prices (HICP inflation dropped by 0.6 % in 2015 on average. Core inflation was positive though, at 0.4 % for the year as a whole. While low inflation hinders a faster deleveraging, it keeps supporting to households’ disposable income and thus private consumption in the prevailing context of nominal wage moderation. Furthermore, the negative inflation differential with the euro area, at 0.6 pps in 2015 on average, promotes further gains in competitiveness. Private deleveraging remains on track, but indebtedness is still high. The total stock of private sector debt amounted to around 175 % of GDP in non-consolidated terms in the third quarter of 2015 (68.6 % of GDP as household debt and 107.2 % of GDP as non-financial corporation debt). While this remains above the euro area average, it is about some 40 % of GDP lower than the peak observed in the second quarter of 2010. Most of the reduction is due to the fall in debt of non-financial corporations since the peak.(1) Further deleveraging is expected by both households and non-financial corporations (Graph 1.2), even though consumption and investment are forecast to keep registering relatively high growth rates. Moreover, nominal GDP growth is now also supporting private deleveraging and is expected to become its main driver in the near future. High debt levels make agents more vulnerable to adverse shocks, but the prevailing low interest rates have eased their financial burden substantially (see Section 2.3 for details). (1) In consolidated terms, the non-financial corporations debt decreased from 117.7% in Q2-2010 to 87.6% in Q3-2015. Financial derivatives are excluded from debt calculations. 5 Graph 1.2: Net lending (+)/net borrowing (-) by sector 15 10 % of GDP Despite the current account surpluses registered since 2013, Spain's net external liabilities remain sizeable. The NIIP (the difference between total assets held by Spanish residents and liabilities with foreign agents) continued to deteriorate in 2014 mainly due to negative valuation effects. Some improvements were recorded in the first half of 2015, though leaving the NIIP at -92.5 % of GDP in the second quarter of 2015 (see Section 2.1 for details). 5 0 -5 -10 -15 00 01 02 03 04 05 06 07 08 09 10 11 12 13 14 15*16*17* Households and NPISH Corporations General government Total economy Source: European Commission Job creation continued to be strong in 2015. Employment in full time equivalent terms increased by around 3.1 % on the year in the third quarter of 2015 (Graph 1.3) and affiliates to the social security in the fourth quarter expanded at broadly similar rates. For the year as a whole, fulltime equivalent employment is expected to have expanded by 3 %. Robust job creation was underpinned by ongoing wage moderation and the labour market reforms implemented in previous years. Productivity growth slowed down over the first three quarters of 2015 and recorded only modest improvements. Accordingly, unit labour costs (ULCs) registered slight increases over the same period and are projected to keep growing at a moderate pace by the end of 2015 and in 2016 (Graph 1.4). 1. Scene setter: economic situation and outlook Graph 1.3: Employment growth and unemployment y-o-y% 30 remain unemployed. In the same period, the labour force declined by 0.7 % and the overall activity rate did so by almost 0.5 pps, with slight increases for young and older workers. 25 Graph 1.5: 20 % 60 % 8 6 Youth and long-term unemployment 4 2 0 15 50 -2 10 40 -4 5 -6 30 -8 0 01 02 03 04 05 06 07 08 09 10 11 12 13 14 15 FTE (lhs) Employed (lhs) Unemployment rate (rhs) Source: Instituto Nacional de Estadística 20 10 0 01 02 03 04 05 06 07 08 09 10 11 12 13 14 Unemployment rate Youth unemployment rate Graph 1.4: Breakdown of the change of unit labour costs in Spain Rate of change y-o-y (%) 8 6 4 2 0 -2 -4 00 01 02 03 04 05 06 07 08 09 10 11 12 13 14 15* 16* Inflation (GDP deflator growth) Real Compensation per Employee Productivity Contribution (negative sign) Nominal unit labour cost ULC in Euro Area Source: European Commission Despite a strong decline in 2015, the unemployment rate remains among the highest in the EU, especially among youth (Graph 1.5). Robust employment growth led to a brisk decline in unemployment. The unemployment rate dropped further by 2.8 pps, to 21 % of the work force in the fourth quarter of 2015 compared to one year earlier. The reduction was especially marked for youth unemployment, which went down by almost 6 pps, but still almost one out of two of active people aged between 15 and 24 Long-term unemployment rate Source: Eurostat The improved labour market conditions during 2013 and 2014 did not translate into an improvement in social indicators in those years. The crisis led to a sharp increase in the share of the population at-risk-of-poverty (2) and at-risk-ofpoverty or social exclusion (3). These poverty indicators deteriorated even further in 2013 and 2014 despite the amelioration in labour market conditions (Graph 1.6). The rise in the proportion of workers in part-time (from 14.5 % in 2012 to 15.6 % in 2015) and temporary jobs (from 23.4% in 2012 to 25.7 % in 2015) in recent years went hand in hand with an increasing risk of poverty among part-time workers (from 18.7 % in 2013 to 22.9 % in 2014) and temporary workers (from 17.5 % in 2013 to 22.9 % in 2014). Together with moderate wage developments, this contributed to the overall increase in in-work poverty observed between these two years. (2) At-risk-of poverty rate (AROP): share of people with disposable income below 60 % of the national median income. (3) People at-risk-of poverty or social exclusion (AROPE): are individuals who are at-risk-of poverty (AROP) and/or suffering from severe material deprivation (SMD) and/or living in household with zero or very low work intensity (LWI). 6 1. Scene setter: economic situation and outlook Graph 1.6: Poverty indicators 35 30 % 25 20 15 10 5 0 01 02 03 04 05 06 07 08 09 10 11 12 13 14 At-risk-of-poverty or social exclusion At-Risk-of-Poverty rate Severe material deprivation People living in low work intensity households Source: Eurostat The general government deficit is expected to have continued to narrow in 2015, mainly against the backdrop of strong GDP growth. The deficit for 2014 was 5.9 % of GDP, 0.1 % of GDP higher than originally reported due to a downward revision of nominal GDP. Data until October indicate that the deficit continued to shrink in the second half of 2015, driven by strong revenue growth. In particular, taxes on production and imports are growing at a fast pace, as domestic demand is growing briskly. Despite cuts in personal income taxes, taxes on income and wealth are expected to hold up well, thanks to a strong increase in corporate tax revenues. At the same time however, non-tax revenues fell and public consumption and investment increased in the third quarter. Going forward, the reduction of the general government deficit is set to continue to rely to a large extent on the positive macroeconomic outlook, which is set to support tax revenues and keep social transfers in check. According to the Commission winter 2016 economic forecast, the deficit is projected to amount to 4.8 % and 3.6 % of GDP in 2015 and 2016, respectively. Public debt is expected to continue to increase from 99.3 % of GDP in 2014 to 100.7 % in 2015, and then peak in 2016 at 101.2 % of GDP, before starting to decrease in 2017. 7 1. Scene setter: economic situation and outlook Box 1.1: Investment challenges Macroeconomic perspective Volatility of output in Spain during the last 15 years has been largely due to changes in investment, especially construction. The onset of the crisis brought about a sudden contraction of construction investment, especially residential (Graph 2). Construction investment has now stabilised, and despite the turnaround in the housing market, it is expected to grow only very moderately over the 2015-17 period. The decrease in equipment investment during the crisis was more muted, and in 2014 it rebounded strongly. Other investments (notably ICT and intellectual property investment) have been below the euro area average since well before the crisis, and are converging to the EU-28 average very slowly. This could reflect the fact that the productive specialization of the Spanish economy is geared towards medium-low technology products, as suggested in Chapter 2.5 of this report. Most of the pickup in investment is attributable to the private sector. Non-financial corporations' investment rate is at present among the highest in the EU. Capacity utilisation has approached its long term average in recent quarters, which suggests that it should support further increases in business investment in the short term (Graph 3). By contrast, public investment, which halved between 2009 and 2014, is expected to remain constant over the 2015-17 period, especially in light of the remaining fiscal consolidation needs (Graph 1). Graph 1: Public and private investment, Spain and EU28 Graph 2: Investment components, Spain and EU28 (1) Forecasts for 2015-2017 based on a no policy change assumption Source: European Commission (AMECO and winter 2016 forecast) Prolonged periods of weak investment have important supply-side implications. Capital accumulation is an important driver of potential output. It is estimated that a 1 pp. of GDP increase in the investment rate raises the potential growth of the economy by 0.35 pp. of GDP as explained in Section 2.5. Thus, the fall in investment between 2007 and 2015 entailed a drop in potential growth of nearly 1.5 pp. of GDP for Spain. Private sector deleveraging has also weighed on investment, but its impact is expected to diminish going forward. Subdued final demand has been a major driver of the evolution of investment in recent years, as supported by survey-based evidence. (1) However, deleveraging by both households and corporations has also weighed on investment. Going forward, private sector deleveraging needs are estimated to remain large (Section 2.3), but debt reduction is expected to be driven mainly by nominal (1) ECFIN Business and Consumer Surveys, Investment Survey, January 2016. (Continued on the next page) 8 1. Scene setter: economic situation and outlook Box (continued) growth, as new credit has started flowing again, implying that the negative impact of deleveraging on investment should diminish over the short to medium term. Finally, financial factors are now supporting investment. Since 2012, credit conditions have improved significantly and at present, borrowing costs are at historically low levels. Graph 3: Capacity utilisation and business investment Source: Eurostat Assessment of barriers to investment and ongoing reforms (2) Obstacles to doing business are a barrier to investment in Spain (Section 3.4). Spain ranks among the bottom half of EU countries in surveys referring to business environment and product market regulation. (3) Obstacles to doing business are particularly salient in the form of regulatory barriers and administrative burden, underpinned by cumbersome licensing requirements and regulatory fragmentation at different government layers (despite recent progress in the implementation of the law of market unity). Spain remains one of the Member States with the longest payment delays by public authorities, although measures have been taken to reduce public sector commercial arrears. Lengthy judicial proceedings in commercial litigation are an additional barrier to investment. Besides, sector-specific regulation preventing competition, such as those prevailing in the area of regulated professional services, restrictions to establishment of large retail outlets, or in the area of broadband networks, energy, and transport (Section 3.5), constitute barriers to entry that can be an important brake to investment. Impediments to investment also exist in the area of corporate taxation (Section 3.5) and access to finance (Section 2.3). The effective marginal corporate tax rate in Spain is among the highest in the EU. Besides, the high debt bias in corporate taxation hampers development in equity market, and in fact, venture capital investment in Spain is among the lowest in the EU. Poor framework conditions for research and innovation also hamper investment over the long term and the transition of the Spanish economy towards higher value added activities (See Section 3.1). Weak cooperation between the public and business sectors, and low efficiency of public sector expenditure in R&D hampers full leveraging of private R&D investment. Finally, some features of the labour market institutions can also act as barriers to investment. In particular, uncertainty about the outcomes of labour disputes, combined with a gap between costs for fair and unfair dismissals could increase the costs of litigation, and in turn, hold down investment. (2) See "Member States Investment Challenges", SWD (2015) 400 final/2 (3) According to the 2016 World Bank "Doing Business Report", Spain ranks 17th out of 28 EU countries in "ease of doing business", whereas in the "2016 World competitiveness report" by the World Economic Forum, Spain ranks 20th out of 24 EU countries in the sub area of "burden of government regulation", and 21 st out of 26 EU countries in efficiency in the goods market. 9 1. Scene setter: economic situation and outlook Box 1.2: Contribution of the EU Budget to structural change Spain is a beneficiary of European Structural and Investment Funds (ESIF) and can receive up to EUR 37.4 billion for the period 2014-2020. This is equivalent to 0.5% of GDP annually and 21.2% of the expected national public investment in areas supported by the ESI funds. A number of reforms were passed as ex-ante conditionalities in areas to benefit from the Funds to ensure successful investments. Reforms in areas such as research and innovation, waste management and the water sector, transport and the statistical system and result indicators are still pending, with in total 35 actions plans to be complete by end-2016. Where ex-ante conditionalities are not fulfilled by end 2016, the Commission may suspend interim payment to the priorities of the programme concerned. The programming of the Funds includes a focus on priorities and challenges identified in recent years in the context of the European Semester. In line with the country specific recommendations issued to Spain in the context of the European Semester, measures supporting active labour market policies and in particular individualised pathways for the social and labour market integration of people further away from the labour market will be closely monitored. As the biggest recipient of the Youth Employment Initiative with almost EUR 950 million (matched by the same amount from the European Social Fund), Spain has to implement measures targeting young people not in employment, education or training (NEET) grouped in the four objectives of a better activation, enhanced employability and skills, increased entrepreneurship and increased indefinite hiring. Regular monitoring of implementation includes reporting in mid-2017 on the contribution of the funds to Europe 2020 objectives and progress in addressing relevant structural reforms to maximise the use of EU financing (notably, in R&DI, energy, water and transport sectors, employment, education and social inclusion). Financing under the new European Fund for Strategic Investments (EFSI), Horizon 2020, the Connecting Europe Facility and other directly managed EU funds would be additional to the ESI Funds. Following the first rounds of calls for projects under the Connecting Europe Facility, Spain has signed agreements for EUR 2 million in the energy field and EUR 822 million for transport projects. For more information on the use of ESIF in Spain, see: https://cohesiondata.ec.europa.eu/countries/ES. 10 1. Scene setter: economic situation and outlook Table 1.1: Key economic, financial and social indicators - Spain Real GDP (y-o-y) Private consumption (y-o-y) Public consumption (y-o-y) Gross fixed capital formation (y-o-y) Exports of goods and services (y-o-y) Imports of goods and services (y-o-y) Output gap Potential growth (y-o-y) Contribution to GDP growth: Domestic demand (y-o-y) Inventories (y-o-y) Net exports (y-o-y) Contribution to potential GDP growth: Total Labour (hours) (y-o-y) Capital accumulation (y-o-y) Total factor productivity (y-o-y) Current account balance (% of GDP), balance of payments Trade balance (% of GDP), balance of payments Terms of trade of goods and services (y-o-y) Capital account balance (% of GDP) Net international investment position (% of GDP) Net marketable external debt (% of GDP)1 Gross marketable external debt (% of GDP)1 Export performance vs. advanced countries (% change over 5 years) Export market share, goods and services (y-o-y) Net FDI flows (% of GDP) Savings rate of households (net saving as percentage of net disposable income) Private credit flow (consolidated, % of GDP) Private sector debt, consolidated (% of GDP) of which household debt, consolidated (% of GDP) of which non-financial corporate debt, consolidated (% of 2003-2007 3.6 4.0 5.6 6.3 4.5 7.9 2.7 3.5 2008 1.1 -0.7 5.9 -3.9 -0.8 -5.6 1.4 2.9 2009 -3.6 -3.6 4.1 -16.9 -11.0 -18.3 -3.3 1.1 2010 0.0 0.3 1.5 -4.9 9.4 6.9 -4.3 1.1 2011 -1.0 -2.4 -0.3 -6.9 7.4 -0.8 -5.6 0.4 2012 -2.6 -3.5 -4.5 -7.1 1.1 -6.2 -7.6 -0.5 2013 -1.7 -3.1 -2.8 -2.5 4.3 -0.3 -8.5 -0.7 2014 1.4 1.2 0.0 3.5 5.1 6.4 -7.0 -0.3 2015 3.2 3.1 2.2 6.1 6.0 7.9 -4.1 0.0 forecast 2016 2.8 3.4 0.6 4.6 6.1 7.4 -1.9 0.5 2017 2.5 2.3 0.6 4.8 5.8 6.2 -0.2 0.7 4.8 0.0 -1.2 -0.5 0.1 1.6 -6.2 -0.2 2.8 -0.7 0.3 0.5 -3.0 -0.1 2.1 -4.5 -0.3 2.1 -2.8 -0.2 1.4 1.3 0.2 -0.2 3.5 0.1 -0.4 3.0 0.0 -0.2 2.4 0.0 0.1 1.6 1.7 0.2 0.9 1.5 0.5 -0.3 0.8 0.6 -0.1 0.6 0.5 -0.4 0.4 0.4 -1.0 0.2 0.3 -1.0 0.1 0.2 -0.6 0.2 0.1 -0.4 0.3 0.1 -0.1 0.4 0.2 0.1 0.4 0.2 -7.1 -9.3 -4.3 -3.9 -3.2 -0.2 1.5 1.0 . . . -4.6 0.5 0.7 -57.9* -39.4* 109.3* -5.1 -2.4 0.4 -77.3* -67.3* 135.7* -1.1 5.1 0.3 -91.0* -77.2* 146.8* -1.3 -2.3 0.5 -86.2* -80.0* 142.1* -0.2 -3.7 0.4 -89.3* -84.0* 146.4* 1.5 -1.7 0.5 -90.0 -82.6* 145.6 3.2 1.1 0.7 -96.2 -79.6 138.6 2.5 -1.3 0.4 -95.6 -81.7 145.9 . 2.1 . . . . . 1.2 . . . . . -0.5 . . . . 7.9 -4.6 -1.3 -4.4 -0.2 -8.4 -2.9 -5.43 -0.8 3.2 -4.8 -0.1 2.4 0.2 -9.8 -0.1 -0.6 0.9 -6.0 -2.0 3.6 -1.4 1.4 0.9 . . . . . . . . . 3.1 1.6 7.3 3.7 4.6 2.6 4.2 3.9 . . . 25.2 157.2 69.6 87.6 11.7 195.7 81.9 113.8 -1.2 201.4 84.0 117.4 1.0 200.4 83.5 116.9 -3.8 196.2 81.8 114.4 -11.2 187.3 80.4 106.9 -10.2 176.1 76.7 99.4 -7.3 164.7 72.4 92.3 . . . . . . . . . . . . Corporations, net lending (+) or net borrowing (-) (% of GDP) -4.9 -1.9 4.2 4.7 4.1 8.1 5.0 3.6 3.1 1.8 0.7 Corporations, gross operating surplus (% of GDP) 20.4 23.8 24.9 23.6 23.3 24.1 24.0 24.2 24.2 24.2 24.2 Households, net lending (+) or net borrowing (-) (% of GDP) -2.5 -2.4 2.9 1.3 2.4 2.4 4.2 3.8 3.7 3.6 3.6 Deflated house price index (y-o-y) Residential investment (% of GDP) 10.4 11.3 -4.8 10.4 -5.8 8.1 -3.7 6.9 -9.8 5.7 -16.7 5.2 -10.1 4.5 0.1 4.4 . . . . . . GDP deflator (y-o-y) Harmonised index of consumer prices (HICP, y-o-y) Nominal compensation per employee (y-o-y) Labour productivity (real, person employed, y-o-y) Unit labour costs (ULC, whole economy, y-o-y) Real unit labour costs (y-o-y) Real effective exchange rate (ULC, y-o-y) Real effective exchange rate (HICP, y-o-y) Tax wedge on labour for a single person earning the average wage (%) Taxe wedge on labour for a single person earning 50% of the average wage (%) 3.9 3.2 3.8 -0.1 3.5 -0.4 3.1 2.0 2.1 4.1 6.8 0.9 5.9 3.7 4.4 2.5 0.3 -0.2 4.4 2.9 1.6 1.4 -1.0 0.5 0.2 2.0 1.1 1.8 -1.6 -1.8 -3.9 -3.1 0.0 3.1 0.9 1.7 -0.9 -1.0 -1.1 0.2 0.0 2.4 -0.6 1.5 -2.9 -3.0 -6.6 -2.4 0.6 1.5 1.7 1.3 -0.2 -0.8 0.8 1.9 -0.4 -0.2 -0.6 0.4 -0.8 -0.4 -1.4 -0.4 0.8 -0.6 0.6 . 0.4 -0.3 -3.5 -4.2 1.0 0.1 0.5 . 0.4 -0.6 -0.4 0.5 1.3 1.5 1.0 . 0.6 -0.7 . -0.5 Total Financial Sector Liabilities, non-consolidated (y-o-y) Tier 1 ratio (%)2 Return on equity (%)3 Gross non-performing debt (% of total debt instruments and total loans and advances) (4) Unemployment rate Long-term unemployment rate (% of active population) Youth unemployment rate (% of active population in the same age group) Activity rate (15-64 year-olds) People at-risk poverty or social exclusion (% total population) Persons living in households with very low work intensity (% of total population aged below 60) General government balance (% of GDP) Tax-to-GDP ratio (%) Structural budget balance (% of GDP) General government gross debt (% of GDP) 20.2 19.3 19.8 21.6 21.9 22.9 22.9 23.0 . . . 10.5* 8.0 8.7 9.1 10.4 11.6 11.8 12.0 . . . 15.8 -2.3 4.0 -3.1 0.2 -1.8 -3.8 2.8 . . . . . 8.1 12.7 9.3 9.2 9.6 8.8 10.2 0.2 9.7 -25.6 11.7 6.0 11.7 5.7 . . . . . . . 2.6 3.6 4.1 5.2 6.4 7.9 6.7 . . . 9.7 2.6 11.3 2.0 17.9 4.3 19.9 7.3 21.4 8.9 24.8 11.0 26.1 13.0 24.5 12.9 22.3 . 20.4 . 18.9 . 20.1 24.5 37.7 41.5 46.2 52.9 55.5 53.2 69.9 24.2 72.7 23.8 73.1 24.7 73.5 26.1 73.9 26.7 74.3 27.2 74.3 27.3 74.2 29.2 48.3 . . . . . . . . 6.9 6.6 7.6 10.8 13.4 14.3 15.7 17.1 . . . 1.0 35.7 . 41.9 -4.4 32.9 . 39.4 -11.0 30.6 . 52.7 -9.4 32.1 -7.1 60.1 -9.5 32.0 -6.2 69.5 -10.4 33.0 -3.4 85.4 -6.9 33.8 -1.9 93.7 -5.9 34.4 -1.7 99.3 -4.8 34.5 -2.5 100.7 -3.6 34.5 -2.6 101.2 -2.6 34.7 -2.5 100.1 (1) Sum of portoflio debt instruments, other investment and reserve assets; (2,3) domestic banking groups and stand-alone banks; (4) domestic banking groups and stand alone banks, foreign (EU and non-EU) controlled subsidiaries and foreign (EU and non-EU) controlled branches; (*) Indicates BPM5 and/or ESA95 Source: European Commission, winter forecast 2016; ECB 11 2. IMBALANCES, RISKS AND ADJUSTMENT ISSUES This section provides the in-depth review foreseen under the Macroeconomic Imbalances Procedure (MIP) (4). It focuses on the risks and vulnerabilities flagged in the Alert Mechanism Report 2016. The section analyses the reasons behind. Building on the general overview of macroeconomic developments and challenges provided in Section 1, this section focuses on the key issues in terms of risks of imbalances and needs for adjustment. The combination of large external and internal debt, both public and private, leaves Spain highly vulnerable to adverse shocks or shifts in market sentiment, which can be especially harmful in a context of very high unemployment. This section first analyses the external sustainability and competitiveness of the Spanish economy, including the drivers of exports, imports and the net external debt. Second, overall indebtedness is high. Although private deleveraging in Spain is on track, the overall level of private debt remains elevated, while public debt keeps increasing on account of persistently large deficits. Hence, this section also explores the drivers of debt dynamics in the household and corporate sectors, assesses residual debt reduction needs, looks at the role of the financial sector in helping the deleveraging process and more broadly in supporting the economic recovery, and assesses the evolution of public debt. Third, this section also assesses labour market recent developments and weaknesses, in the light of persistent very high unemployment. This, in spite of recent buoyant job creation, reflects issues linked to the adjustment of macroeconomic imbalances. Finally, it assesses the factors reining in productivity and potential growth. The section concludes with the MIP assessment matrix which summarises the main findings. 2.1. EXTERNAL SUSTAINABILITY AND COMPETITIVENESS Overview The substantial current account adjustment during the crisis was mainly due to the correction of the trade deficit (Graph 2.1.1). The collapse in domestic demand dragged Spanish imports of goods and services, while exports proved quite resilient. Likewise, the deficit of the balance of primary incomes and current transfers also narrowed significantly. final demand, which suggests that the underlying trend towards current account deteriorations during expansions could still prevail. Graph 2.1.1: Adjustment in the current account 8 6 4 2 (4) According to Article 5 of Regulation (EU) No. 1176/2011. % of GDP 0 Despite the recovery of domestic demand, the current account is expected to remain in surplus over the medium term, largely due to low oil prices. In 2014, the current account surplus narrowed to 1.0% of GDP as a result of the recovery in final demand, but also due to the sizeable impact of existing car-scrapping schemes on imports. However, the current account surplus is expected to have widened to some 1.5% of GDP in 2015. Looking ahead, the projected current account surpluses until 2017 are expected to be underpinned by the depreciation of the euro and especially by the fall in oil prices. The shrinking of the non-energy surplus by more than EUR 10 billion between January and November 2015 with respect to the same period in 2014 reveals that imports keep reacting strongly to the pick-up in -2 -4 -6 -8 -10 -12 -14 98' 99' 00' 01' 02' 03' 04' 05' 06' 07' 08 09 10 11 12 13 14 15* Capital account (KA) Secondary income balance Primary income balance Trade balance - services Trade balance - goods Trade balance Current account balance (CA) Net lending/borrowing (CA+KA) Source: European Commission Spain's large external liabilities leave the country highly exposed to adverse shocks or shifts in market confidence. The net international investment position (NIIP) (the difference between total assets held by Spanish residents and liabilities with foreign agents) deteriorated sharply until 12 2.1. External sustainability and competitiveness 2013 (Graph 2.1.2) to more than 95% of GDP. Further deteriorations were observed in 2014 and the first quarter of 2015 as a result of valuation effects, which also reflected an improvement in investor confidence and increasing domestic asset prices. Negative or low nominal growth in 2013 and 2014 did not help, although its contribution is now turning positive. With such a large negative NIIP, most of which consists of marketable debt instruments, Spain remains vulnerable to volatility in international financial markets, in spite of the healthier situation of the Spanish financial sector. its main Graph 2.1.3: Changes in share of exports of goods in EU economies (values) % 1.5 1 0.5 0 -0.5 Graph 2.1.2: Net international investment position and current account balance -1 % of GDP 2 20 0 0 -2 -20 -4 -40 -6 -60 -8 -80 -10 -100 -1.5 -2 -2.5 BE BG CZ DK DE EE IE EL ES FR HR IT CY LV LT LU HU MT NL AT PL PT RO SI SK FI SE UK % of GDP labour cost differentials vis-à-vis competitors between 2001 and 2007. 2000-2007 2007-2015* 2000-2015* (1) Total exports of goods of every country divided by total world exports. (2) World exports of goods in values are assumed to grow by 8.5% in 2015. Source: European Commission winter 2016 forecast Graph 2.1.4: Spanish exports by geographical destination 98 99 00 01 02 03 04 05 06 07 08 09 10 11 12 13 14 Current Account Balance (CA) (LHS) 2000=100 350 Net Int'l investment position (NIIP) (RHS) Source: Instituto Nacional de Estadística (INE) and Banco de España 300 250 Drivers of exports Increasing geographical diversification of Spanish exports may have contributed to compensating for the impact of accumulated losses in competitiveness in the run-up to the crisis. In contrast to the main EU economies, Spain’s market share of exports of goods in value terms held up well over that period (Graph 2.1.3). While European markets, accounting for some 70% of total Spanish exports of goods, remained by far the main destination for exports of goods, Spain benefited from remarkable dynamism in its exports to non-EU countries, especially to the emerging and growth-leading economies. This helped offset price competitiveness losses stemming from nominal effective exchange rate appreciation and persistent inflation and unit 13 200 150 100 50 00 01 02 03 04 05 06 07 08 09 10 11 12 13 14 Euro area EU non-euro Emerging and growth-leading economies Others Source: DataComex Growth in world trade and greater geographical diversification sustained exports during the crisis. Spanish exports of goods benefited from improvements in price/cost competitiveness as Spanish exports have a 2.1. External sustainability and competitiveness relatively high sensitivity to price developments. However, growth in global demand and increasing geographical specialisation (Graph 2.1.4) have been more relevant to explain export performance.(5) The fact that Spain's main trading partners, mostly EU countries, were hit hardest by the crisis brought about a reduction in the market share of Spanish exports. This effect was however offset in part by the high growth registered in other non-EU trade partners and the increased penetration of those markets (Graph 2.1.5) over most of the 2008-2013 period. The share of exports to the euro area declined by some seven percentage points between 2007 and 2014 (to 50% of total exports of goods) and exports to other EU economies did so by around half a point (to some 12%), while other destinations gained prominence. As a result, Spain's market share of goods exports declined only slightly. Tourism led the decline in Spain's world market share of exports of services, whereas the market share in other services with higher value added expanded. Spain has a large tourism sector but its world market share has been decreasing over the last decade as it relies mainly on coastal seasonal tourism that is subject to increasing competition. However, the opposite has been observed in other services — mainly services to businesses — typically characterised by higher value added (Graph 2.1.6). The most dynamic subsectors were software publishing, computer programming, consultancy and related activities, engineering activities and related technical consultancy. Significant penetration in foreign markets also occurred in accounting, bookkeeping and auditing activities, tax consultancy and management consultancy activities. Exports of these types of services were mainly directed to North America and to the UK. 5 ( ) Crespo Rodríguez, A., Pérez-Quirós, G. and Segura Cayuela R., Competitiveness Indicators: The Importance of an Efficient Allocation of Resources, Banco de España, Economic Bulletin, January, pp. 103-111, (2012) show that while Spanish exports of goods have a relatively high (negative) long-term relative price elasticity, the real exchange rate typically explains well below 10% of the variance in exports, as opposed to world trade, which explains about 80%. Graph 2.1.5: Breakdown of export market share changes (in values) of Spanish exports of goods 8% 6% 4% 2% 0% -2% -4% -6% -8% -10% -12% -14% 2008 2009 2010 2011 2012 2013 2014 Market share gain - extra EU Market share gain - intra EU Initial specialisation - extra EU Initial specialisation - intra EU Total market share change (1) Shaded bars represent gains or losses stemming from the exposure to a certain market. Solid bars measure the performance within a certain market. Source: COMTRADE and European Commission Large firms are key to explaining export performance, but the small average size of Spanish firms reins in their export capacity. (6) Large firms enjoy better conditions to penetrate foreign markets and typically export a higher proportion of their production than smaller firms (Graph 2.1.7). More than 85 % of total Spanish exports were undertaken by the largest 5 000 companies (around 3 % of total exporting companies) in 2014. Moreover, unit labour cost developments in the largest firms tend to be more favourable than on aggregate due to higher productivity growth, including in the run-up to the crisis, which implies that effective cost competitiveness losses have been far more muted.(7) (6) Altomonte, C., Barba Navaretti, G., di Mauro F. and Ottaviano, G., Assessing competitiveness: how firm-level data can help, Bruegel Policy Contribution, No 16, (2011); Correa Lopez, M. and Doménech R., The Internationalisation of Spanish Firms, BBVA Working Papers, No 12/30, (2012). (7) Country Report – Spain, European Commission, (2015). Section 3.1 also assesses the differences between large firms and SMEs in terms innovation processes and productivity developments. 14 2.1. External sustainability and competitiveness Graph 2.1.6: World market shares of Spanish exports of services Graph 2.1.8: Structure of Spanish exports of goods 30 % Travel 20 Transportation 10 Other services 0 2000 Total services 0.0 2012-2013 2.0 4.0 6.0 8.0 2000-2001 Source: DataComex (1) Total Spanish exports of services divided by total world exports of services by type Source: WTO and European Commission calculations Graph 2.1.7: Share of exports by enterprise size (number of employees. Industry) 0-9 10-49 2007 2014 Food products Energy products Intermediate goods Equipment Motor vehicles Durable consumption goods Raw materials Manufactured consumption goods Other 50-249 250+ 100 90 80 70 60 50 40 30 Export resilience is also due to the rise in the number of exporting firms. The number of exporting firms rose by some 50 % between 2007 and 2014 and has more than doubled since 2000, including regular exporters (those that have exported for at least four consecutive years) that amount to around 30% of the total (8). Despite the slight decline observed in 2014, data until August 2015 show that the number of exporting firms is on the rise again, especially the smallest ones. This factor can be deemed to be a structural improvement, especially in view of the fixed costs firms have to incur in order to enter foreign markets. 20 0 Mexico United States Germany Canada Slovak Republic Hungary Sweden Finland United Kingdom Poland Romania Czech Republic Bulgaria Belgium France Greece Lithuania Denmark Croatia Austria Slovenia Spain Turkey Netherlands Portugal Italy Estonia Ireland Latvia 10 Source: OECD Entrepreneurship at a Glance 2015 Spain is specialised in exports of labourintensive products and in goods with a mediumhigh technological content. Specialisation in exports from labour-intensive industries implies that Spanish exports are very sensitive to relative price developments. This is consistent with the aforementioned high price elasticity of exports. Apart from the large share of food and primary products, Spanish exports of goods are mainly concentrated on intermediate goods, especially chemical products (around 14 % of total exports), equipment goods (of which transport equipment amounts to some 5 % of total exports), and motor vehicles (Graph 2.1.8). Motor vehicles and (8) These data have been taken from the Instituto de Comercio Exterior (ICEX). 15 2.1. External sustainability and competitiveness transport equipment together account for around 20 % of total exports. These typically involve medium to medium-high technological content (Graph 2.1.9). However, when compared to other EU countries, Spain ranks relatively low with regard to the proportion of exports of high and medium-high technology goods (Graph 2.1.10). Graph 2.1.9: Breakdown of Spanish exports by technological content productive — in foreign markets during the crisis, and may conceal improvements in overall quality. By penetrating foreign markets small firms might have been forced to adjust their mark-ups to face higher competition and might have conditioned the overall metric of quality. This pattern of quality distribution resembles somewhat those of other EU catching-up economies. This pattern of specialisation shows the relevance of cost and wage moderation as well as productivity improvements in sustaining export growth. % Graph 2.1.10: Exports of medium-high and high technology goods in the EU in 2014 50 45 40 35 % total exports 90 30 80 25 70 20 60 15 50 10 40 5 30 0 20 Medium-high tech 2005 Medium-low tech 2014 Low tech Source: OECD Stan database The quality of Spanish exports ranks low compared to other advanced economies.(9) Despite their technological content, Spain is specialised in exports of medium-low quality goods (Graph 2.1.11), which is also consistent with the high price elasticity estimated for Spanish exports. Furthermore, the average quality of Spanish exports decreased in relative terms between 2007 and 2014. Such a decline in average quality was especially noteworthy in top-quality products since 2009, in which Spain already ranked poorly (Graph 2.1.12). However, as markups are used as proxies for quality, this reduction in average quality is likely to reflect, at least in part, a composition effect linked to the increasing presence of small Spanish firms — typically less 10 0 Ireland Hungary Germany Czech Republic Slovakia France UK Slovenia Belgium Austria Sweden Netherlands Denmark Spain Romania Italy Poland Estonia Finland Malta Lithuania Croatia Bulgaria Portugal Latvia Luxembourg Greece High tech Source: OECD Stan database (9) Vandenbussche, H., Quality in Exports, European Economy, Economic Papers, No 528, (2014). Quality is proxied by mark-ups and it is based on the assumption that high quality raises the willingness to pay. This metric of quality also captures other characteristics such as product differentiation and innovation and allows firms to escape better cost competition. 16 2.1. External sustainability and competitiveness Graph 2.1.11: Density function of export values per quality rank 2.0 1.8 1.6 1.4 1.2 1.0 0.8 0.6 0.4 economies. (10) This can also be explained by the fact that Spain shows by far the highest stock of foreign direct investment relative to GDP amongst large euro area economies (almost 55% of GDP in 2014). The bulk of foreign direct investment inflows stems from large international companies and multinationals that typically decentralise different steps of their production chains in order to maximize comparative advantages. In particular, automotive and chemical industries, the main export industries in Spain and clearly net recipients of foreign direct investment flows, have very high import content (63.3 % and 54.8 % respectively), mostly intermediate goods. 0.2 0.0 Graph 2.1.12: Shares of top-quality exports by country (value) 2007 2014 (1) Quality is proxied by mark-ups in a way that higher mark-ups are typically associated with higher perceived quality, according to the methodology presented in Vandenbussche (2014) Source: European Commission calculation based on COMEXT (EUROSTAT) and ORBIS data. 0.7 0.6 0.5 0.4 0.3 0.2 Drivers of imports 0.1 Spanish industry shows a considerable import content, due in part to large inflows of foreign direct investment. In general, import intensity in manufacturing sectors is around 20 % higher in Spain than in the other main euro area 17 2009 JP CN US ES PL SK EL HU DE BE LT BG PT RO CZ SI IT EE HR LV AT UK FI NL FR SE LU DK MT CY IE 0.0 Spanish imports are relatively inelastic to relative price developments. The low price elasticity of imports is consistent with the economy’s high dependency on imports of intermediate goods and the structurally elevated dependence on energy products, especially when compared with the main EU economies (Graph 2.1.13), in particular oil and gas as sources of primary energy. Although energy dependence in Spain dwindled by 11 pps since its peak in 2005, to 70.5% of total energy consumption in 2013, the decline was mostly related to the destruction of the economic fabric during the crisis. Likewise, the import content of Spanish exports is especially high in medium-high technology industries (Graph 2.1.14). Goods embedding a medium-high or high technological content are typically characterised by high income and low price elasticities. 2014 (1) Quality is proxied by mark-ups Source: European Commission calculations based on Comext and ORBIS data Moderate cost developments, faster productivity growth and rebalancing towards higher value added sectors could help moderate import growth. Increasing competitiveness of Spanish firms, including in domestic markets, could help moderate the responsiveness of imports to final demand growth. Moreover, the currently moderate labour cost dynamics could also support some import substitution in sectors more sensitive to relative price developments, notably consumer goods, but its potential is however small in the medium term. (10) OECD, Trade in Value Added (TiVA). 2.1. External sustainability and competitiveness Graph 2.1.13: Energy dependence by country (2013) % 120 100 80 60 effect has more than offset the higher outflows linked to returns on Spanish equity assets held by foreign investors and entailed a reduction in the deficit of primary incomes. In the medium term the currently low interest rates will continue to reduce the financial burden of new issues further, including that of public debt instruments. In spite of this effect, the balance of primary incomes is expected to remain in deficit due to the very large stock of net external liabilities. 40 0 Malta Luxembourg Cyprus Ireland Lithuania Belgium Italy Portugal Spain Germany Austria Greece Euro area Slovakia Latvia Croatia Hungary Finland France Slovenia United Kingdom Bulgaria Sweden Czech Republic Netherlands Poland Romania Denmark Estonia 20 (1) Net imports of energy divided by the sum of gross inland energy consumption plus bunkers (consumption in aviation and waterways) Source: European Commission (Eurostat) Graph 2.1.14: Import content of exports of medium-high and high technology products (mid-2000s) % 50 45 40 35 30 25 20 15 10 5 0 PT LU BE ES NL AT FI DK FR IT SE IE EL UK DE Source: OECD Stan database Balance of primary incomes and current transfers The balance of primary incomes is expected to remain negative due to the large net external liabilities. The decline in risk premia on Spanish liabilities since 2013 has significantly eased the cost of debt servicing, thereby decreasing its negative contribution to the income balance. This Net transfers are expected to remain negative. This is mainly the consequence of government contributions to development aid funds and of immigrant workers' remittances. The latter could potentially increase in the medium term due to improved conditions in the labour market. Moreover, current transfers could also deteriorate as a result of lower net receipts from the EU budget as of 2014. Cyclically adjusted current medium-term prospects account and While the cyclically adjusted current account balance is, for the first time, estimated to be in surplus, it remains below the headline current account balance. This indicates that the improvement of the current account is in part due to cyclical conditions. Insofar as potential output fell during the crisis, part of the corresponding decline in imports can also be considered as structural. Moreover, exports have enjoyed a structural improvement due to the aforementioned factors. Yet, according to the Commission winter 2016 economic forecast the output gap remains very large, at -4.1 % of potential GDP in 2015, although narrowing rapidly as a consequence of high growth of domestic demand. Based on these estimates, the cyclically adjusted current account balance would have registered a surplus of 0.3 % of GDP in 2015, compared with the envisaged headline surplus of 1.5% of GDP (Graph 2.1.15). As the output gap is forecast to narrow faster than the headline current account surplus, the cyclically adjusted current account surplus is expected to increase further in 2016, to 1.0% of GDP, also closing the gap with the headline current account balance. The expected increase in domestic demand could lead to a deterioration of the current account balance. Despite the positive forecast 18 2.1. External sustainability and competitiveness effects’ on Graph 2.1.16) and by the now favourable contribution from nominal growth, as opposed to previous years. Graph 2.1.16: Contribution to changes in the NIIP 15 10 Change in pp. of GDP (y-o-y) until 2017, current account balances in the medium term could be compromised by the increase in imports due to their high final demand elasticity. As a matter of fact, a sizeable share of the current headline surplus is due to the fall in oil prices that brought down the energy bill. However, recent customs data reveal that the non-energy trade surplus is narrowing rapidly, by some EUR 10 billion (around 1 pp. of GDP) between January and November 2015 compared to the same period in 2014, as a consequence of the remarkable dynamism of non-energy imports. Current account surpluses in the long term would call for a combination of high growth rates of Spanish export markets and a lower demand elasticity of Spanish imports than has historically been the case. 5 0 -5 -10 -15 -20 Graph 2.1.15: Cyclically-adjusted current account balance 01 02 03 04 05 06 07 08 09 10 11 12 13 14 15 Valuation changes Net transaction effect (rest FA bal.) Investment income effect Nominal growth effect Change in NIIP (y-o-y) 4 2 Source: European Commission % of GDP 0 -2 -4 -6 -8 -10 -12 00 02 04 06 08 10 12 14 Current account as % of GDP Cyclically adjusted CA as % of GDP 16 Source: European Commission winter 2016 economic forecast Structure and prospects for international investment position the net Spain’s net external liabilities remain very high. Spain's negative net international investment position (NIIP) has improved only recently to 92.5% of GDP in the second quarter of 2015. The deterioration observed since 2013 is however not due to new flows, but rather can be explained by negative valuation effects, mainly rising prices of domestic assets held by foreigners. These valuation effects have been partly offset by a positive net lending position of the economy vis-àvis the rest of the world (see ‘Net Transaction 19 The main concern regarding net external liabilities is related to the very high level of net marketable debt, which increases the vulnerability to external shocks. Equity instruments (FDI/portfolio equity) do not imply the same risks as debt for external sustainability in that dividend payments can be adjusted during economic downturns, thus precluding the possibility of a default. By contrast, servicing costs related to outstanding fixed-income instruments are insensitive to the cycle. The lion's share of the negative NIIP is made up of net ‘marketable debt’. It amounts to some 80 % of GDP, of which some 60 % of GDP is accounted for by net debt (portfolio debt and other investment of the private and government sectors) and somewhat less than 20 % of GDP of TARGET2 liabilities that will need eventually to be refinanced by the financial sector. Although much of the debt has a long-term maturity and does not pose an immediate risk in terms of liquidity, it may pose a risk in terms of sustainability. Negative valuation effects reflected in a decrease of the NIIP do not have the same implications when they concern assets or liabilities. Negative valuation effects on foreign assets held domestically, as was the case for Spain between 2001 and 2012, may lead to substantial welfare losses through reduced differed 2.1. External sustainability and competitiveness Table 2.1.1: Current account and net international investment position scenarios Low nominal GDP growth (2% avge. 2016-25) -2.2 Baseline scenario (3,6% avge. 2016-25) -3.6 High nominal GDP growth (5% avge. 2016-25) -4.8 NIIP at -75% of GDP -0.3 -1.5 -2.7 NIIP at -50% of GDP 2.5 1.4 0.4 NIIP at -25% of GDP 5.2 4.3 3.5 NIIP Stabilisation (1) The table shows the current account needed to achieve different NIIP values by 2025, based on several nominal growth scenarios. (2) NIIP (national accounts concept) stabilisation implies a NIIP level of 92.7% of GDP in 2025 (the same as in 2015). (3) Simulations take into account neither REER nor valuation effects. (4) The current account surplus in 2015 is assumed to be at 1.4% of GDP, while the cyclically adjusted current account is gauged at 0.3% of GDP. The capital account is assumed to remain at 0.4% of GDP on average until 2025. Source: European Commission consumption and to liquidity stress with negative implication for financial stability. Conversely, an increase in the price of domestic liabilities, as was the case in 2013, may reflect an increase in the demand for domestic liabilities from abroad due to enhanced confidence. Hence, an increase in net external liabilities due to valuation effects affecting debt instruments issued by Spanish agents do not increase external sustainability risks. The reduction of net external liabilities is driven mainly by FDI flows and other investment (mainly loans, repos and deposits). Balance of payments data show foreign direct investment (FDI) abroad outweighing inflows between January and November 2015. An increase in assets jointly with a reduction of liabilities was observed in the reading of other investment over the same period. By instrument, net outflows on equity investment by almost 6 pps of GDP have been registered between the second quarters of 2014 and 2015. Long-term net portfolio debt has also declined over the same period by around 2.5 pps. of GDP as a result of the reduction in foreign liabilities, together with rising assets abroad. By contrast, the improvement in long-term portfolio debt instruments has been more than offset by the deterioration in short-term net portfolio debt and other instruments derived from increased liabilities by monetary financial institutions and TARGET2 instruments. A sufficiently rapid reduction of Spain's net external liabilities would call for high current account surpluses over a protracted period of time. According to Commission's estimates a 3.6% current account deficit would suffice to stabilise Spain's negative NIIP. A favourable combination of high current account surpluses and high nominal growth rates would however be required to halve the negative NIIP in the next ten years (Table 2.1.1). Both scenarios are far from granted, especially the former. External rebalancing Some rebalancing towards tradable sectors has taken place since the outbreak of the crisis. In the run-up to the crisis Spanish growth relied excessively on the production of non-traded goods, especially construction and real estate activities, with small contributions to overall productivity growth. This pattern implied an inefficient allocation of resources that precluded labour and capital from flowing into activities with a higher value added and also hampered a more dynamic export performance. The outbreak of the crisis brought about a passive rebalancing, mainly through the more sizeable collapse of the construction and financial services sectors than the contraction of the tradable sectors. However, since the start of the recovery from the second quarter of 2013 onwards, value added and productivity have been more dynamic in tradable sectors (Graph 2.1.17) and in professional, scientific and technical support activities, which despite being traditionally considered as non-tradable also export a significant share of their output (8.2% in 2010) according to the input-output tables. The contraction in economic activity has been more severe in terms of employment than in terms of gross value added for both tradable and non-tradable sectors since the outbreak of the crisis. This was particularly the case during the crisis period (namely between 2008 and the first 20 2.1. External sustainability and competitiveness half of 2013), leading to substantial increases in productivity in both sectors. Since the start of the recovery in mid-2013 the expansion of employment in the tradable sector has been slower than in non-tradable sectors, thereby leading to higher productivity increases in the former and a faster decrease in nominal unit labour costs (ULC) (Graph 2.1.18). Nevertheless, it is still premature to draw any clear cut implications for the medium term, as the economy is at an early stage of the recovery. Graph 2.1.17: Evolution of the share of tradable sectors in gross value added and employment Graph 2.1.18: Unit labour costs in Spain (year-on-year changes) 8 % 6 4 2 0 -2 -4 -6 -8 -10 01 02 03 04 05 06 07 08 09 10 11 12 13 14 15 % total 56 54 Tradables 52 Non-tradables Source: INE and European Commission 50 48 Future challenges 46 44 42 40 00 01 02 03 04 05 06 07 08 09 10 11 12 13 14 Share of tradable in GVA Share of tradable in employment (f.t.e.) (1) Sectors considered as tradable are agriculture; industry (excluding construction); trade, transport, food and accommodation and; information and communication. (2) Sectors considered as non-tradable are construction; financial and insurance activities; real estate; professional, scientific, technical and support activities; artistic, leisure, and household repair services and; non-market services, including public administration, defence, social security, education, health and social services. Source: European Commission and INE The reallocation of resources towards tradable sectors can support external rebalancing. Decreases in ULCs in tradable sectors, especially via productivity gains, can be expected to underpin export performance and external rebalancing, thereby paving the way for a more sustained growth model. 21 Exports seem insufficient to guarantee the current account surpluses needed to decisively reduce Spain's net external liabilities. According to the Commission 2016 winter forecast, exports are set to remain strong. They would be based on further geographical diversification and some rebalancing of economic activity towards tradable sectors. Moreover, recent data show that the number of exporting companies is on the rise. Despite this, imports keep reacting strongly to expansions in final demand. Hence, the large external indebtedness remains a source of vulnerability. Deepening of export base, the quality thereof and faster productivity growth would underpin further non-cost competitiveness gains and contribute to the external rebalancing by improving future current account balances. The external adjustment would mainly benefit from higher productivity and ongoing moderate labour cost dynamics. In particular, the currently moderate labour cost dynamics in the current setting of very low or even negative inflation, allows preserving price/cost competitiveness gains alongside increases in real disposable incomes. Safeguarding cost competitiveness is key in that Spain is specialised in market segments where price competition is determinant. Faster productivity growth accompanied by moderate 2.1. External sustainability and competitiveness production costs could also allow for some import substitution. Moreover, promoting innovation and enhancing R&D further would pave the way for moving towards higher quality segments along with increasing the technological content of Spanish manufacturing, for which improving labour skills is essential. This could downplay the relevance of cost competitiveness. Furthermore, removing legal and economic barriers to company growth along with promoting more active penetration of foreign markets is essential to enhancing Spain’s export capacity, both in terms of volumes and unit values. Finally, policies aimed at replacing debt with foreign direct investment would contribute to reducing the vulnerabilities associated with the large negative NIIP. 22 2.2. EURO AREA SPILLOVERS Spain is the fourth largest economy in the euro area, accounting for some 10 % of its overall GDP. This implies that Spain is an important source of economic and financial spillovers for the rest of the euro area, mainly in the areas of trade, financial markets and banking. would entail capital losses to the Spanish investors holding them. Spanish agents hold the equivalent of around 8% of GDP of French and Dutch assets, respectively. Exposure to Italy and Luxembourg, at 6 % in both cases, and to Germany and Portugal, at some 5 % each of Spanish GDP, is also sizeable. Inward spillovers Spanish financial exposure to non-euro area countries, and consequently to exchange rate movements, is significant. The largest exposures to financial assets that are not denominated in euros are with the UK (17% of Spanish GDP) and the United States (about 8% of Spanish GDP each). The financial exposure to Latin American countries is also significant, with Mexico, Chile, Argentina, and Brazil accounting together for almost 12% of GDP. This exposes Spain to exchange risk. Graph 2.2.1: Spanish exports by destination to EU countries(2013) 5.0 4.5 % of Spain GDP 4.0 Graph 2.2.2: Foreign claims of Spanish banks on EU countries, by sector 35 30 25 % of ES GDP European markets, and in particular the euro area, remain the main destinations for Spanish exports. The EU absorbs more than 60 % of goods exports, or 11 % of Spanish GDP. Specifically, the largest markets for Spanish exports of goods and services are France, accounting for more than 4.5% of Spanish GDP, followed by Germany (with around 3.5%), Italy and Portugal (around 2 % of GDP in each case) (Graph 2.2.1). These countries mostly import Spanish goods, although France and Germany also import services, mainly tourism, worth around 1 % of Spanish GDP. Exports of services to the Netherlands and Belgium are also noteworthy. Outside the euro area the main export market is the United Kingdom, importing around 3.5 % of Spanish GDP, mainly of services. 20 15 10 5 3.5 0 3.0 2.5 2.0 1.5 Banks 1.0 Official sector Non-bank private sector All sectors Source: BIS consolidated banking statistics (ultimate risk basis, 2015Q2), IMF, own calculations. 0.5 0.0 Goods Services Source: European Commission calculations based on Unitted Nations. The financial exposure of Spain to the euro area amounts to almost 50 % of Spanish GDP. This is broadly evenly distributed between equity and non-official debt instruments. Financial market volatility affecting the prices of foreign assets 23 Spanish banks' euro area claims concentrate on Portugal, Germany, Italy and France. These claims are highest on Portugal, at some 4 % of Spanish GDP, followed by Germany, Italy and France, at some 3 % each (Graph 2.2.2). In the cases of Portugal and Germany, claims of Spanish banks are mainly on the non-bank private sector, whereas in the case of Italy the lion's share is represented by public debt instruments. Bank exposure to the other euro area economies is very limited. 2.2. Euro area spillovers However, foreign claims of Spanish banks are larger in non-euro area countries. According to BIS data, the Spanish banking sector is highly exposed to the UK, with claims worth approximately 30 % of Spanish GDP, mostly concentrated on the non-bank private sector. Banking sector exposure to the USA, Brazil and Mexico is also high. Portuguese and Maltese GDP, respectively (Graph 2.2.4). Specifically, banking sector exposure of EU countries to the Spanish economy is largest for Portugal, at close to 10 % of Portuguese GDP, and to a lesser extent the Netherlands and France. Graph 2.2.4: Spanish foreign liabilities by trade partner 40 Outward spillovers 35 Graph 2.2.3: Spanish imports by country of origin 25 20 15 10 5 0 Equity Debt (excluding official) Source: European Commission calculations based on Hobza and Zeugner (2014): Current accounts and financial flows in the euro area, Journal of International Money and Finance, 48, pp 291-313. As for foreign direct and portfolio investment, Spain’s debt and equity claims amount to some 30 % of Portuguese GDP and around 25 % of Irish GDP, respectively. In former case, around half of them corresponds to equity, whereas in the latter most of these positions are held in the form of equity. Foreign investment is also sizeable in the Netherlands, Hungary, Malta and the UK, where it amounts to almost 15 % of each partner’s GDP in the former two cases and to almost 10 % in the latter two. Except in the case of the UK, the largest shares correspond to equity. 8.0 7.0 % of trading partner GDP 30 % of counterpart GDP Spain shows up as a significant source of trade spillovers mainly for Portugal. Exports of goods and services to Spain represent almost 7 % of Portuguese GDP (with exports of goods representing more than 5 %) and 3 % of its value added. Spain is also a large source of outward trade spillovers for Luxembourg, Ireland and Malta stemming from the large share of exports of services from these countries to Spain (Graph 2.2.3). While imports from France, Germany, Italy or the UK represent a sizeable share of total Spanish imports, the importance of the outward spillovers derived from them is more contained when compared with the GDP of the country of origin. 6.0 5.0 4.0 3.0 2.0 1.0 0.0 Goods Services Source: European Commission calculations based on United Nations. Gross financial exposures to Spain are highest in Ireland, the Netherlands, Malta and Portugal. Spanish overall financial liabilities amount to more than 35 % of Irish GDP, to almost 30 % of Dutch GDP and to some 20 % of the A decline in confidence in the Spanish economy would have non-negligible effects on euro area growth. In order to illustrate the magnitude of outward trade spillovers a negative confidence shock has been simulated in QUEST (Graph 2.2.5). Specifically, loss of confidence in the Spanish economy, derived for instance from excessive leverage or doubts about external sustainability, could be modelled by an increase in the Spanish risk premium (i.e. a temporary, but persistent increase in investment risk/financing 24 2.2. Euro area spillovers costs). The size of the shock is adjusted so that it leads to a decline in Spanish domestic demand by 1 %. Private investment, consumption and consequently imports would decline in response to such increase, thereby leading to an improvement of the Spanish trade balance. Under these conditions, euro area GDP would fall by 0.2 % on impact and by around 0.3 % one year after the shock as a result of lower Spanish imports. This would mainly affect France, Germany, Italy, the Netherlands and Portugal. Moreover, Spanish production costs would go up as a result of lower investment demand, that would also entail negative supply-side effects in the medium and longer term, and higher tax rates (needed to balance the public budget). Graph 2.2.5: Responses of GDP to an increase in the Spanish risk premium % deviation from baseline 0.2 0 -0.2 -0.4 -0.6 -0.8 -1 -1.2 -1.4 -1.6 -1.8 1 2 3 4 5 6 7 8 9 Year Spain Rest of the euro area Rest of the World (1) The simulations have been generated with the European Commission Quest model. (2) The shock to the risk premium is calibrated so that it leads to a decline in Spanish domestic demand by 1%. Source: European Commission 25 10 2.3. INDEBTEDNESS AND DELEVERAGING Overall indebtedness of the Spanish economy remains high. As a mirror image of the large net external liabilities, a high level of debt in the private (households, non-financial corporations) and public sector of the economy is a macroeconomic imbalance to the extent that the associated financial burden constrains domestic demand and increases vulnerability to interest rate shocks. In the wake of the crisis, the overall debtto-GDP ratio of the Spanish economy significantly increased and, since then, its composition has been shifting from the private sector to the public sector (Graph 2.3.1). investment. The collapse in domestic demand dragged down the tax bases, while soaring unemployment entailed an increase in social transfers. Furthermore, the state supported the recapitalisation of the banking sector. As a result, the debt ratio increased by around 64 percentage points of GDP between 2007 and 2014 (Graph 2.3.1). Under normal economic conditions and with no change of fiscal policy after the last Commission forecast year (2017), Spanish general government debt would remain at around 100% of GDP until 2020 and only fall to around 92% in 2026 (last projection year). The household and corporate sectors are reducing their debt burden. The progressive amortisation of the credit stock has been the main driver of private sector deleveraging since 2011, with debt write-offs having also played a role. Still, leverage remains high in historical terms, making households and firms more vulnerable to potential adverse shocks, even though the current low interest rates reduce their financial burden. New credit has started flowing again, with the financial sector ready to fund healthier corporations with positive growth prospects, especially outside the construction and real estate sectors. Looking forward, the deleveraging process is expected to be driven mainly by growth. Private sector deleveraging was accompanied by restructuring in the banking sector. The implosion of the real estate bubble caused a sharp deterioration in banks’ asset portfolios. Systemic concerns about the banking sector and the capacity of the sovereign to support it heightened in the summer of 2012. The ensuing financial assistance programme for the banking sector, which was successfully closed in January 2014, was the basis for cleaning up banks’ balance sheets. Banks restructured their activity and the quality of their assets has increased, as shown by a declining — though still high — non-performing loans ratio. Bank profitability has been rising since 2013, and new lending has started to flow again to the real economy. The implementation of the savings bank reform is well advanced. Graph 2.3.1: Breakdown of debt in Spain by sector, quarterly non-consolidated Drivers of indebtedness and deleveraging in the household sector 400 350 300 % of GDP 250 200 150 100 50 14q3 15q3' 13q3 12q3 11q3 10q3 09q3 08q3 07q3 06q3 05q3 04q3 03q3 0 Financial corporations Government Household Non financial corporations Private non-financial sector Source: European Commission, Eurostat General government debt has been on an increasing trend since 2008. In the wake of the crisis, the private sector in Spain moved in a short period from a net borrowing to a net lending position by squeezing consumption and Real GDP growth is becoming the main driver of deleveraging of household debt. As the household sector moved from a net borrowing to net lending position, it actively reduced its high debt (through negative net credit flows), from 84.7 % of GDP in the second quarter of 2010 to 68.6 % in the third quarter of 2015. Still, in the second quarter of 2015, household debt in Spain remained on average at least 10 percentage points of GDP higher than in the euro area. An analysis of debt sustainability estimates the deleveraging needs in the household sector to reach equilibrium level at between 10 and 20 pps.(11) The (11) Deleveraging needs to reach equilibrium level are defined as the portion of private debt that is, at a given date, considered unsustainable. Estimations are based on 26 2.3. Indebtedness and deleveraging equilibrium level has, nevertheless, increased due to the fall in interest rates. The household deleveraging process has been more gradual than for the corporate sector, as the majority of household loans are long-term housing mortgage loans, which are written off by banks less often than corporate loans. Furthermore, nominal income growth has been very subdued and GDP growth was hampering household deleveraging in 2012-2013 (Graph 2.3.2). Looking forward, with the economic recovery going further, the deleveraging is likely to be driven mainly by GDP growth. The flow of new loans to households has been dynamic recently (Graph 2.3.3). income in 2015), and are particularly sensitive to a potential interest rate shock. It is estimated that a 300 basis points increase in the interest rate would increase the median debt-service-to-income ratio of indebted Spanish households from around 25 % to 30 %, and more than 1/3 of indebted households would face a ratio greater than 40 %.(12) Graph 2.3.3: New loans to households in Spain y-o-y% 100 80 60 Graph 2.3.2: Breakdown of year-on-year changes in debtto-GDP ratio for households in Spain 40 20 15 0 -20 10 y-o-y change -40 5 -60 05 06 07 08 09 10 Housing loans to HHs 11 12 13 14 15 Consumer loans to HHs 0 Source: European Commission, BdE -5 -10 06Q1 07Q1 08Q1 09Q1 10Q1 11Q1 12Q1 13Q1 14Q1015Q1 Credit flow Real growth Inflation Other changes D/GDP, change (1) ESA 2010 Source: Source: Eurostat Indebted Spanish households are among the most sensitive in the euro area to a potential interest rate shock. In the current low interest rate environment, the adjustable rate loans prevailing in the Spanish mortgage market accelerated the reduction of the financial burden borne by households. Nevertheless, households in Spain have one of the highest debt-to-income ratios in the euro area (at 110.3 % of gross disposable sustainability analysis benchmark, which is corrected for asset price booms, and on historical norms reflecting past deleveraging episodes. For the methodology, see European Commission: 'Private Sector Deleveraging: Outlook and Implication for the Forecast', in European Economic Forecast - Autumn 2014, European Economy 2014. 27 A new personal insolvency framework was introduced in 2015. Legislation adopted in 2015(13) set provisions for full debt relief for individuals and extended the number of beneficiaries entitled to mortgage debt restructuring. Insolvent debtors who have acted in good faith, and whose assets have been liquidated, or are insufficient to cover liabilities, could be granted debt relief by a judge under an insolvency procedure. There are some constraints to relieving the burden on heavily indebted families and businesses, as for instance discharge does not include public liabilities. Discharge is immediate but provisional, so as to avoid moral hazard, it can be revoked during the five year repayment plan in case of windfall gains or bad faith. Overall, the new framework constitutes a major improvement, but it is still too early to see the impact of the insolvency reforms in data. Spanish consumers are (12) Ampudia, M., van Vlokhoven, H. and Zochowski D., Financial fragility of euro area households, Working Paper Series, No 1737, ECB, October 2014. (13) The law 25/2015 on second chance. 2.3. Indebtedness and deleveraging among those in the EU most often reporting unfair commercial practices in the banking sector, according to the consumer market scoreboard. Drivers of deleveraging in the non-financial corporations sector To reduce debt, the corporate sector is running a surplus of savings over investment. In 2009, the corporate sector in Spain turned from a net investor to a net saver position, and since 2012 negative credit flows have been the main driver of the fall in corporate debt-to-GDP ratio. On the back of improving economic conditions, the surplus of the corporate sector started to shrink in mid-2014, and real GDP growth started to contribute positively to reducing the indebtedness of non-financial corporations (Graph 2.3.4). In contrast, deflation constituted an obstacle for corporate deleveraging in 2014 and 2015. In the medium term, the corporate sector can be expected to move back to net investor position. Graph 2.3.4: Breakdown of year-on-year changes in debtto-GDP ratios for non-financial corporations in Spain has declined by around 60 % since the peak, compared to a 30 % decline in the manufacturing sector or a 15 % decline in the services sectors other than real estate. In the second quarter of 2015, banks were still reducing the volume of lending to construction and real estate activities (by 15 % in year-on-year terms), while lending to other activities was increasing (e.g. trade and financial intermediation) or bottoming out (e.g. industry). Given lower corporate debt and the recovery in financial markets, the debt-to-equity ratio in 2015 was back to the levels observed in 2008 (Graph 2.3.6). Progress achieved so far puts the remaining deleveraging needs at below 10 pp. of GDP. This estimation is based on both past deleveraging episodes, taking account of the preceding debt increase, and a benchmark assessing the sustainable level of indebtedness, which is consistent with firms’ assets corrected for valuation effects. Graph 2.3.5: Bank financing to non-financial corporations in Spain - contributions to annual growth y-o-y% 30 y-o-y% 25 30 20 25 15 20 10 15 5 10 0 5 -5 0 -10 -5 -15 -10 -20 -15 Credit flow Other changes Real growth D/GDP, change 15Q1 14Q1 13Q1 12Q1 11Q1 10Q1 09Q1 08Q1 07Q1 06Q1 -20 Inflation (1) non-consolidated data, ESA 2010 Source: Eurostat Over the last seven years, the decline in lending to firms has been concentrated in construction and real estate. In mid-2015, loans to the construction and real estate sectors represented almost 28 % of total loans to productive activities, down from almost half before the crisis. The stock of loans to the construction and real estate sectors started to fall already in 2008 (Graph 2.3.5) and 00 01 02 03 04 05 06 07 08 09 10 11 12 13 14 15 Agriculture Industry Construction Services Real estate activities Total Source: European Commission, BdE Financial pressure on firms in Spain varies across sectors. According to BACH European database (containing aggregate information on non-financial companies), in 2013, Spanish firms recorded on average lower profitability than their European peers. In the other services, trade, electricity and water sectors, profitability was higher than the average for the country, while firms in the construction and real estate sector were making losses. Compared to other countries, Spanish firms of all sizes faced a medium level of 28 2.3. Indebtedness and deleveraging financial pressure measured by the ratio of interest on financial debt over earnings before interest, taxes, depreciation and amortisation (EBITDA). However, the pressure was particularly high for firms in the construction and real estate sectors, intermediate in the agriculture and fisheries as well as electricity and water sectors, and lower in trade, industry and other services. Small firms have recorded the lowest level of profitability and the highest level of financial pressure. Graph 2.3.6: Leverage of non-financial corporations in Spain Debt ratios (vs. equity, GDP & total financial assets, %) 140 120 100 80 60 40 20 Debt / GDP Debt / equity 15q1 14q1 13q1 12q1 11q1 10q1 09q1 08q1 07q1 06q1 0 Debt / financial assets Source: Eurostat Corporate insolvency reforms undertaken in 2015 made insolvency procedures and out-ofcourt procedures more flexible. As highlighted in the 2016 Commission proposal for a Council recommendation on the economic policy of the euro area, restructuring of private sector debt can be supported by introducing proper incentives in the insolvency system. The recently adopted corporate insolvency law(14) reformed the in-court debt restructuring process by expanding substantially the scope of agreements (including haircuts, rescheduling of debts, and debt for equity swaps) and revising downwards the voting majorities of creditors required for validating agreements. To avoid piecemeal liquidations of businesses for which there is no chance of reaching an agreement, conditions have been created to sell the business as a whole and assign the necessary (14) Law 9/2015 on urgent measures in the area of insolvency. 29 licences and contracts without the consent of counterparties. Furthermore, the new personal insolvency framework mentioned above is accessible also to small entrepreneurs. It is still too early to see the impact of the insolvency reforms in data. The number of pre-insolvency proceedings actually declined in 2014 due to the improved economic situation in Spain. They are, however, used more often relative to the proper insolvency proceedings than before the crisis. The authorities have set up a task force on insolvency statistics to monitor the results of the reforms. SMEs in Spain remain largely dependent on bank funding, but access to alternative forms of financing is improving slowly. The fragmented corporate structure of the Spanish economy exacerbated problems with access to bank financing during the crisis. SMEs are more affected by cyclical funding conditions, and — due to their limited transparency — they have difficulties in tapping capital markets directly. In 2015, new lending under EUR 1 million (a proxy for lending to SMEs) continued to increase (Graph 2.3.8), and credit conditions have been improving, as reflected in lower interest rates and non-interest rate charges, as well as a further relaxation of collateral requirements. The SME Initiative, a programme co-financed by the European Regional Development Fund, should contribute to the improving access of SMEs to finance. Overall developments in corporate access to finance have differed from developments in bank lending. When looking at the entire range of financing instruments available to Spanish NFCs, the decline in their total stock of financing is slower than the decline in domestic bank financing to NFCs, as Spanish firms have been resorting to foreign borrowing and issuing securities. Compared to other EU countries, Spain has a developed securitisation market, with the stock of securitised assets representing between 15 % and 20 % of GDP. However, corporate bonds are quasi-inexistent, and despite some improvement, activity levels in equity financing are still below the EU average. This situation is aggravated by long delays in receiving payments, particularly from the public sector and large firms abusing their position towards smaller suppliers. 2.3. Indebtedness and deleveraging The recent law on business financing is a big step forward to foster alternatives to bank financing, although it is still too early to assess its impact. Spain has made significant efforts in recent years to facilitate SMEs' access to finance despite the difficulties caused by the financial and sovereign debt crises. In April 2015, Spain adopted a new law on corporate financing.( 15) The law has the double objective of improving access to bank credit and developing non-bank financial intermediation. It is an important step forward to promote transparent information on SMEs creditworthiness and to stimulate the use of alternative financing structures, but some of its details are still to be set out in the implementing acts and more time is needed before the law produces the expected results. General government debt General government debt is expected to have exceeded nominal GDP at the end of 2015, after having increased by about 65 percentage points since 2007. Looking forward, general government debt is expected to peak at 101.2 % of GDP in 2016, but to start declining thereafter. As a result, general government debt now makes up a much larger share of the total indebtedness of the economy (Graph 2.3.1). Spain does not appear to face immediate risks of fiscal stress arising either from the fiscal, or the macro-financial side of the economy. An important proportion of sovereign debt held by non-resident creditors gives rise to some shortterm risk. However, neither the maturity structure nor the currency denomination of the debt stock are cause for any particular concern. Less than a third of general government gross debt in 2014 had initial maturity of up to five years. The high debt ratio, however, means that Spain faces high debt-sustainability risks in the medium term.(16) Under normal economic conditions and with no change of fiscal policy after the last Commission forecast year (2017), Spanish general government debt would remain at around (15) Law 5/2015 on promoting business financing. (16) European Commission (2016), "Fiscal Sustainability Report 2015", European Economy, Institutional Paper No. 018. 100 % of GDP until 2019 and only fall to around 91 % in 2026 (last projection year). This projected reduction of around 10 pps. over a 10-year horizon would depend on the structural primary balance remaining constant at a surplus of 0.2 % of GDP over the post-forecast horizon. See Box 2.3.1 for further details and for different scenarios. In the longer term, risks to fiscal sustainability are lower thanks to the positive impact of reductions in age-related expenditure. These correspond to savings due to the recent pension reform. Expenditure increases in healthcare and long-term care are projected to be compensated by decreases in other ageing related factors (pensions, education and unemployment benefits), which — in the case of pensions — will also result in lower income replacement ratios. The Spanish healthcare system faces some sustainability challenges. The system continues to achieve good results in both outcomes and accessibility, while maintaining a relatively low level of expenditure. Nevertheless, it faces a fiscal sustainability challenge in the medium and longterm. Hospital pharmaceutical expenditure registered a strong increase in recent years, which — according to 2015 in-year data published by Farmaindustria — is set to strengthen further in 2015, even excluding the impact of new antihepatitis medications. Moreover, there is scope to improve transparency of procurement of healthcare services at regional level, where there is often a lack of competition between tenderers. A new voluntary budget rule on healthcare spending for application at regional level was approved in mid-June 2015. The new budget rule limits growth in healthcare and pharmaceutical spending in 2015 and 2016 to the reference rate of medium-term economic growth of the Spanish economy. If eligible spending exceeds that rate, then the region concerned would be prevented from offering healthcare services other than those included in the national basket of health services and would be asked to apply efficiency-enhancing measures. Regional governments can comply with the rule on a voluntary basis, and financial incentives to their participation have been devised by the Ministry of Finance and the Ministry of Health in consultation with the health industry. It is however unclear at this stage how many regions will comply with this new rule and therefore what 30 2.3. Indebtedness and deleveraging Box 2.3.1: Long-term projections of general government debt The public debt trajectory has been simulated under alternative scenarios. The baseline scenario has been derived from the Commission’s winter 2016 economic forecast, consistent with the forecast implicit interest rate and the shares of short-term and long-term public debt. This baseline scenario has a number of technical assumptions. First, over the post-forecast horizon, the structural primary balance is set constant at the value projected for 2017. The cyclical component of the primary balance is calculated using (country-specific) budget balance sensitivities over the period until output gap closure is assumed (2018). Second, the long-term interest rate on new and rolled-over debt is assumed to be 3 % in real terms by the end of the projection horizon (2026), while the short-term real interest rate reaches an end-of-projection value that is consistent with the 3 % long-term real interest rate and the value of the euro area yield curve. Third, the GDP deflator is assumed to change linearly until it reaches 2 % in 2020 and remain constant thereafter. Fourth, a temporary feedback effect on GDP growth is introduced in the consolidation scenario (a 1 percentage point of fiscal consolidation effort decreases baseline GDP growth by 0.75 percentage points in the same year). Fifth, the stock-flow adjustment is set to zero after 2017. Finally, in the medium-term, real GDP growth is assumed to average 1.7 % between 2014 and 2021 and then to decelerate to 1.5 % in 2026. Graph 1: Gross debt, Spain % of GDP 110 100 90 80 70 60 2011 2012 2013 2014 2015 2016 2017 2018 2019 2020 2021 2022 2023 2024 2025 2026 No-policy change scenario without ageing costs Stability and Convergence Programme (SCP) scenario Standardized (permanent) negative shock (-0.5p.p.) on inflation Standardized (permanent) positive shock (+0.5p.p.) on inflation Standardized (permanent) negative shock (-1p.p.) to the short- and long-term interest rates on newly issued and rolled over debt Standardized (permanent) positive shock (+1p.p.) to the short- and long-term interest rates on newly issued and rolled over debt Baseline no-policy change scenario Source: European Commission The general government debt is forecasted to peak at 101.2 % of GDP in 2016, and thereafter, according to simulations, to gradually decline to about 91 % of GDP in 2026 (the end of the projection horizon). More favourable assumptions on nominal interest rates and real growth would lead the debt ratio to peak at a slightly lower value and then to decline to a level close to 86 % of GDP in 2026. By contrast, under more unfavourable assumptions on nominal interest rates or inflation, by 2026 the debt ratio would fall only to 97 % and 96 % of GDP, respectively. will be its effectiveness in tackling long-term sustainability challenges in the public health sector. 31 Financial sector developments Confidence in the Spanish economy and its financial sector has continued despite the recent increase in the volatility of global financial markets. By early February 2016, the Spanish 10year government bond yield increased to about 1.7 % and the relevant spread over the German 2.3. Indebtedness and deleveraging Bund to around 150 basis points. These levels are significantly lower than the corresponding levels recorded at the height of the sovereign crisis, reflecting enhanced confidence, but also continued global search for yield amidst ample central bank liquidity. Share prices of all major Spanish banks fell by more than 25% year-on-year in January 2016. This needs to be seen in the context of recent declines in the European stock markets attributed to worries about the impact of a global slowdown on European economy. Graph 2.3.7: The stock of bank loans to the private sector in Spain of impaired assets and their stock falls more quickly than the overall stock of loans. NPLs in the construction sector, which account for the highest share in the total NPLs, have also declined (Graph 2.3.9). The recent insolvency reforms will have a potentially positive impact on reducing the NPLs. Graph 2.3.8: New loans to the corporate sector in Spain y-o-y% 80 60 40 y-o-y% 40 Total non-MFI private sector Non-financial corporates Households 30 20 0 -20 20 -40 10 -60 0 05 06 07 08 09 10 11 Loans < 1MEUR 12 13 14 15 Loans > 1M EUR -10 Source: European Commission, BdE -20 -30 07 08 09 10 11 12 13 14 15 Source: European Commission, BdE The accelerating pace of new lending to nonfinancial corporations is limiting the fall in the stock of credit. In the second half of 2015, new lending to NFCs was increasing by around 13 % year-on-year (Graph 2.3.8). The expansion of new loans below EUR 1 million (a proxy for loans to SMEs) was increasing by about 12.5 % year-onyear. The volume of new loans of above EUR 1 million posted a growth rate of almost 15 % in the same period. New credit is set to more than compensate redemptions already in 2016, and one can expect a growing stock of loans to the corporate sector (Graph 2.3.7). The quality of Spanish banks’ assets has continued to improve. The non-performing loans (NPLs) ratio of loans to NFCs and households further decreased to 10.3% in November 2015 for the aggregate banking sector, from 12.7% a year before. The decline is quite uniform across companies of all sizes. Banks continue to dispose Restructured and refinanced loans declined further in 2015. These loans accounted for 13 % of total loans to the private sector at the end of the second quarter of 2015, down from 14.2 % a year earlier. Based on the classification criteria of the Banco de España (BdE), 49 % of restructured and refinanced loans were non-performing, 18 % were substandard and 33 % performing loans. Similar to the case of non-performing loans, refinanced and restructured loans show a high degree of concentration in real estate (32 %). Restored access of the Spanish banking sector to capital markets ensured sufficient liquidity in the system. Banks are diversifying their funding by shifting their former high reliance on wholesale funding to deposits, central bank funding and repurchase agreements with other counterparties. Even if the proportion of private and public deposits on banks’ balance sheets continued to increase, private deposits have been decreasing marginally, reflecting the higher attractiveness of alternative investment vehicles, such as mutual and pension funds, in a context of low bank deposit interest rates. Access to wholesale funding markets 32 2.3. Indebtedness and deleveraging opened up further, although the share of marketable securities on banks’ balance sheets continued to decline. In the first nine months of 2015, a greater number of banks borrowed a larger amount of funds from markets and at significantly lower yields than in the same period of 2014. In particular, issuance of covered bonds rose significantly. Banks hold a large buffer of collateral available for market operations and the three-month repo rates decreased to close to 0 % and are entering negative territory. Graph 2.3.9: Non-performing loan ratio in Spain % 42 Total 39 Productive activities Construction 36 33 30 Real estate activities Household loans 27 24 Home and mortgage loans 21 18 15 12 9 6 3 0 07 08 09 10 11 12 13 14 15 Source: European Commission, BdE Spanish banks’ reliance on the Eurosystem has recently increased marginally, halting the previous declining trend. Spanish banks’ total net borrowing from the Eurosystem decreased steadily from its peak of EUR 389 billion in August 2012 to EUR 124 billion in March 2015, but was close to EUR 133 billion in December 2015, as targeted long-term refinancing operations (TLTROs) might have been used to replace more expensive borrowing instruments. As a tentative sign of an increasing pass-through of Eurosystem borrowing to the economy, net lending of Spanish banks benefiting from TLTRO liquidity turned positive at the end of 2014. Thanks to higher profitability, Spanish banks increased their capital levels in the first half of 2015. The continued decrease in the nonperforming loans ratio from its peak in 2013, lower bank funding costs and substantial efforts to 33 rationalise and downsize the banking system structure led to significantly higher levels of profitability during 2014 and the first half of 2015. Spanish banks’ consolidated profits (including foreign operations) rose in 2014 despite rockbottoming interest rates. This enabled banks to increase the common equity tier 1 ratio by 80 basis points to 12.4 % between June 2014 and June 2015, and the total solvency ratio now exceeds 14 %. In addition, some banks decided to raise equity during the first half of 2015. A wellcapitalised and solvent banking sector is instrumental for the deleveraging process along with the provision of new lending to the viable part of the economy. While it improved significantly, banks’ profitability in the longer term is expected to remain subdued in the context of a prolonged low interest rate environment. The ongoing deleveraging process of households and enterprises depresses banks’ capacity to generate profits. Competition in the domestic loan market is driving down interest rates on new loans (by more than 100 basis points within one year), while the interest rates that banks pay for their funding (especially for retail deposits) do not have much room left to decline further from already low levels. The interest and trading income that banks derive from their securities portfolios is also coming under downward pressure. Despite a slight improvement in net interest margins, a prolonged low interest rate environment poses a challenge to banks’ profits, especially for those with nondiversified portfolios significantly exposed to floating rate mortgage loans. Moreover, following recent court rulings, some banks have decided to remove interest rate floors in retail mortgages and other banks might follow suit. Turbulences observed in some emerging economies, notably in Latin America, could damage the profitability of the banks most exposed to these markets. The savings bank reform has been finalised, and a new accounting framework for SAREB introduced. The recent adoption of secondary legislation to implement the 2013 savings banks law, which required inter alia that banking foundations — with controlling stakes in banks — set up a reserve fund, is a very welcome development. In November 2015, the Banco de España adopted a circular which constitutes the last step in the implementation of the law. The 2.3. Indebtedness and deleveraging A negative valuation gap has been observed in the Spanish housing market. The overvaluation gap calculated with respect to supply and demand fundamentals — i.e. the real house prices, total population, real housing investment, real disposable income per capita and real long-term interest rate — was closed already in 2012. Other indicators provide a less clear-cut picture. Affordability (price-to-income) and dividend (price-to-rent) ratios were almost back to their long-term averages in 2014, but the gap started to reopen with the recent price hikes (Graph 2.3.10). A simple average of the affordability gap, the price-to-rent gap and the gap calculated with respect to the supply and demand fundamentals points to an undervaluation of 8.6 % in the second quarter of 2015. 60 50 40 30 20 10 0 15Q1 14Q1 13Q1 12Q1 11Q1 10Q1 09Q1 08Q1 07Q1 06Q1 05Q1 04Q1 -10 03Q1 The housing market shows signs of stabilisation. After a sharp adjustment since the crisis, the housing market and the construction sector seem to have experienced a turnaround. For the first time since 2007, unsubsidised housing prices rose in 2014, by 1.8 % in nominal terms. Prices of new dwellings went up by 4.3 % year-on-year in the third quarter of 2015 and those of used dwellings by 4.5 %. Moreover, in the first half of 2015, the number of transactions on dwellings increased by 9.7 % year-on-year, and was almost 40 % higher than in the first half of 2013, according to data by the Ministry of Public Works. Despite these positive signs, there is still a large stock of unsold houses. The evolution of the housing market remains important for banks’ future profitability and the success of SAREB, the Spanish asset management company. 70 02Q1 Adjustment in the housing market Graph 2.3.10: Valuation gap in the Spanish housing market according to the price-to-rent and price-toincome ratios % deviation from average reform will contribute to the sustainability of the savings banks going forward. There has been no further progress on privatisation of state-owned banks though. However, the entry into force of a new accounting framework for SAREB, the Spanish asset management company, is a positive development, as it will allow proper treatment of impairments and asset-price evolution, and help in adapting SAREB’s deleveraging policies to credible market assumptions. Price to rental vs l-term average Price to income vs l-term average Source: Source: European Commission, Eurostat, OECD, ECB, BIS Progress has been made on the orderly deleveraging of the private sector, but general government debt remains high. The reduction in indebtedness will now rely to a larger extent on economic growth. The outstanding stock of credit is still declining, but banks are ready to fund less indebted sectors and healthier corporations. Growth in new lending is supporting economic activity. Credit conditions for firms have improved in 2015, as reflected in lower interest rates and non-interest rate charges, as well as a further relaxation of collateral requirements. Banks have restructured their activity and the quality of their assets has improved, as shown by the declining — though still high — non-performing loans ratio. Bank sector profitability has been rising, but still relies to a large extent on declining funding costs and the reduced need to provision against loan losses. While indebtedness in the private sector has been reducing, general government debt is expected to peak in 2016 and remain at a high level over the medium term, under a no-policychange scenario. 34 2.4. LABOUR MARKET ADJUSTMENT The labour market situation has improved against the backdrop of a gradual economic recovery. After almost 6 years of predominant job destruction, employment growth turned positive at the beginning of 2014. The activity rate (people aged between 20 and 64 years) stabilised in 2014 after increasing throughout the crisis, mainly due to increased participation of women (more than compensating the decrease in employment among men) and the reduction of the overall working age population, resulting both from net emigration flows (-225 000 in 2013) and from the ageing of the population. Employment increased by 3.1 % (or 546 000 jobs) in the year to Q3-2015, most of which happened in services (+ 413 000 jobs). Industry and construction also registered increases (53 000 each). Unemployment is falling, but its average duration is rising, and youth unemployment remains very high. After peaking in mid-2013, the unemployment rate fell to 21 % in the fourth quarter of 2015, corresponding to a 2.8 pps reduction during the last 12 months. However, with almost 5 million jobless people, Spain remains the country with the second highest unemployment rate in the EU. Long-term unemployment (i.e. for more than one year) is decreasing, but very long-term unemployment (i.e. for more than 2 years) is declining more slowly, and risks becoming structural. In the third quarter of 2015 the long-term unemployed made up 51 % of total unemployment, down from 53.4 % a year earlier. During the same period, the proportion of very long-term unemployed increased slightly from 33.9 % to 34.6 %. Youth unemployment has also decreased but remains very high. As more young people have moved into employment or education and training, the unemployment rate of people aged 15-24 declined from 51.8 % in Q4-2014 to 46.4 % in Q42015. The percentage of youth ‘not in employment, education or training’ decreased from 20.8 % to 18.5 % according to national data, whereas the activity rate remained unchanged indicating that a higher proportion of young people are enrolling in education or training courses. The turnaround in unemployment dynamics broadly coincided with GDP growth turning positive. The rapid response of unemployment to real GDP growth has been rather unusual 35 (Graph 2.4.1), as unemployment usually responds with lags to improvements in the economic situation, and only when GDP growth has reached a certain threshold to offset the effect of increasing labour supply and labour productivity growth. Graph 2.4.1: Unemployment rate, GDP and employment growth in the market sector y-o-y% % 4 27 2 0 22 -2 -4 17 -6 -8 12 -10 -12 7 08 09 10 11 12 13 14 15 GDP growth Employment growth market sector Unemployment rate (rhs) (1) The market sector excludes Public Administration, Education, Health, Source: Eurostat, National Accounts Wages have kept growing at a moderate pace in 2015, in a context of improving labour market conditions. Hourly nominal compensation per employee increased by 0.1 % in the third quarter of 2015 compared to the same period of 2014. This, combined with a small increase in labour productivity of 0.2 %, implies broadly stable nominal unit labour costs (+0.1 %). However, wage stability has taken place in a context of negative inflation, resulting in an increase in real wages of 0.7 % over the same period. These figures suggest a continuation of the wage moderation trend started in 2010 (Graph 2.4.2), even in a phase of economic recovery and decreasing unemployment. Negotiated wages at sectoral level have supported this trend, with an overall increase of 0.6 % in 2014 and 0.8 % in 2015, below the 1 % threshold set for 2015 in the latest inter-professional collective bargaining agreement (see Box 2.4.1). 2.4. Labour market adjustment Box 2.4.1: New employment and social dialogue agreement marks a turning point On 8 June 2015, a new Agreement for Employment and Collective Bargaining for 2015-17 has been signed by the main representative trade unions and employers’ organisations. The main declared objective is the creation of stable and good quality employment, with specific reference to youth employment, vocational education and training, restructuring processes, the right to information of negotiators and of being consulted, occupational health and safety and to equal opportunities. Following the reforms of collective bargaining introduced in 2012, the agreement could be seen as promoting coordination of decentralised bargaining, providing guidance from cross-industry level, but flexibility for the company level. The agreement would allow creating employment and increasing firms’ competitiveness, while increasing workers’ purchasing power, in the sectors and/or regions where productivity gains allow for it. The minimum income schemes are not covered by the new agreement. The new agreement is expected to contribute to adapting the labour market to the economic recovery. The deal set a 1 % pay rise in 2015 and 1.5 % in 2016; the reference for 2017 will be the evolution of GDP (not inflation) as well as government's macroeconomic perspectives. The deal marked a turning point after the two previous agreements of 2010 and 2012, which ended in a wage freeze. The actual increase in negotiated wages at national level has been lower than the target in 2015, but still coherent with an increase of salaries’ purchasing power, in a context of negative inflation. The agreement opened the possibility for negotiators to consider specific firm, sector and regional situations. While there is no evidence of a rising share of workers covered by firm-level agreements, data show signs of wage differentiation across sectors and regions. In the year to the third quarter of 2015, nominal wages increased moderately in ten regions out of seventeen in industry and in twelve regions in services, and decreased in the others. Wage increases have occurred mainly in regions with higher economic growth and stronger reduction in unemployment rate. However, such evolutions could only be confirmed over a longer period and by continued monitoring of wage developments across regions and sectors, along with data on the evolution of productivity. Graph 2.4.2: Wages and unit labour cost 10Q1=100 105 100 95 90 85 80 75 70 65 60 level agreements should prevail over industry-level agreements in a number of areas, and extended possibilities for firm level opt-outs from collective agreements and unilateral changes in working conditions. However, while modest growth of negotiated wages at sectoral level might have incorporated the effects of the reform, the uptake of firm level agreements remains slow (Graph 2.4.3). In fact, while the majority of new agreements (79 % in 2015) are signed at firm level, the share of workers covered by these arrangements is very low and even decreasing over time (only 6.7 % of total workers covered by collective agreements and 4.2 % of those covered by new agreements signed in 2015, compared to respectively 8.3% and 11.8 % in 2014(17). Compensation per employee (hourly) Nominal unit labour cost Source: European Commission on Eurostat data Moderate wage claims might reflect a change in the wage setting environment, but there is no evidence that firm level collective bargaining is picking up. The 2012 reform established that firm (17) When ‘new negotiation units’, i.e. contracts that are signed for the first time, are taken into account, the share of workers covered by firm level agreements is higher (9.5%), but still lower than the corresponding figure recorded in 2014 (33.6%). 36 2.4. Labour market adjustment Graph 2.4.3: Coverage of firm level collective bargaining % 10 Graph 2.4.4: Wage growth in tradable and non-tradable sectors 10Q1=100 106 9 8 104 7 6 102 5 4 100 3 98 2 1 96 0 2010 2011 2012 2013 2014 2015 94 Share of workers covered by firm-level agreements 10Q1 11Q1 12Q1 Tradable sectors (1) Figures for 2014 and 2015 are preliminary. Source: Source: Spanish Ministry of Employment and Social Security Moderate wage growth has been broadly supportive of macroeconomic rebalancing. Results from a wage benchmarking analysis conducted at EU level (18) show that in 2014 nominal wages in Spain have grown below a prediction based on economic fundamentals (i.e. growth in domestic prices, unemployment and productivity) and below the rate consistent with a constant value of the real effective exchange rate. Updates for 2015 based on the European Commission’s autumn forecast confirm this analysis, suggesting that wage growth in 2015 would be lower than the two reference values by 0.7 % and 3.3 %, respectively. Wage growth has been more sustained in tradable compared to non-tradable sectors (Graph 2.4.4). This is consistent with a relative pick-up of labour productivity in the former sectors and the ongoing reallocation of the labour force in that direction over the last five years (see Section 2.1). (18) Arpaia, A. and Kiss, A. (2015), ‘Benchmarks for the assessment of wage developments: Spring 2015’, DG EMPL Analytical Web Note 2/2015. 37 13Q1 14Q1 15Q1 Non-tradable sectors 1) Sectors considered as tradable are agriculture; industry (excluding construction); trade, transport, food and accommodation; and information and communication. (2) Sectors considered as non-tradable are construction; financial and insurance activities; real estate; professional, scientific, technical and support activities; artistic, leisure, and household repair services and; non-market services, including public administration, defence, social security, education, health and social services. Source: European Commission on Eurostat data The reforms adopted between 2012 and 2014 seem to have cushioned the fall in employment and accelerated its recovery. Between Q1-2012 and Q4-2013, employment declined by 5 %, corresponding to a loss of more than 600 000 jobs. These losses were almost recovered in the following quarters. A prediction of employment based on the pre-reform relationship with GDP growth(19) suggests that, in the absence of reforms about 400 000 more jobs would have been lost, and employment would have started to grow again only a few months later in Q2-2014; the recovery in employment would also have been milder (Graph 2.4.5). This suggests that the labour market is now able to generate employment growth with lower GDP growth than in the pre-reform conditions. (19) Comprehensive reforms take time to exert their effects, and policy impacts are difficult to disentangle from other economic factors. With these caveats in mind, the effects of the reform can be inferred by comparing post-reform developments with the evolution predicted on the basis of the pre-reform relationships with underlying leading variables. 2.4. Labour market adjustment Graph 2.4.5: The evolution of employment in non-market sectors Thousands while the effect on new hiring was more limited (Graph 2.4.7) (20). Graph 2.4.6: The evolution of the job finding rate before and after the reform 15000 14500 % 14000 10 13500 9 13000 8 12500 7 12000 6 11500 09Q1 10Q1 11Q1 12Q1 13Q1 14Q1 15Q1 5 Employment Employment predicted without the reform The employment predicted without the reform is the employment derived from a regression of employment growth on GDP growth and lagged employment growth. Estimation period 1996Q2-2012Q1. The estimated regression empl. growth =-1.2+0.33 empl. growth (-1) + 1.15 gdp growth coefficients statistically significant at 1%. Source: European Commission on Eurostat and OECD data. The 2012 reform is likely to have had a positive, but small effect on hiring and to have helped limiting job destruction during the second dip of the crisis. Unemployment fluctuations are driven by changes over the cycle of the job finding rate and separation rate. At the onset of the 2008 crisis, the hiring rate dropped dramatically and started to pick up again only at the end of 2013, remaining well below its pre-recession levels (Graph 2.4.6). Based on pre-reform cyclical behaviour of the vacancy to unemployment ratio, the predicted job finding rate would have started to improve only from mid-2014 and would have been about 1pp. below the actual rate in Q1-2015. Improvements in the separation rate have been significant, with job destruction rates approximately back to pre-recession levels already by end-2014, while our estimates suggest that they would have remained higher in the absence of reforms. As also showed by the OECD preliminary assessment of the 2012 Labour Market Reform, this evidence suggests that the reform was successful in bringing down the separation rate — mainly thanks to the increased internal flexibility, 4 09Q1 10Q1 11Q1 12Q1 13Q1 14Q1 15Q1 Job finding rates actual Job finding rates predicted without the reform The job finding rate predicted without the reform is the job finding rate derived from a regression of job finding rate on vacancy/unemployment ratio estimated for the period preceding the reform (i.e. on the period 1996Q2-2012Q1). The estimated matching function is log(f)=0.89+0.41*log(v/u) coefficients statistically significant at 1%. Source: European Commission on Eurostat and OECD data. (20) OECD (2014), The 2012 Labour Market Reform in Spain: A Preliminary Assessment, OECD Publishing. 38 2.4. Labour market adjustment Graph 2.4.7: The evolution of the job separation rate before and after the reform Graph 2.4.8: Job finding rate by duration of unemployment % 25 % 3 20 2 15 2 10 1 5 0 09Q1 10Q1 11Q1 12Q1 13Q1 14Q1 15Q1 Job separation rate Job separation rate predicted without the reform The separation rate predicted without the reform is the separation rate derived from a regression job separation rate on the vacancy/unemployment ratio estimated for the period preceding the reform (i.e. on the period 1996Q2-2012Q1). The estimated equation for the separation rate is log(f)=1.79 - 0.42*log(v/u); coefficients statistically significant at 1 %. Source: European Commission on Eurostat and OECD data. Low job finding rates have translated into a high share of long-term unemployment. At the onset of the crisis, the deterioration in the job finding rate concerned all durations (Graph 2.4.8), hinting at a generalised shortfall of labour demand. As the recovery began taking hold, the job finding rates started to increase but mainly for the shortterm unemployed, while improvements appear relatively small for those who have been jobless for 6 months or longer. As low rates of job creation persist, a rising share of the unemployed may have long spells of unemployment. 39 0 06Q1 07Q1 08Q1 09Q1 10Q1 11Q1 12Q1 13Q1 14Q1 15Q1 Less than one month Between 3 and 6 months Between 6 and 12 months More than 12 months Source: European Commission on Eurostat data. Nearly 60 % of the long-term unemployed are low-skilled and face lower job prospects. Even if the Spanish economy still employs a higher share of low-skilled workers than the rest of EU, this share is lower than before the crisis. In 2014 one third of those in employment were low-skilled against 42 % before the crisis, which seems to indicate that labour demand has shifted towards higher skills requirements (see also evidence of increased skills mismatches below). Since longer unemployment spells are linked to skills depreciation and lower employability, the high share of the low-skilled among the long-term unemployed with low participation in training is a major challenge in Spain (Graph 2.4.9) 2.4. Labour market adjustment Graph 2.4.9: Long-term unemployment by skills level % 20 18 16 14 12 10 8 6 4 2 0 curve suggesting deterioration in the matching/hiring process may occur for several reasons, and all may apply to the Spanish situation. First, the ongoing process of job reallocation in the economy may lead, if prolonged, to a structural deterioration in matching vacant jobs with unemployed people and ultimately to higher structural unemployment. Second, the current labour supply does not match the diversity in the composition of labour demand in terms of skills, sector, geographical location, etc. Thirdly, the lack of effectiveness of labour market institutions (e.g. job search assistance and support) may impact on the matching between the unemployed and vacant jobs. 00 01 02 03 04 05 06 07 08 09 10 11 12 13 14 Graph 2.4.10: Beveridge curve for Spain LTU 1.Low 2.Medium 3.High (1) LTU: Long-term unemployment Source: European Commission 50 (21) It is well-known that the adjustment to labour demand shocks implies a temporary deviation of the unemployment rate from the Beveridge curve and that this may manifest as a shift in the Beveridge curve (e.g., Blanchard and Diamond, 1989). 2008Q12015Q2 2001Q12007Q4 40 Vacancies Persistently high long-term unemployment implies that unemployment has become entrenched. In the third quarter of 2015, the longterm unemployed rate (more than one year) stood at 11.1 % of the labour force, down from 12.9 % a year earlier. During the same period, the proportion of very long-term unemployed (i.e. for more than two years) decreased from 8.2 % to 7.6%. The Beveridge curve (Graph 2.4.10), which shows the relationship between the unemployment rate and a proxy for open vacancies suggests that the crisis led to a major drop in labour demand without major consequences in terms of matching until 2010, and then to a gradual deterioration in the matching process, implying higher structural unemployment (shifts of the curve point at changes in the efficiency of matching). With labour market conditions improving, vacancies have started to grow again, which is the pattern expected in response to strengthening labour demand. However, from the data it is not easy to gauge whether, during the recovery, unemployment and vacancies will keep improving at different paces with no improvement in the matching process or whether this will reflect different cyclical response to the improved economic outlook(21). Shifts of the 30 20 10 5 10 15 20 25 30 Unemployment rate (% of labour force) (1) The series ‘Factors limiting production: Labour’ from Business surveys is taken as proxy of vacancies Source: Eurostat, Business and Consumer Survey Estimates of structural unemployment suggest that there is still slack in the labour market. A commonly used proxy for structural unemployment is the NAWRU (non-accelerating wage rate of unemployment ( 22), which according to Commission's estimates, amounted to 18.5 % in (22) The NAWRU is the rate of unemployment at which real wages increase in line with expected labour productivity growth, i.e. consistent with constant real unit labour cost. It is a positive function of price mark-ups (a proxy for the degree of competition in the product markets), wage markups (a proxy of workers’ wage bargaining power), and the ratio between reservation wage and real productivity (an indirect measure of unemployment benefits and other institutional factors). 40 2.4. Labour market adjustment 2014 for Spain. The recent increase in the NAWRU could be ascribed to persisting malfunctioning in labour and product markets (see Section 2.5). However, recent evidence shows that NAWRU estimates can be somewhat pro-cyclical (23) and that persistent demand shocks can have long-lasting effects on the NAWRU. In the case of Spain, wage rigidities arising from the high rate of structural unemployment are likely to be magnified by the high share of long-term unemployed, whose job search intensity is typically lower (and who thus exert lower downward pressure on wages), and by the emergence of skills mismatches, as further explained below. Graph 2.4.11: Skills mismatch and unemployment rate Skills mismatches may explain the persistently high unemployment rate. The crisis triggered a change in the composition of employment and value added from non-tradable towards tradable sectors, necessary to support a rebalancing of external accounts. Since 2008, job destruction in the construction and trade, transports and communication sectors accounted for more than two thirds of the total decline in employment. The change in the composition of employment by sector was accompanied by an increase in the skills mismatch. Graph 2.4.11 reports the unemployment rate and the mismatch between the skills composition of the working age population and the skills composition of those in employment, a proxy for the skills demanded on the labour market (24). The skills mismatch was gradually increasing before the crisis and jumped significantly in reaction to the massive sectoral reallocation shocks. (23) Orlandi, F. (2012), ‘Structural unemployment and its determinants in the EU countries’; European Economy, Economic Papers 455, May 2012 (24) Kiss, A. and A. Vandeplas (2015) % 30 0.22 25 0.20 20 0.18 15 0.16 10 0.14 5 0.12 0 98Q1 00Q1 02Q1 04Q1 06Q1 08Q1 10Q1 12Q1 14Q1 0.10 Unemployment rate (lhs) Skill mismatch (rhs) (1) Right hand scale varies between 0 (no mismatch, all groups have a uniform employment rate) and 1 (total mismatch = some groups’ employment rate is 100% and that of other groups is 0%) Source: Kiss, A. and A. Vandeplas (2015) Geographical labour mobility for the unemployed continues its downward trend, as 3.7 % of unemployed changed municipality in 2015 compared to 5.6 % in 2010. While large regional differences persist, mobility is predominantly concentrated among young people (with 4.9 % of employed people aged between 16 and 34), workers on temporary contracts and workers of foreign origin. Overall, 81.4 % of the jobless have been living in the same municipality for at least five years and only 3.6 % of them have moved to another region to search for a job. Transferability of social security benefits( 25), labour market intelligence(26) and housing prices(27) are factors that hamper intra-regional job mobility. Duality fuels in-work poverty and hinders productivity growth and reallocation between sectors. One of the features of the Spanish labour market is the coexistence of a better protected group of workers with permanent contracts less (25) ‘Informe sobre los sistemas de rentas minimas en Espana’, 2014, European Minimum Income network (26) ‘Making the most of EU Labour Mobility’, report of a CEPS Task Force, Brussels, 2014. (27) ‘Housing in Spain in the Twenty-First Century’, http://www.foessa.es/publicaciones_download.aspx?Id=50 75 41 2.4. Labour market adjustment impacted by labour market entry and exit flows, alongside a large share of temporary workers, who have borne the brunt of the adjustment. The high labour turnover derived from the high incidence of temporary employment does not provide incentives to invest in human capital, while the protection of permanent employment hinders reallocation between sectors by discouraging the labour mobility of these workers. After a sharp decline in the early stages of the crisis, the share of temporary contracts stabilised at very high levels — at about one quarter of total employees in the first half of 2015, the second highest share in the EU. More than 70 % of all temporary contracts are characterised by an average duration of less than 6 months, which limits access to unemployment benefits given the 12 month qualifying period. In addition, 23 % of temporary workers were at risk of poverty in Spain in 2014 (against 15.6 % in the EU) compared to 5.9 % of permanent workers. The higher poverty risk is associated with a higher incidence of (involuntary) part-time and a wage penalty with respect to permanent workers (which OECD estimates at 18 % after controlling for individual characteristics)(28). In addition, transition rates are low, since only 12 % of temporary workers in Spain moved to a permanent contract in 2014, against 23 % in the EU. The downsizing of sectors employing high shares of temporary contracts (e.g. construction) may reduce the incidence of temporary contracts (29). Of the about 1 million temporary employment losses in the market sector (i.e. excluding public administration) between 2008 and 2010, over 410 000 were in the shrinking construction sector. Since the labour market reforms aimed at facilitating a rebalancing — by increasing the responsiveness of relative wages to inter-sectoral productivity differentials and improving the structure of collective bargaining to better reflect the scope of firm level labour cost adjustment — they may further contribute to reducing duality. However, the current rate of reallocation of employment across sectors might (28) OECD (2015), In It Together: Why Less Inequality Benefits All, OECD Publishing, Paris. (29) The share of temporary employment in construction over total temporary employment in market economy dropped from 27% of 2008 to 10% of 2014; conversely, in the retail and accommodation sectors it increased respectively from about 27 % to 36 % of total employment in market sectors. not be sufficient to reduce the share of temporary employment in non-market sectors (including public administration), which account for one third of total temporary employment and about 30% of total employment. Increasing part-time work might emerge as a further aspect of labour market segmentation. Despite the slight increase in the average number of working hours in the collective agreements, the actual number of hours worked remains low. This may reflect new forms of duality between full-time and part-time workers. The share of part-time job has risen steeply from 12.2 % in 2005 to almost 16% in 2014, still below the EU average of 19.6 %. However, in Q3-2015, 70 % of male and 60 % of female part-timers wished to have a fulltime job. The risk of poverty increased sharply among part-time workers from 18.7 % in 2013 to 22.9 % in 2014, contributing to the overall increase of in-work poverty which grew from 10.6 % in 2013 to 12.6 % in 2014. The specific plan for fighting employment segmentation agreed upon in the tripartite agreement of 29 July 2014 has not been further developed. Although employment flows are dominated by temporary contracts, newly signed open-ended contracts are rising, even if at a slow pace. Graph 2.4.12 presents the newly signed permanent and temporary contracts, with the vertical lines indicating the changes introduced in the regulation of permanent contract since 1995. In 1997 a new permanent contract was introduced with lower severance payments in case of unfair dismissals and financial subsidies for firms hiring with a permanent contract. In 2006, financial subsidies were introduced for open-ended hiring. Finally, the 2012 reform combined lower severance payments with additional financial incentives for open-ended hiring with more flexible contracts in SMEs. After the temporary increase that followed the introduction of the contrato indefinido para emprendedores (30), new permanent employment fell to pre-2012 reform levels in Q2-2013. It picked up again at the end of 2013 as uncertainty was fading and the business cycle had bottomed (30) The new employment contract, in force until unemployment is above 15%, has a trial period extended to one year and various fiscal incentives and is reserved to hiring in firms with less than 50 employees. 42 2.4. Labour market adjustment out. The graph suggests that lower dismissal costs combined with open-ended hiring subsidies are more likely to change permanently the rate of job creation with permanent contracts. The increase in permanent employment has occurred in spite of the low take-up rate of the permanent contract for SMEs. Yet, the share of newly signed temporary contracts remains high. Graph 2.4.12: Newly signed temporary and permanent contracts thousands 1500 thousands 300 May 1997 new open-ended contract with low severance 250 1200 March 2012 labour market reform 900 200 150 600 June 2006, incentives to hire with new openended contract 300 0 100 50 0 Temporary Permanent (right axis) Source: SEPE In spite of recent improvements, high levels of long-term unemployment, skills mismatches and labour market duality remain serious challenges that are not fully addressed in the current policy framework. Several measures have been adopted in 2014 and 2015 to tackle these challenges and promote labour market adjustment, ranging from the introduction of employment incentives, to the adoption of new active labour market schemes to improve the employability of groups experiencing difficult job (re)insertion, to the reinforcement of labour market institutions such as public employment services. However, the effectiveness of these measures is still unclear (see below for details). Frequent modifications in the regulatory environment and lack of coordination between the central and regional labour market institutions may be hampering the overall effectiveness of these policies in getting people (back) into work. Incentives to promote permanent hires show a limited impact, as the take-up of the new measures remains low. In this area, the social security contribution flat rate scheme (tarifa plana) of EUR 100 was replaced in March 2015 by an exemption for the first EUR 500 earned, benefiting those on lower incomes, such as young people and the low-skilled. In addition, the new measure approved in 2014 related to a subsidy of EUR 300 for hiring young people registered in the Youth Guarantee System has continued to be applied during 2015. However, to date the effects of these subsidies in promoting job creation on permanent contracts remain unclear (31) and costs associated to these measures in terms of social security revenue may not be compensated by higher levels of employment. Implementation of recent reforms of active labour market policies remains difficult. Out of 400 000 expected beneficiaries of the Employment Activation Programme approved in December 2014, only 120 000 applications were received until September 2015 (of which 71 000 were approved). This may signal uneven administrative capacity, high levels of bureaucracy and noneffective outreach mechanisms. In addition, there is no information about the effectiveness of the Plan for Professional Reskilling PREPARA Plan – set up to upskill and reskill the unemployed who are no longer eligible for social benefits – in supporting the return to work of its beneficiaries. Coordination between the central and regional labour market institutions is not proving to be effective in providing individualised support and getting people (back) into work. Spending on active labour market policies remains low, despite the increase envisaged for 2016. During the crisis, both the spending on active labour market measures and the share of the unemployed covered by these measures have declined strongly, partly because of the major increase in spending required to provide income support to the newly unemployed. The 2016 budget foreseen for active policies will increase by 10% compared to 2015, but it remains below 2010 levels. (31) Post-programme surveillance report, Spain, Autumn 2015 European Commission. 43 2.4. Labour market adjustment The capacity of the public employment services to provide effective, individualised counselling and job search assistance is still limited. Despite the structural objectives of modernising the public employment services as part of the 2014-2016 Spanish Strategy for Activation and Employment, no specific measures have been taken so far to increase their assistance especially for those further away from the labour market. The national public employment service experienced a 13.4 % staff reduction between 2011 and 2014. In this context, the new programme for the long-term unemployed announced to start in 2016 is likely to increase the workload of staff in the public employment services. The Single Job Portal introduced in 2014 has the potential to contribute to enhanced mobility of workers, but at present the number of vacancies uploaded remains low. Cooperation between regional public employment services and private placement agencies remains marginal. Only limited intermediation services are carried out by private agencies on the basis of grants awarded by the national employment service. Cooperation between employment and social services is also very uneven between regions, making it difficult to ensure the provision of coordinated services for the long-term unemployed (see also Section 3.3). envisages the participation of 1 million people. According to national data, up to February 2015 211 290 young people had been registered, of which it is estimated that 59 281 found a job. The NYGS relies upon an information system that is still being developed. Apart from collaboration agreements with some NGOs, there is no specific outreach mechanism to identify those hardest to reach among young people not in employment, education nor training (NEET) and encourage them to register in the system. Coordination among stakeholders is still lagging behind. The role of education authorities in supporting the large partnership created to support the Youth Guarantee is still to be defined. The role and contribution of regional public employment services in providing young NEET with an offer of employment, traineeship, apprenticeship or further education within the four-month time limit is still unclear. The Common Employment Services Portfolio lags behind implementation. The Catalogue of Services 2014-17, published by the national public employment service in October 2014, seeks to increase coordination and guarantee a minimum standard of services across the country; however, as yet, there are no available data to assess its impact. No follow-up or evaluation is being made yet about how regions are implementing the new protocols. There are concerns that indicators by which the regions are allocated resources do not reflect correctly either the efficacy or the efficiency of the measures implemented. The National Youth Guarantee System (NYGS) is not yet delivering the expected results and the share of registrations remains low. By the end of 2015, approximately 8000 operations were ongoing under the Youth Employment Operational Programme (adopted December 2014), which is the main source of funding for the Youth Guarantee in Spain. In August 2015, the age group eligible for the Youth Guarantee was extended from 16-24 to 16-29. The system 44 2.5. POTENTIAL GROWTH 1990s, Spain entered a period of expansion supported by favourable demographic developments and increasing labour market participation of women, as well as strong capital formation underpinned by the construction boom. The resulting strong expansion of the labour force and of the capital stock translated into potential growth rates above the euro area average (Graph 2.5.1). (33) However, TFP growth in Spain underperformed the euro-area average already from the late-1980s and until the onset of the crisis. The economic and financial crisis resulted in a sharp decline of potential growth in Spain, which fell below the euro area average. In the period 2009-2014, the growth potential of the Spanish economy decreased by 3.2 pps. of GDP compared to the 1996-2007 period (Graph 2.5.1), a much sharper decline than the euro area average. Most of this decrease was due to the sharply falling contribution of labour, and to a lesser extent, of capital. By contrast, TFP started growing again, and contributed positively to potential growth. Graph 2.5.1: Contributions to potential growth, ES and EA 04 03 pps. of potential GDP Low potential growth amplifies the risks related to Spain’s macroeconomic imbalances. Potential growth can be defined as the pace at which the economy can grow over the medium term without generating wage pressures. It depends on the capital stock, the amount of labour available in the economy (itself a function of demographic factors, labour market participation and a non-accelerating wage rate of unemployment, the NAWRU) and the level of labour efficiency. The latter is normally referred to as Total Factor Productivity (hereafter, TFP). In the conventional production function approach, it is calculated as a residual. (32) In practice, it measures the quality of the labour and capital inputs and the efficiency with which they are used in the production process, as a result of structural factors that affect the ability to innovate by firms and the quality of corporate governance and the regulatory framework. Although low potential growth is not an imbalance per se, it amplifies the risks related to existing imbalances. In the long term, potential growth is mostly determined by productivity growth. Low productivity growth weakens both cost competitiveness (affecting the cost efficiency of producing a given item) and non-cost competitiveness (through innovation and product differentiation). At the same time, when low potential growth is due to high structural unemployment, it hinders the full use of labour potential, with negative social implications. Finally, low potential growth increases the likelihood of unstable debt-to-GDP trajectories and vulnerability to adverse shocks. This chapter reviews the main factors constraining potential growth in Spain, and tries to identify areas where structural policies can help raising it. 02 01 00 The contribution of labour, capital, and TFP to potential growth Before the crisis, Spain' high potential growth was driven by strong capital accumulation and positive labour market dynamics. In the mid- -01 ES EA 1996-2007 TFP Capital ES EA 2008-2014 Labour ES EA 2015-2020 Total Source: AMECO, European Commission (32) Potential growth estimates are calculated using ECFIN's production function methodology, see Havik, K., Mc Morrow, K., Orlandi, F., Planas, C., Raciborski, R., Roger, W., Rossi, A., Thum-Thysen, A., Vandermeulen, V. (2014); "The production function methodology for calculating potential growth rates and output gaps"; European Economy, Economic Papers 535, November 2014. The decline of the contribution of labour to potential growth in the period 2008-2014, compared to the 1996-2007 period can be explained by several factors (Graph 2.5.2): (33) The EA-12 is used as a euro area average 45 2.5. Potential growth The sharp increase in structural unemployment rate - as estimated by the NAWRU(34) - that has taken place since 2007, which has accounted for a reduction in potential growth of about 0.8 pps. of GDP (See Section 2.4). The sudden reversal of the strong migratory inflows that came about with the onset of the crisis, which accounted for a reduction in potential growth of an additional 0.9 pps. of GDP. The gradual stabilization of the labour market participation rate at around 68 % (35), which accounted for an additional reduction of potential output growth of about 0.7 pps. of GDP. Graph 2.5.2: Labour inputs' contribution to potential growth 2 pps. of potential GDP 1.5 1 0.5 0 -0.5 -1 ES EA 1996-2007 Hours Worked Working Age population Total ES EA 2009-2014 ES EA 2015-2020 investment. (36) As a result, investment fell sharply, by almost 10 pps. of GDP between 2007 and 2013, and the contribution of capital to potential growth fell from 1.6 pps. on average during the 1996-2007 period to 0.4 pps. on average over the 2008-2014 period -a similar level to the one in the EA-12-, where there was also a decline but of a smaller magnitude. As the deleveraging process progresses well and financial conditions have improved, investment rates have picked up in the past two years (from 18.8 % to 20.7 % between 2013 and 2015), sustaining potential growth (see Box 1.1). Mainly due to the exit of less productive firms, TFP growth has started to recover since the crisis, although the productivity gap with the euro area has remained. Very low or even negative TFP growth in the pre-crisis period, implied that a productivity gap opened up vis-à-vis the euro area, with TFP levels in Spain about 10 % lower than the EA-12 average. TFP growth in Spain has started to recover since the crisis, but the gap vis-à-vis other euro area countries has not closed (Graph 2.5.3). The entry and exit of firms has played a crucial role in productivity increases recorded since the crisis in Spain. (37) Much of the increases in TFP during the crisis were due to the exit of less productive firms (having a 'one-off' effect on productivity), and came to a halt when the destruction of the economic fabric stopped. However, as activity has shifted somewhat towards more productive firms and sectors, it is expected that higher TFP growth rates could be maintained in the future. Participation Rate NAWRU Source: AMECO t+10, European Commission At the same time, the sharp reduction in investment rates following the crisis resulted in a significant reduction in the contribution of capital accumulation to growth. The crisis resulted in tight credit supply conditions that heightened the negative impact of depressed demand and deleveraging pressures on (36) Pontuch, P. (2014); "Firms investment decision in vulnerable Member States; Quarterly Report on the euro area, Vol.12, No. 4; IMF (2014); Art. IV Spain, Selected issues. 37 ( ) Banco de España (Annual Report, 2014) estimates that the contribution of entry and exit of firms to productivity growth went from -4.3 % in the period 1998-2007 period, to +4.3 % in the period 2008-2011. This is explained by the fact that during the crisis, a higher number of firms with below average productivity exited the market, and those entering the market, although in smaller numbers, had higher productivity than those which entered the market before the crisis. (34) The NAWRU is the rate of unemployment at which real wages increase in line with expected productivity, i.e. consistent with constant real unit labour costs. See Havik et al. (2014), op cit. (35) Activity rate as a % of the 16-74 y.o. population 46 2.5. Potential growth Graph 2.5.3: Total Factor Productivity, ES and EA-12 2.5 Graph 2.5.4: Capital intensity and capital productivity 105 EA-12=100 120 100 2 115 90 110 85 105 1 80 0.5 75 EA-12=100 pps. of potential GDP 1.5 95 100 95 70 90 0 65 85 -0.5 60 80 83 86 89 92 95 98 01 04 07 10 13 16 19 22 25 ES: Potential TFP growth (lhs) EA-12: Potential TFP growth (lhs) ES - Potential TFP relative to EA-12=100 (rhs) Source: AMECO, European Commission Productivity and sectoral allocation The increase in capital stock before the crisis went hand in hand with a fall in the productivity of capital relative to the EA-12 average (Graph 2.5.4), pointing to capital and labour misallocations. The pre-crisis period was characterized by decreasing productivity of capital, measured as output per units of capital stock, both in absolute terms and relative to the euro area average. This is because capital flew to nontradable sectors, in particular construction and real estate, characterised by higher profitability but lower marginal returns. (38) By contrast, investment in information and communication technologies or intellectual property remained below that of other euro area countries. (38) Balta, N. (2014), "Catching-up processes in the euro area", Quarterly Report on the euro area, Vol. 12, Issue 1; Pontuch, P. (2014), op. cit. 47 80 91 93 95 97 99 01 03 05 07 09 11 13 15 17 Capital productivity Capital intensity (1) Capital intensity: Net capital stock at 2010 prices per person employed; total economy, relative to EA-12 (2) Capital productivity: Gross domestic product at 2010 reference levels per unit of net capital stock ; total economy, relative to EA-12 Source: AMECO, European Commission Capital and labour misallocations before the crisis not only occurred between sectors, but also within sectors, and underpinned the poor TFP performance of the Spanish economy. Inefficient investment patterns were not only explained by capital misallocation between sectors (e.g. capital and labour flowing to the non-tradable sectors). There is evidence that much of the poor TFP performance in Spain in the pre-crisis period was also due to increasing misallocation of resources within sectors. (39) Graph 2.5.5 shows that the allocative efficiency of the Spanish economy decreased in the period 2001-2007 compared to 1995-2000, and then increased again after the onset of the crisis, as less productive firms exited the market. (40) (41) It has been estimated (39) A way to measure allocative efficiency is to assess whether firms with higher than average productivity within one sector have a higher share of employment, compared to a situation where employment would be distributed randomly across firms regardless of their productivity. A higher correlation indicates that more productive firms within one sector have a higher share of employment, indicating that productive factors are allocated towards their most efficient use (40) Gopinath, G; Kalemi-Ozcan, S; Karabarbounis, L; and Villegas-Sanchez, C. (2015); "Capital allocation and productivity in South Europe" (41) Garcia-Santana, M; Moral-Benito, E; Pijoan-Mas, J; and Ramos, R (2015); "Growing like Spain". 2.5. Potential growth that if the level of within sector allocative efficiency had remained constant at its 1995 level, TFP growth would have been 0.7 pps. higher between 1995 and 2007, and 1.5 pps. lower between 2008 and 2012. (42) Graph 2.5.5: Allocative Efficiency, Spain 2.0 1.6 1.2 0.8 0.4 0.0 1995-2000 2001-2007 2008-2012 (1) Efficiency of the allocation of resources based on TFP Source: Reproduced from Banco de España, Annual Report 2014, p.46. Capital misallocations could have been due to inefficient capital markets and tax distortions. The low risk-premium and abundance of new credit to firms and households in the pre-crisis period, together with a loose screening process by banks, are at the root of the deterioration in allocative efficiency as this allowed less productive firms to stay in the market. Tax distortions could also have played a role. Fatica (2014) finds that specific features of corporate taxation, in particular depreciation schemes and tax reliefs for debt-financed investment, might be particularly detrimental for investment in ICT capital and intellectual property, rather than in longer-lived and more traditional asset types that can be used as collateral for debt financing, such as non-ICT equipment and structures (43); other (42) Banco de España, Annual Report, 2014 (43) Fatica, S. (2014); "Corporate taxation and composition of capital"; Quarterly Report on the euro area; Vol.12, No. 4 authors point to subsidies for investment in structures. (44) Structural policies to raise potential growth Labour market reforms aimed at reducing the rate of structural unemployment, can result in substantial increases in potential output. Spain performs relatively well compared to the euro area average in terms of participation rates and number of hours worked per person per year, although some segments of the working age population have below euro area average participation rates. (45) However, the rate of structural unemployment in Spain (18.9 % according to the NAWRU methodology) is far higher than the EA-12 average (9.9 %). Simulations based on the production function methodology used to calculate potential output (46), show that reducing the rate of structural unemployment by 1 pp. a year, over 10 years, until it converges to a level comparable to the EA-12 average, could boost GDP growth by 0.6 pps. a year on average over those 10 years. In turn, this would result in a permanent increase in level of potential output of 6.4 %. Increasing the level and quality of education is critical to reduce structural unemployment and support the reallocation of resources towards more productive activities. The human capital available in the economy, both in terms of skills, and in terms of its labour market relevance, is a key driver of potential growth and determines its productive specialization. The crisis has caused a concentration of job destruction among the lowskilled with expertise in very specific sectors, such as construction. This has substantially increased the educational mismatch between labour supply and demand, and may partly explain the persistently high unemployment rate (See Section 2.4). Spain also suffers from a gap of basic skills in the overall population, and despite a high level of attainment of tertiary education university graduates suffer from a low rate of employability. Policies to increase skills and the labour market (44) Diaz, A; and Franjo, L. (2014); "Capital goods, measured TFP, and growth: The case of Spain". (45) In particular, while the participation rates of young people and women aged 55 and over are both about five p.ps. below the EA-12 average, the overall participation rate is 68 %, above the EA-12 average. (46) Havik et al. (2014), op. cit. 48 2.5. Potential growth relevance of the educational system are discussed in Section 3.2 of this report. Improving allocative efficiency can yield substantial productivity gains. Although input allocation only explains a part of the measured TFP gap of Spain vis-à-vis other advanced economies, (47) it has been estimated that eliminating allocative distortions could boost growth by about 1 % a year over the next ten years. (48) The rest of the TFP gap arises from knowledge capital and innovation (labour skills development, information and communication technology capital, and research and development). Regulation can improve allocative efficiency by removing impediments to the movement of factors between firms and sectors. TFP growth is also driven by firms’ ability to innovate and reap economies of scale. In this regard, a high degree of regulation in specific sectors (e.g. professional services), regulatory fragmentation at the regional level, and barriers to company growth pose an obstacle to productivity and innovation in Spain, and at the same time inhibit entry and competition. Despite recent improvements, Spain performs poorly in some areas that refer to framework conditions for doing businesses, as explained in Section 3.4 of this report. Competition-enhancing reforms in the service sector can result in particularly large productivity gains. Spain's TFP growth during the pre-crisis period was very negative in some subsectors, such as personal services (e.g. hospitality), or business services (e.g. professional services) (Graph 2.5.6). However, Spain remained at the technological frontier in other subsectors belonging to business services such as "financial services". (49) Such a disparate performance across subsectors which otherwise require similar physical inputs and human capital inputs (e.g. accounting and financial services), suggests that policy-induced distortions are hampering the efficient allocation of resources. In this regard, firm-level econometric estimates confirm that anti(47) "The New Normal", IMF Discussion Note SDN/15/03, March 2015; Dabla-Norris, E; Guo, S.; Haksar, V.; Kim, M.; Kochnar, K; Wiseman, K. and Zdizenka, A (48) ibid. 49 ( ) Dabla-Norris et al. (2015), op. cit. 49 competitive service sector regulations hamper productivity growth in ICT-using sectors with a particularly pronounced effect on firms that are catching up to the technology frontier, as insufficient competition reduces the incentives to generate and adopt new innovations. (50) Tackling these distortions can result in substantial productivity growth. For instance, there is empirical evidence that a reduction in professional services regulation leads to an increase in the allocative efficiency of the sector. (51) Given the size of the services' sector, and the forward linkages of services to other sectors of the economy, productivity improvements in the service sectors are likely to trigger productivity improvements in other sectors of the economy (see Section 3.4). Graph 2.5.6: Total factor productivity growth rates for selected sectors, Spain, 1990–2007 % 1 0 -1 -2 -3 1990-99 2000-07 -4 (1) ICTGS=Information and Communication Goods and Services Source: IMF Spain's limited innovation capacity hinders both the generation of new technologies and the absorption of existing ones. Spain performs badly in innovation capacity compared to its peers (see (50) Arnold, J., G. Nicoletti and S. Scarpetta (2008), “Regulation, Allocative Efficiency and Productivity in OECD Countries: Industry and Firm-Level Evidence”, OECD Economics Department Working Papers, No. 616, OECD Publishing. (51) Canton, E.; Ciriaci; D; and Solera, I (2014); "The Economic Impact of Professional Services Liberalisation"; Economic Papers 533; European Commission 2.5. Potential growth Section 3.1). The Spanish innovation system could be paying a double toll for this deficit in terms of private sector R&D spending: the lack of independent R&D effort not only affects directly the capacity of private firms to innovate, but it also diminishes their capability to benefit from spillovers generated by knowledge produced elsewhere, that is, it affects firms' absorptive capacity. In the case of Spain, Lopez-Garcia et al. (2010) find that the probability of knowledge spillovers increases six-fold when a firm carries out its own R&D, as compared to a firm with no R&D spending. Therefore, the observed private R&D underinvestment could be undermining Spain's innovative capabilities more than previously believed, as well as decreasing the return on public R&D investment. Policies to boost the innovation performance of the Spanish economy are discussed in Section 3.1 of this report. 50 2.5. Potential growth Box 2.5.1: Potential macroeconomic impact of structural reforms Structural reforms can boost employment and help reinvigorate growth. Previous work has shown that the potential impact of reforms can be large. Notwithstanding the usual caveats on the uncertainty of the estimates, recent simulations of the actual reforms in Spain point to their sizeable potential macroeconomic impact (European Commission (2016, forthcoming)). The 2013 pension reforms in Spain have: (i) restricted access to early and partial retirement, (ii) introduced as of 2019 a sustainability factor, which will curtail the initial pension benefit in line with changes in life expectancy and (iii) introduced a new indexation mechanism for pensions in payment. According to Commission estimates, the increase in labour supply could boost GDP by 0.24 % in 2020 and employment by 0.52 %. The reforms could also improve the government balance (by 0.37 pps. in 2020). The 2012 reform of unemployment benefits (UB) has reduced UB for the beneficiaries who draw them for more than six months. The reform could lead to an increase in labour supply and boost GDP by 0.3 % in 2020 and employment by 0.41 %. The government balance also could be considerably improved by 1.11 pps. in 2020, as the reform potentially affects both the expenditure and revenue side. The market unity law of December 2013 aims at removing measures that may directly or indirectly obstruct the free movement of goods and services and the establishment of new operators throughout Spain. Based on estimates from the Spanish government, a reduction in the barriers for start-ups (entry costs) by 35% is assumed. The reduction in entry costs does not amount to a large direct stimulus, but has positive knock-on effects in the QUEST model, stimulating new entry, reducing fixed costs and leading to a reduction in mark-ups, so potentially boosting GDP by 0.2 % in 2020 and employment by 0.01 %. The 2012 retail reform made shop opening hours more flexible, simplified licensing procedures for small retail outlets, and liberalised sales periods. The reform could lead to a reduction in mark-ups in the sector and could have a positive impact on GDP (0.21 % in 2020), employment (0.12 %), and the medium term government balance. The 2012 tax reforms (the VAT reform, reduction of debt bias in the treatment of housing in personal income tax, and new taxes on electricity generation) could boost GDP by 0.2 % in 2020. The 2014 tax reform, focusing on cuts in personal income taxes and corporate income taxes, could add 0.1 % to GDP in 2020. Although the reforms have led to increases or decreases in implicit tax rates, they have been simulated assuming a revenue neutral adjustment of all taxes, so that their structural element can be isolated. The compensation is made through an adjustment of all taxes (labour, consumption and capital) proportional to their initial share in revenue in Spain. Due to insufficient information, methodological difficulties or temporary character of some of the measures, the assessment does not take into account: the ALMP reform, the 2013 rental market reform, introduction of reduced social security contributions, reduced barriers for start-ups introduced with the entrepreneurship law of 2013, measures to strengthen competition in the petroleum sector at retail level, the 2015 reforms of the judicial system, or the 2014 and 2015 reforms to the insolvency framework. Summing up, the reform measures assessed here have the potential of boosting GDP by 1.3% by 2020. Employment can be raised by a similar amount. The government balance could be improved by about 2 pps. As stated above, not all reform measures have been quantified in this exercise so the overall estimates may underestimate the total impact of the reform effort undertaken in Spain. Yet, to put these estimates in perspective, in Varga and In't Veld (2014),(1) a GDP gain of 3.2% is reported after 5 years if, for all structural indicators, half the gaps with best performers are closed. This indicates that the reform measures considered in this exercise go only part of the way in closing the gaps with best practice. (1) Varga, J, In't Veld, J. (2014), “The potential growth impact of structural reforms in the EU: a benchmarking exercise“, European Economy Economic Papers no. 541. 51 2.6. MIP ASSESSMENT MATRIX This MIP Assessment Matrix summarises the main findings of the in-depth review in the country report. It focuses on imbalances and adjustment issues relevant for the MIP. Table 2.6.1: MIP Assessment matrix (*) – Spain Gravity of the challenge Evolution and prospects Policy response Imbalances (unsustainable trends, vulnerabilities and associated risks) External balance As a result of the pre-crisis expansion, Spain has a high stock of net external liabilities, amounting to -93 % of GDP in 2015 Q2 (Graph 2.1.2), mainly composed of debt instruments. This exposes Spain to adverse shocks or shifts in market sentiment. From a peak deficit of 9.6 % of GDP in 2007, the current account turned into a surplus of 1.0 % of GDP in 2014 (Graph 2.1.2). However, no significant improvement has been observed yet in the NIIP-to-GDP ratio as a result of negative valuation effects, while growth has only recently started to support the improvement in the NIIP (Graph 2.1.16). Measures have been taken to restore and maintain cost competitiveness. These include a reform of the wage bargaining system (pp.3637) — although evidence shows that firm level bargaining is not picking up — and targeted reductions in social security contributions (p. 43). The current account surplus is forecast to widen to 1.5 % of GDP in 2015 (p.4). By contrast, the cyclically-adjusted current account is expected to register a surplus of only 0.3 % in 2015 (p.18). In any case, higher current account balances would be needed to put the NIIP on a downward trajectory via an adjustment in flows (Table 2.1.1). Challenges are still present regarding R&D, innovation, technological content (pp.54-55) and policies aimed at attracting FDI. Cost competitiveness has significantly adjusted since the onset of the crisis, and ULCs growth is expected to remain contained during 2015 and 2016 (Graph 1.4). However, no major improvement in non-cost competitiveness can be evidenced yet (p.16). Public debt Spain has a high level of public debt, amounting to 99.3 % in 2014, and forecast to reach a peak of 101.2 % of GDP in 2016, and decline thereafter (p. 30). Public debt has been increasing, on account of persistently large though declining deficits of -5.9 % in 2014 forecast to improve to -4.8 % in 2015 and -3.6% in 2016 (p.7). According to the Commission 2016 winter forecast, Spain is not likely to have achieved a structural improvement in the general government balance in 2015. The country faces high debtsustainability risks in the medium term (p.30). Standard debt sustainability analysis indicates that without further consolidation measures, debt would still be above 90% in 2026 (Box 2.3.1). Further measures are needed in order to ensure compliance with the Stability and Growth Pact. The total stock of private sector debt amounts to 175.8 % of GDP in 2015Q3 in non-consolidated terms, which constitutes a vulnerability and a sizeable impediment to demand and growth in light of deleveraging needs. Deleveraging is on track. Since the second half of 2014, real GDP growth has provided support to the reduction of debt-to-GDP ratios, while a gradual recovery in flows of new credit to the private sector has been observed. Measures have been taken in 2015 in the area of personal (p.27) and corporate insolvency (p.29), which may have a positive impact on NPLs, as well as access to finance (p.32). A large stock of public debt makes Spain vulnerable to changes in financial or economic conditions and increasing financing costs. Private debt (Continued on the next page) 52 2.6. MIP Assessment Matrix Table (continued) Household debt amounts to 68.6 % of GDP and indebted Spanish households are among the most vulnerable in the euro area to an interest rate increase (p.27). Corporate indebtedness amounts to 107.2 % of GDP. Banks have restructured their activity and cleaned up their balance sheets, but bank profitability still relies to a large extent on declining funding costs and the reduced need to provision against loan losses. The non-performing loans (NPLs) ratio remains high (10.3 % in Nov 2015). Deleveraging needs in the private sector are estimated to be between 10 and 20 pps. of GDP for households, and about 10 pps. of GDP for NFCs (pp.26,28). The correction of the Spanish housing market after the burst of the construction bubble has been sharp. The valuation gap is still negative (-8.6% in 2015Q2) in the Spanish housing market but housing prices are increasing (+4.5 % yo-y in 2015Q3). NPLs are now on a declining path (-2.4 pps. y-o-y in Nov 2015). Adjustment issues Unemployment The unemployment rate stands at 22.1 % in 2015, youth unemployment rate at 48.3 % in 2015, one of the highest in the EU and long-term unemployment was 12.9 % in 2014. The persistence of a high unemployment is a reflection of frictions in the adjustment process to existing macroeconomic imbalances. Labour market adjustment is key to prevent the risk of hysteresis, ensure a lasting competitiveness improvement and mitigate social distress. Unemployment started declining in 2013. Employment gains in all sectors — especially in manufacturing and some service sectors — are behind the still incipient reallocation of labour towards tradable sectors (Graph 2.1.17). However, more time is needed to properly assess whether a truly structural change is taking place. Nevertheless, the high levels of unemployment, including youth and long-term unemployment remain the most urgent challenges. High levels of labour market segmentation — comprising permanent employees against temporary — continue to affect negatively working conditions (pp. 41-42). Preliminary estimates suggest that the 2012 labour market reform had a positive effect on job creation (pp. 37-38). The 2015 tax reform has decreased the tax burden on labour (p.77). Challenges are still present, mainly in the area of duality (p.41), on the system of hiring incentives (p.43), and on the education system (pp.56-58). In the area of wage-setting, the impact of the new collective bargaining framework remains to be assessed (Box 2.4.1) Conclusions from IDR analysis • Spain is characterised by a combination of large stock imbalances in the form of external and internal debt, both public and private. These constitute significant vulnerabilities as they expose Spain to adverse shocks or shifts in market sentiment, with harmful implication for the real economy, which can be especially damaging in a context of still very high unemployment. • The current account balance and cost competitiveness have significantly improved since the crisis but net external liabilities are not projected to reach prudent levels at a satisfactory pace. Private sector deleveraging is on track and the reduction of debt-to-GDP ratios is now supported by a favourable real GDP growth. Public debt keeps increasing, on account of persistently large though declining deficits. Despite recent improvements, unemployment remains very high. • Policy measures have been taken in recent years especially regarding the financial sector, the corporate and personal insolvency frameworks and the employment protection legislation. However, challenges remain, in particular, improving innovation and skills in order to boost non-cost competitiveness; and ensuring compliance with the Stability and Growth Pact. (*) The first column summarises "gravity" issues which aim at providing an order of magnitude of the level of imbalances. The second column reports findings concerning the "evolution and prospects" of imbalances. The third column reports recent and planned relevant measures. Findings are reported for each source of imbalance and adjustment issue. The final three paragraphs of the matrix summarise the overall challenges, in terms of their gravity, developments and prospects, policy response. Source: European Commission 53 3. ADDITIONAL STRUCTURAL ISSUES In addition to the macroeconomic imbalances and adjustment issues addressed in Section 2, this section provides an analysis of other structural economic and social challenges for Spain. Focusing on the policy areas covered in the 2015 country specific recommendations, and building upon the findings of the chapter on potential growth, this section analyses issues related to barriers to company and productivity growth in Spain as well as weaknesses in research and innovation, education, social policies, the business environment, network industries, public administration, fiscal frameworks and taxation. 3.1 RESEARCH AND INNOVATION Spain’s Research and Development intensity is losing ground. Spain’s spending on R&D relative to its GDP (i.e. R&D intensity), by both the private and public sectors, continued declining in 2014 (Graph 3.1.1) and stood at 1.2 % of GDP (2 % in the EU). The gap vis-à-vis the EU is particularly visible in investment on R&D by the private sector (0.6 % in Spain vs 1.3 % in the EU). Against this backdrop, reaching the 2 % national R&D intensity target by 2020 will be a challenge. Graph 3.1.1: Spain. Evolution of business R&D intensity and public R&D intensity % of GDP 0.75 Specifically, Spain is ranked 19 (of 28 countries) in innovation performance, two rank positions less than in 2014. The scoreboard shows that Spain’s gap vis-à-vis the EU average is particularly visible with respect to i) firms’ investment in R&D and innovation, ii) the number of SMEs introducing product / process / marketing innovations and iii) the number of SMEs cooperating with other enterprises or institutions on innovation. Performance has also decreased most in the first two areas with respect to the 2014 scoreboard. It should be noted, however, that Spain comes close to the EU average on the dimension of ‘open, excellent and attractive research systems,’ thanks to its score on international scientific copublications.(53) 0.70 0.65 0.60 0.55 0.50 0.45 0.40 0.35 00 01 02 03 04 05 06 07 08 09 10 11 12 13 14 Private Public Source: Eurostat Spain’s innovation performance is also falling, with the country’s gap with the EU average increasing (Graph 3.1.2). The 2015 EU Innovation Scoreboard classifies Spain and most of its regions in the group of ‘moderate’ innovators (i.e. category 3 of 4, four being the worst performers).(52) (52) Eleven regions are moderate innovators, four fall within the worst performing category (i.e. modest innovators) and the Research and innovation policy faces several challenges. Research and innovation policy is shared with regions so, as in any other decentralised country, coordination of central and regional government policies is needed for those policies to achieve greater economic impact. Weak coordination in Spain has led to a fragmented regional landscape of bodies and programmes to foster innovation activities, which is not easy for innovative firms to navigate, especially for the smallest ones. The complementarity with national programmes and organisations is not always clear for beneficiaries either.(54) Nonetheless, positive recent developments in coordination include an agreement between the central and regional remaining two (i.e. Basque county and Navarre) are innovation followers (i.e. category 2 of 4). Regional R&D investment ranges from 0.06 % to 2 % of regional GDP. 4 regions invest over Spains’s average (1.2 % of GDP). (53) http://ec.europa.eu/growth/industry/innovation/factsfigures/scoreboards/files/ius-2015_en.pdf (54) Cf. ERAC Peer Review of Spanish Research and Innovation System Final Report, 2014. 54 3.1. Research and innovation administrations on the Map of Scientific and Technological Infrastructures (ICTS). Also, since 2015, national calls for proposals allow regional governments to fund projects that received a positive assessment in those calls and that failed to get funding at the national level due to budgetary constraints. Graph 3.1.2: Summary innovation index index 0.60 0.55 0.50 0.45 0.40 0.35 0.30 0.25 2007 2008 2009 2010 2011 2012 2013 2014 ES EU28 (1) The summary innovation index, ranging from 0 (worst) to 1 (best), is a composite indicator obtained by an aggregation of 25 indicators grouped into 8 innovation dimensions. Source: Innovation Union Scoreboard 2015 The interaction between public and private research is weak. By way of illustration, the number of public-private scientific co-publications in Spain is below the EU average.( 55) In 2013, public R&D financed by private firms kept declining and stood at 0.037 % of GDP, compared with the EU average of 0.052 %. Against this backdrop, reinforced incentives for public sector researchers to work in the business sector and for the exploitation of public research results in the private sector could enhance public–private cooperation. Incentives for research performance are also weak. Generally speaking, Spain’s science funding is not reliant on international peer review and (55) In 2013 Spain had 24.6 public-private co-publications per million of population compared to 29 for the EU. (Source: RIO report on knowledge transfer and public-private cooperation in Spain, 2015, European Commission Joint Research Centre). 55 funding to universities and public research organisations is not based on performance. This hinders quality and impact of scientific outputs. Recent policies take on board some recommendations of the 2014 independent review of Spain’s research and innovation system. These include a recruitment policy to fill all vacancies for civil servants in public research organisations (up from a 50 % replacement rate in 2014), new programmes to support mobility of talent across sectors — such as the Spanish ‘Industrial PhD’ scheme — and a decision to prioritise available public funding towards global societal challenges in the calls for proposals to roll out the national plan for research and innovation. Moreover, the central government’s budget law for 2016 has increased slightly funding for the implementation of the national strategy for science, technology and innovation and the national plan for research and innovation, although overall investment remains below pre-crisis levels. In addition, in November 2015, the State Agency for Research was legally incorporated,(56) to among other things, ensure an efficient management of public R&I funding. Once created, the focus is on making it operational. However, other recommendations of the independent review have not been followed up specifically. These concern changes to the structure and management of research careers to attract and retain talent and foster mobility between research institutions and between these and the private sector. They also relate to linking resource allocation for research institutes and universities to results and to increase the proportion of competitive funding. (56) Royal Decree 1067/2015 of 27 November 2015. 3.2. SKILLS AND EDUCATION The high level of qualifications attainment in Spain is an asset for competitiveness, but the country's wide educational gaps and the persistent skills mismatches remain a significant restraint. On the one hand, Spain presents a high tertiary education attainment rate, yet tertiary education outcomes are not fully aligned with the labour market needs and cooperation between university and business remains low. On the other hand, it shows one of the highest shares of low-skilled adults and the highest rate of early school leavers in Europe, closely linked to the students' social and economic background, while also featuring significant regional disparities. Improving education and skills is a critical element for Spain to transform its economic growth model. The low level of basic skills of the working force which left education early contributes to longterm unemployment and constitutes a barrier to the country's competitiveness, innovation capacity and social cohesion. Despite continuous decrease in recent years (from 28.4 % in 2010 to 21.9 % in 2014 and 20.3 % in 2015), the early school leaving rate remains the highest in the EU, with persistent strong social and regional disparities: from around 9 % in Cantabria and País Vasco to rates over 27 % in Andalucía and over 32 % in Baleares Islands. Autonomous communities are progressively adapting their regional education structures to the education schemes set in the new 2013 Organic Law for Improvement of the Quality of Education (LOMCE), particularly to implement the initial vocational training programme (Formación Profesional Básica) since school year 2014/2015. The total enrolment rates in the programme (57) in 2015/2016 show the need for additional adjustments in its implementation, in order to improve its quality, attractiveness and transition rates. The LOMCE also establishes new evaluations in primary school to track learning difficulties at an early stage and activate special support programmes accordingly, but those depend on the regional budget, which have experienced strong financial constraints over the past years. (57) The enrolment rate in 2015/2016 for year 1 has increased very little or none and transition to year 2 is below 68 %. The importance of teachers' role in the improvement of the quality of education is expected to shape up future legislative reforms. The OECD Programme for International Student Assessment (PISA 2012) showed that performance of Spanish 15-year-olds in basic skills (mathematics, reading and science) remained below the EU average, with important regional disparities, and is correlated to students' socioeconomic background. (58) The LOMCE introduced a new approach promoting skills-based teaching and learning, which aims at improving students' basic skills and promoting key competences. However, teachers need specific training and teaching conditions better adapted to implement new pedagogical approaches and achieve the objectives of the reform. The replacement rate of retiring teachers has increased to 100 % in 2015 after four years of strong limitations (10 % since 2012 and 50 % in 2015), which is expected to reduce the average number of students per teacher by 20 %, diminish teachers' turnover, allow higher involvement of teachers in schools' projects and facilitate teachers' training. The Ministry of Education has published a "White Paper on teaching" in December 2015, which aims at building a consensus among regions and education stakeholders on a comprehensive reform of the teaching role and the teachers' professional statute. Spain is also among the countries with the highest share of low skilled adults, with 55 % of people aged 25-64 only reaching upper secondary education in 2013, well below the EU average of 75 %. (59) The participation of low skilled people in life long learning activities is low. In 2014, only 3.8 % of the low skilled had participated in training or education. This share is much lower than for the rest of the population (9.8 %) and has declined again in 2014 (compared to 4.5 % in 2013) after having slightly increased during the crisis. (58) For the purposes of this text, the term ‘basic skills’ should be understood as basic skills in reading, mathematics and science, as referred to in the new European benchmark under the ‘ET 2020’ strategic framework. 59 ( ) National system of Education Indicators (Sistema Estatal de indicadores de educación) 56 3.2. Skills and education Graph 3.2.1: Adults participating in education and training (% of the population), total, ages 25-64 % of adults 25 20 15 10 5 0 05 06 07 08 09 10 11 12 13 Total Low-skilled Medium-skilled High-skilled 14 Source: Labour force survey (LFS) The reform of vocational education and training has boosted its attractiveness and enrolment rates, but cooperation between public authorities, education providers and employers is still a challenge. The reform of the catalogue of diplomas offered both for mediumlevel and high-level vocational education and training (VET) is ongoing. Moreover, Spain is increasing the flexibility of the curricula of medium-level VET programmes to better adapt young people’s skills to labour market needs, and to further increase the attractiveness and acceptance of VET programmes. In 2014/15, the new dual modality of VET programmes was run in all autonomous communities. The number of educational institutions (728) and companies (4 878) offering dual VET has risen considerably since the beginning of its implementation, and the number of students enrolled in dual VET (16 199) has quadrupled since 2012. However, it still remains low compared with the overall participation in VET programmes. In 2014, the government offered new financial incentives to enterprises to support participation in dual training under the 2012-2014 Strategy for Entrepreneurship and Youth Employment. Dual training via distance learning is also facilitated by e-learning platforms developed with quality criteria common to those of traditional learning. The clarification of the roles of all stakeholders in work-based learning remains a challenge, in order to match the positive rapid extension of this approach. In the third framework 57 agreement applicable for 2015-2017, signed in July 2015, the social partners agreed to work together in the establishment of the single training account for all workers, and the definition of a new training needs catalogue in enterprises, as well as a better evaluation of the delivered professional training, among other activities. The Chambers of Commerce are getting progressively involved in the scheme at national and regional level to encourage participation by local businesses, but the low capacity of small and medium-sized enterprises (SMEs) to absorb trainees and the lack of training for tutors in companies are still obstacles to building good-quality dual VET and ensuring greater employability of students. Spain’s tertiary education attainment rate is well above the EU average, yet the employability rate of recent tertiary graduates is one of the lowest in Europe at 68.6 %, with a significant proportion of graduates employed in jobs that do not require a university degree. (60) The skills of tertiary graduates are valued in Spain with higher rates of employment at each successive level of education. However, not all degrees are rewarded equally and soft skills gain more relevance in the labour market. The spectrum of study choices, which resembles that found in other OECD countries, is sub-optimal from the employers' perspective. Enrolment in engineering, for example, has fallen by 24 % since 2003, despite good employment perspectives. Although many young people anticipate careers in engineering and computer sciences, the evaluation system in upper secondary, the university governance and funding system constitute a barrier to students' participation, since universities tend to propose a higher number of places in other study fields that are less costly. The 2015 OECD skills diagnosis for Spain (61) reports that the rapid expansion of tertiary education may have come at the expense of quality, and that greater specialisation could improve economies of scale and allow financial resources to be directed towards raising the quality and relevance of skills acquired in higher education. (60) People aged 20-34 who left education between one and three years before the reference year. (61) OECD Skills Strategy Diagnosis Report 2015 – Spain (https://skills.oecd.org/developskills/documents/Spain_Dia gnostic_Report.pdf) 3.2. Skills and education The strategy for the internationalisation and modernisation of university education intends to make the study programmes and funding system more flexible. It also fosters teachers' mobility, to promote quality of teaching and support more competitive research and innovation activities. However, the variation in tuition fees across the regions and universities increases the risk of greater inequality in tertiary attainment, since the economic capacity of the students' family will become critical when applying to a given university. The OECD skills diagnosis also reports shortages in the information and guidance system about labour market forecasts, necessary to ensure quality and alignment between skills supply and demand. Stronger cooperation between universities and the business sector remains also a challenge, to increase the employability of graduates in all sectors and foster innovation as a driver for sustainable growth. Cooperation between businesses and universities has slightly improved over the past five years, partly supported by the legal framework approved in 2011(62). However, budget constrains have imposed restrictions in public funding for research and development activities and the economic crisis has limited the funding capacity of the business sector. Mobility between universities and the private sector is not well developed, to the detriment of the quality and of the relevance of skills developed in tertiary education.(63) In September 2015 the Government approved a decree to increase business representation in university governing boards, but fostering cooperation between universities and the business sector remains a challenge. On the one hand, the reduced mobility of academics and the rigidity of the university governance system are obstacles to closer cooperation, together with the excessive bureaucracy that guides the activity of the Offices for the Transfer of Research outcomes (Oficinas de transferencia de resultados de investigaciόn OTRIS). On the other hand, businesses require incentives to overcome their financial limitations and expand their limited absorption capacity to take on internships or new projects. The recent legislative reform of the university system is a step forward, but financial support and better awareness among the business sector, as well as the education community, is still lacking. (62) The Law on Sustainable Economy and the Law on Science, Technology and Innovation (63) 2015 OECD Skills Diagnosis Report 58 3.3. SOCIAL POLICIES Poverty, social exclusion and inequality worsened in the wake of the crisis and remain among the highest in the EU. (64) In recent years, the three dimensions of poverty and social exclusion deteriorated significantly, bringing the overall share of people at risk of poverty or social exclusion to 29.2 % in 2014 (against 24.4 % in the EU). This represents an increase of more than 1.3 million people compared to 2010. Between 2013 and 2014, the at-risk-of poverty rate increased by 1.8 pps up to 22.2 %, even if the poverty threshold continued to decrease, indicating a sharp fall in overall living standards (associated with declining levels of household disposable income). In 2014, income inequality as measured by the ratio of the highest to the lowest income quintile reached 6.8 against 6.3 in 2013 and 5.9 in 2009. Spain is among the countries with the highest level of inequality and one where it increased most during the crisis, mainly driven by unemployment and the polarisation of earnings among those in work (Employment and Social Developments in Europe 2015). Strong regional disparities also contribute to the overall level of inequality in Spain: the share of people at-risk-of-poverty or social exclusion varies from 20 % or less in Madrid, Navarra, the Basque Country and Rioja to nearly 40 % or more in Andalucia, Extremadura, Murcia and Ceuta. Recent developments in the labour market have not yet translated into an improvement of poverty indicators. There are signs that the deterioration of social trends is taking time to be reversed, even if the basic indicators were to register the impact of the job recovery more quickly. Both the level and depth of poverty are above pre-crisis levels and EU averages. The depth of poverty can be gauged through the falling income threshold, the higher poverty gap (difference between the median income of the poor and median income) and increasing severe material deprivation. (65) In addition, very high levels of long-term unemployment (see section on labour market adjustment), especially among the low(64) The latest data available is from the 2014 EU Survey on Income and Living Conditions (EU-SILC) which refer to 2014 for material deprivation and to 2013 for income and work intensity. 65 ( ) Severe material deprivation refers to the inability to afford some items considered by most people to be desirable or even necessary to lead an adequate life, and it is part of the EU-SILC. 59 skilled, are having a significant impact on poverty and social exclusion. In combination with the sharp increase in involuntary part-time and the high share of temporary work, which are among the highest in the EU and the further increase of inwork poverty, this hinders the potential poverty reduction impact of employment growth. Graph 3.3.1: Poverty and social exclusion in Spain % of population 35 30 25 20 15 10 5 0 05 06 07 08 09 10 11 12 13 14 At-risk-of-poverty-or-social-exclusion rate At-risk-of-poverty rate Severe material deprivation People living in low work intensity households Source: European Commission Children remain the group most at risk. Children are directly affected by the deterioration in the situation of their working-age parents, and by the relatively low impact of family benefits on poverty reduction (see below). Almost 3 million children were at risk of poverty or social exclusion in 2014 (see also increase in Graph 3.3.2), out of which 1.3 million were in households with very low income (less than 40 % of the median household income). Single parent households (mainly headed by women) continue to face the highest risks. Moreover, living in households where parents did not attend secondary education or who are not country nationals remains a factor of increased risk. These risk factors impact both on children's current living standards – since single, low-skilled or migrant parents are more affected by joblessness and in-work poverty – and on future educational outcome and earning prospects. At the same time, the relative situation of older persons (65+) improved, as they continued to be protected by pension systems throughout the crisis. 3.3. Social policies Graph 3.3.2: Poverty and social exclusion in Spain by age % of population 40 35 30 25 20 15 10 5 0 05 06 07 08 09 Children (<18y) Elderly (65+) 10 11 12 13 14 Working age (18-64) Source: European Commission Migrants, the Roma population and people with disabilities continue to be disproportionately affected by poverty and social exclusion. The situation of non-EU migrants significantly worsened during the crisis. Their unemployment rate reached 35.1 % in 2014 and 55.1 % of adult migrants were at risk of poverty or social exclusion that year (against 45.3 % in 2010). In the case of the Roma population, while the overall levels of social exclusion have remained stable at very high levels (around 70 % in 2013), the share of those affected by severe exclusion has more than doubled since 2007 up to 54.4 %.(66) The unemployment rate of people with disabilities is still high at 36.1 %, more than 17 percentage points higher than the EU average, (67) despite the 2 % regulatory quota system for private enterprises to hire employees with disabilities. The gap between people with disabilities and the rest of the population did not increase significantly during the crisis in the areas of poverty and labour market exclusion in Spain. (68) However, severe material deprivation for people with limitations in their daily activities reached 9.1 % in 2014 against 5.5 % in 2010. (66) FOESSA 2014: VII Informe sobre exclusión y desarrollo social en España 2014 (67) Source: EU-SILC 2013 (68) The risk-of-poverty or social exclusion of people with limitations in their daily activities reached 31.2 % is Spain in 2014 (30.1 % in the EU), against 27.7 % for those without any limitations. Minimum income support schemes in Spain remain a set of unconnected programmes with large regional disparities. There are wide regional disparities in delivery arrangements, eligibility requirements and adequacy, with levels of benefits around or below 40 % of the national median income in most regions. Despite the significant increases recorded since 2008, the total number of households receiving minimum income support was less than 1.5 % in 2014, which is well below the estimated number of households in need, considering the very high proportion of jobless households. In addition, half of the regions cover less than 1 % of their households with such schemes, while a few cover 3 % or more, and these differences do not reflect differences in levels of long-term unemployment or poverty. In some regions, the rapid withdrawal of benefits when entering any type of employment (including shortterm contracts) combined with the lengthy procedure to register for benefits hinders the smooth reintegration of beneficiaries into the labour market. This applies in particular to short duration contracts or to part-time jobs that do not provide a living wage. In addition, information about job finding rates for minimum income recipients is quite limited. No progress has been registered so far in streamlining income support schemes with the aim of ensuring adequate coverage of those in need. (69) Limited coordination between employment and social services hampers the effectiveness of activation measures. The multiplicity of players involved at national and regional level in the delivery of employment and social services and the lack of coordination hinders the effective provision of support for people out of work including the development of personalised support for the longterm unemployed and those further away from the labour market. Moreover, there is a lack of ‘onestop shops’ to handle social support and/or activation programmes. (69) The Ministry for Health, Social Services and Equality has launched a project, supported by the Employment and Social Innovation Programme (VP/2014/006), to review the minimum income schemes in Spain, in order to identify potential improvements in terms of level of coverage, consistency of the different cash benefits and their adequacy to the current and future needs. 60 3.3. Social policies Although there has been some improvement, Spain remains one of the Member States where the impact of social transfers on the reduction of poverty is the lowest, in particular for child poverty. In 2014, social transfers (excluding pensions) reduced child poverty by 22 % as compared to the 39 % in the EU. Expenditure on family and housing benefits is particularly low compared to the EU average. Social Protection spending on family and children peaked at EUR 343 per capita in 2009 and decreased to EUR 295 per capita in 2013. to increase further due to the ageing population and women represent around 83 % of informal carers with an estimate that they dedicate more than 20 hours per week to caregiving. Withdrawal from the labour market can have negative impacts on current and future employability and poverty, as it also affects future pension entitlements. This is especially a matter of concern since in Spain, the proportion of women who do not receive a contributory pension is the second highest in the EU and the share of women receiving a pension is 26.3 pps. lower than for men. (71) The lack of adequate child care provision affects children’s opportunities and hampers female labour market participation. According to the Labour Force Survey, 30 % of mothers do not work or chose part-time work due to the inadequacy of childcare services. The informal care provided by grandparents remains crucial,( 70) as places in subsidised child care facilities are limited, and opening hours and a reduction of extra-curricular activities do not meet the needs of full-time working parents. Overall, the attendance rate in early childhood education and care decreased by four pps for children aged 0-2 between 2011 and 2013, to reach 35 %, and is significantly lower for children from disadvantaged backgrounds. Overall, limited progress has been made in improving family support schemes, including affordable early childhood education and care (from 0 to 3). The social impact of mortgage foreclosures and housing evictions continues to be vast and significant. According to data from the Bank of Spain, there were 36 500 repossessions of primary residences in 2014, which corresponds to around 0.6 % of mortgages granted for purchase of primary residence in Spain.( 72) More than half of repossessions were voluntary, but 1 800 of the repossessed primary residences were still occupied at the time of repossession. To tackle the social consequences of evictions, the authorities adopted the Comprehensive National Strategy for Homelessness 2015-20. The mid-term evaluation of the National action plan of Social Inclusion released in November 2015 describes the contents of the plan itself and reports on the measures taken so far although the impact assessment remains weak. Similarly, the evaluation of the second Plan for Infancy and Adolescence indicates that implementation is high although information is lacking for the majority of autonomous communities. The uncertainty of financial resources allocated to the plan, combined with the lack of quantified targets hinders an adequate impact assessment. There is scope to improve coordination between central and regional administrations as regards not only implementation but also monitoring and evaluation. The provision of long-term care remains a challenge and hinders female labour market participation. The number of beneficiaries of long-term care services has decreased by more than 37 400 people in 2014, partly due to delays in the registration of those with moderate dependency. The reduction in central budget contributions to the system has affected the levels of coverage and intensity of services, while it implied a significant increase in costs assumed by dependent people themselves and their families. Spain is among the Member States with the highest proportion of informal carers. This hinders female labour market participation as care needs are likely (70) Spain has one of the highest shares of grandmothers providing intensive care for their grandchildren (17 %), see http://europa.eu/epic/studies-reports/docs/rr-554-dgemployment-childcare-brief-v-0-16-final.pdf 61 Energy poverty remains an issue. During the crisis high energy prices combined with the situation in the labour market and high levels of persistent poverty resulted in a higher proportion of households suffering from energy poverty (71) See Eurostat 2014 and the 2015 Pension Adequacy Report: current and future income adequacy in old age in the EU. (72) Briefing note on mortgage foreclosure processes, http://www.bde.es/f/webbde/GAP/Secciones/SalaPrensa/N otasInformativas/Briefing_notes/en/notabe300715en.pdf 3.3. Social policies (10 % in 2014).(73) Moreover, in 2014, 9.2 % of Spanish households had difficulties paying utility bills, with the proportion for single parent households with dependent children being as high (73) The indicators used to measure fuel poverty are referring to the inability of people to keep their home adequately warm, to pay their utility bills and to live in a dwelling without defects (leakages, damp walls, etc.). as 17.9 %. A new electricity pricing system for domestic consumers was introduced in 2014 together with a social tariff for vulnerable consumers (household residential consumers with contracted power less than 3 kW, pensioners receiving minimum benefits, large families and households with no members in employment). 62 3.4. PRODUCT AND SERVICES MARKETS Barriers to company growth Spain has a larger share of small firms relative to other EU economies. Specifically, in 2013, 95 % of Spanish companies had between 1 to 9 employees, with the services sector accounting for the largest part of small companies. The average proportion of small companies in Germany, Netherlands and the UK combined was 86 % in the same year. Admittedly, small companies account for the lion’s share in all countries. However, the case of Spain differs from other large EU economies in that the share of value added generated by the smallest company class size (26 % in 2012) is considerably smaller than the share of employment absorbed by them (40 %). This is suggestive of lower productivity in smaller companies in Spain. Graph 3.4.1: Share of large companies and economic development. 3 companies (per 10 000 inhabitants) and the mean value of the World Competitiveness Report’s (WCR) 12 composite indicators (74) (Graph 3.4.1), a proxy for economic development. Correlation is strongly positive for variables measuring the quality and availability of infrastructure, higher education and training, goods and labour market efficiency, technological readiness, business sophistication and innovation. Graph 3.4.2: Labour productivity by enterprise size 100 90 productivity of companies with 250 or more employees = 100 Business environment and competition 80 70 60 50 40 30 20 10 Number of large companies per 10,000 inhabitants 0 2.5 1_9 ES 2 1 0.5 0 2.0 3.0 4.0 5.0 6.0 -0.5 Average 12 pillars. WCR indicators (1) red dot: Spain; (2) green triangles: advanced economies(as per the WCR classification); (3) blue squares: other economies ; (4) Average data 1996-2015. (5) Large companies are defined as those having reported in at least one year over 2006-2015 either more than USD 6 million turnover or more than 250 employees. Data have been extracted from the Orbis database and cover 149 countries. Two countries (Luxembourg and Hong Kong) have been identified as influential observations and have been excluded from the analysis. Source: World Competitiveness report, Orbis and European Commission. More developed countries tend to have a higher number of big companies. There is strong positive correlation between the share of large 63 20_49 50_249 Average DE, FR and UK (1) Value added per person employed. Average data for manufacturing, construction and services in 2012. Source: OECD. Entrepreneurship at glance 2015 and European Commission. 1.5 -1 10_19 There is a sizeable productivity gap between small and large companies in Spain. Generally speaking, very small companies tend to be characterised by lower levels of productivity than larger ones, as the latter invest more in R&D than the former, especially in sectors in which scale effects are more important. Spain is no exception. If anything, Spanish companies stand out for having a sizeable productivity gap between large and small companies. For example, in 2012, the productivity level of the smallest company class (i.e. with 9 or less employees) was around 50 % the productivity level of the largest class (i.e. 250 or more employees). This compares with a much (74) These are the following: institutions, infrastructure, macroeconomic environment, health and primary education, higher education and training, goods market efficiency, labour market efficiency, financial market development, technological readiness, market size, business sophistication and innovation. 3.4. Product and services markets higher level of productivity of the smallest companies relative to the largest in the three other large EU economies combined (i.e. Germany, France, and UK (Graph 3.4.2). Graph 3.4.3: Productivity level by industry sector and enterprise size class 140 120 100 80 60 40 comparator countries. Available data point to companies in Spain growing at a slower pace than in other countries, especially compared with the UK. The average size of a small manufacturing company in Spain and in other large EU countries is broadly the same after its first year of incorporation, especially relative to Germany and France. However, after four years, while the average UK manufacturing firm has around 6.5 employees, the Spanish firm has 3.1.This pattern – i.e. higher average number of employees of UK firms over time- holds for other sectors (for example construction and services), with varying degrees of intensity (Graph 3.4.4). It also holds to a lesser extent, compared with other large EU countries (i.e. Germany and France). 20 0 ES EU-3 ES Manufacturing 1-9 10-19 EU-3 Services 20-49 50-249 250+ (1) Thousands of USD per employee, 2010. (2) EU 3: weighted average of DE, FR and UK Source: OECD Entrepreneurship at a Glance 2013 The productivity level of the smallest companies in Spain is also lower than in other large EU countries. Graph 3.4.3 compares productivity levels across countries and different company size classes. It shows that in 2010, the productivity level for firms operating in Spain’s services sector was lower than in other large EU countries, especially for smaller companies. However, the productivity levels of manufacturing companies in Spain with 20 employees or more were similar to It follows that more dynamic firm growth in Spain could spur aggregate productivity growth. Moreover, raising the productivity of smaller companies could also increase Spain’s productivity growth. Graph 3.4.5 shows that productivity gap between the largest (i.e. firms with 250 or more employees) and smallest companies (i.e. with less than 9 employees) is strongly negatively correlated with the WCR indicator on quality and availability of technology. In other words, on average, countries recording higher scores in that indicator tend to have a smaller productivity gap between large and small companies. Correlation is also strong with other WCR indicators measuring quality of institutions, higher education and training, including on lifelong learning, innovation, financial sector development and labour and goods market efficiency. Underperformance in these indicators Graph 3.4.4: Average firm size per age, 2013 Manufacturing 10 9 8 7 6 5 4 3 2 1 0 Wholesale and retail trade; repair of motor vehicles and motorcycles 2y 3y 4y 5y Construction 5 4 4 4 3 3 3 2 2 2 1 1 1 0 1y Professional, scientific and technical activities 5 5 0 1y 2y DE 3y 4y 5y ES 0 1y 2y FR 3y 4y 5y 1y 2y 3y 4y 5y UK (1) Average size of enterprises over 5 years, measured as the number of persons employed in enterprises newly born in t 5 until t 1, having survived until year t (2013), divided by the corresponding number of enterprises. Source: European Commission from Eurostat, business demography by size class. 64 3.4. Product and services markets Table 3.4.1: Business environment factors with highest importance on company growth. Number of employees Less than 10 From 10 to 49 From 50 to 199 From 200 to 999 More than 1000 First component Second component Third component Fourth component Market size Market size Market size Taxation Late payments Macro environment Late payments Macro environment Late payments Economic regulation Access to finance Access to finance Market size Macro environment Late payments Economic regulation Macro environment Market size Economic regulation Access to finance (1) breakdown by company size, 2014 (2) as reported by companies in Spain Source: INE. 2014 Business Confidence Indicator. could therefore be suggestive of bottlenecks to productivity developments in smaller companies. It should be noted that Spain scored below the average and median values of those indicators for the group of 29 economies displayed in Graph 3.4.5. Policy settings have an impact on company growth through different channels. Graph 3.4.5: Productivity gap between largest (250 or more employees) and smallest companies (less than 9 employees) and technological development. 1 0.8 Productivity gap 0.6 0.4 0.2 0 -0.2 2 3 4 5 6 7 8 Technological readiness (1) 2012 data (2) Red dot: Spain (3) The chart includes 25 EU countries plus Switzerland, Norway, Mexico, and Brazil. (4) Technological development is proxied by the World Competitiveness report technological readiness indicator. Source: OECD, World Competitiveness Indicators and European Commission calculations. Survey data in Spain show that company growth is related to policy and performance variables. A business survey conducted by the Spanish statistical office since 2013 makes it possible to examine the factors potentially affecting Spanish firms’ growth capacity. The five most relevant factors (in descending order of importance) reported by employers in the latest 65 survey are the following: market size, macroeconomic environment, late payments, taxation and economic regulation – the latter defined as regulations having an impact on business creation and operations. (Table 3.4.1) Firstly, financial development disproportionately benefits smaller companies. This is because smaller companies tend to be more reliant on bank financing.( 75) The tightening of bank credit in Spain during the economic crisis greatly affected smaller firms. Despite some recent progress, also thanks to policy action aimed at improving access to finance (see Section 2.2), SMEs in Spain appear to remain disadvantaged relative to those in other euro area countries. For example, the interest rate paid by non-financial SMEs in Spain is around 60 basis points higher than the interest rate paid by German and French SMEs.(76) While this spread has narrowed over recent months, it is still high by historical standards. Moreover, venture capital is still not widely used in Spain, notably at seed stage.(77) Secondly, size-dependent regulations can have an impact on firm growth. For example, Spanish firms crowd together below the EUR 6 million threshold in order to avoid stricter enforcement from the tax authorities.( 78) (75) Beck, T., Demirguc-Kunt, A., Laeven, L., & Levine, R. (2008). Finance, firm size, and growth. Journal of Money, Credit and Banking, 40(7), 1379–1405. (76) Source: ECB. October 2015 data. Bank interest rates: loans to corporations of up to EUR 1 million. (77) Venture capital investment fell to 0.10 % of GDP in 2014, with average annual decrease of -15.7 % since 2007. (78) Almunia. M., López Rodriguez, D., (2014). Heterogeneous responses to effective tax enforcement: evidence from 3.4. Product and services markets Recent reforms have reduced disincentive effects to firm’s growth originating from some regulatory thresholds, while leaving others unchanged (Box 3.4.1). Thirdly, larger internal markets strengthen incentives for firms to innovate and grow. Companies in bigger markets can benefit from the greater demand and exploit economies of scale. Differences across regions in regulatory practices – in areas such as tax and business licencing – or in the quality of the public administration may limit the capacity of firms to do so. The law on market unity aims to reduce barriers to access to and exercise of economic activities across Spanish regions and to improve better regulation practices (see below and Annex A for an overview on its implementation). Fourthly, improvements in human capital, including in the area of digital skills, contribute to increasing the innovation capacity of firms. They also contribute to technology adoption, in turn favouring firm growth. While acknowledging progress made, the latest EU digital agenda scoreboard(79) reports values below the EU average for the four indicators measuring human capital development in the area of digital skills, thus showing room for improvement. Recent literature also links differences in company size, firm productivity and company results with differences in firm's management capacity.(80) Fifthly, judicial efficacy fosters the size and growth of incumbents and also promotes entry. In this respect, recent reforms to increase the efficiency of justice could help deliver better results in terms of higher company growth. Lastly, evidence applied to Spain reveals that lengthy bankruptcy Spanish firms. Oxford university Center for business taxation. Working paper series/2014 (79) https://ec.europa.eu/digital-agenda/en/scoreboard/spain#5digital-public-services (80) Huerta, E. and García-Olaverri, C. (2014): ‘La capacidad de dirección en las empresas españolas y el debate de la productividad’ in La empresa española ante la crisis del modelo productivo: productividad, competitividad e innovación. Chapter 3. pp-129-162 Ed Fundación BBVA. procedures decrease firm size and raise funding cost.(81) Professional services and retail trade Regulations on professional services are on average more restrictive in Spain than in other EU countries. The implementation of the Services Directive reduced barriers to the access and exercise of various services activities in Spain, including regulated professions. Despite progress made, the latest OECD product market regulation indicators show that the regulatory framework of professional services is on average more restrictive in Spain than for the set of EU countries for which data are available. This is especially the case for accounting and legal professions and in particular, for entry regulations. Graph 3.4.6: Share of professional services in gross value added and in total employment. Apparent labour productivity % 45 40 35 30 25 20 15 10 5 0 Share in total gross Share in total value added employment (hours worked) ES Apparent labour productivity EU5 (1) Average values 2008-2013; (2) Apparent labour productivity: real gross value added over total hours worked; (3) EU5: weighted average of DE, FR, IT, NL and UK; (4) Professional services sector proxied by NACEs M_N categories: professional, scientific and technical activities; administrative and support service activities. Source: European Commission from Eurostat. (81) García-Posada and Mora-Sanguinetti (2014): Does (average) size matter? Court enforcement, business demography and firm growth. Springer Science+Business Media New York 2014 and Fabbri D (2010) Law enforcement and firm financing: theory and evidence. J Eur Econ Assoc 8(4):776–816. 66 3.4. Product and services markets Box 3.4.1: Size-contingent regulations in Spanish legislation Business register data on the distribution of companies in Spain by employment size averaged over 7 years (2006-2013) show visible drops in the number of firms when they reach 10, 20 and 50 employees (Graph 1). This contrasts with company distribution in other large EU countries for which similar data are available. While in Italy, the data show a visible discontinuity at 15, the distribution of companies in Germany is smoother. The fall in the number of companies at 10, 20 and 50 employees is statistically significant. Graph 1: % change 0 % change in the number of companies with more than one worker depending on the number of employees; average year on year growth rate over 2006-2013 DE % change 0 ES % change 0 -0.1 -0.1 -0.1 -0.2 -0.2 -0.2 -0.3 -0.3 -0.3 -0.4 -0.4 -0.4 -0.5 -0.5 -0.5 -0.6 -0.6 0 5 10 15 20 25 30 35 40 45 50 employees IT -0.6 0 5 10 15 20 25 30 35 40 45 50 employees 0 5 10 15 20 25 30 35 40 45 50 employees Source: European Commission, German Business Register (Destatis), DIRCE (INE), Italian Business Register (Istat) As in other EU countries, Spanish legislation imposes a series of obligations that start being applied when companies trespass a certain threshold. These are defined in terms of number of employees, total assets, company turnover or a combination of those (see table 1). Obligations are related to workers' representation rights, taxation, safety-at-work, audit and accounting. Most regulatory requirements kick in at 10 and 50 employees. However, the drop in the number of companies shown at 20 employees does not seem to be related to regulatory thresholds. Recent reforms in Spain have reduced the burdens associated with those regulations. For example, the 2012 labour market reform eliminated the prior administrative authorisation for collective dismissals; the 2013 entrepreneurship law raised the thresholds for the submission of simplified accounts; it also eased safety-atwork requirements; thresholds for auditing requirements were last raised in 2013; the 2014 corporate income tax reform eliminated the lower tax rate for small companies, while keeping specific amortization and provisioning rules for those. Reforms in other euro area countries aim to reduce disincentives for firms to grow as they approach regulatory thresholds. To illustrate, the 2015 Italian Jobs Act revised employment protection legislation (EPL) for firms with more than 15 employees by reducing the number of cases where workers could be readmitted to the company in the event of dismissal and by introducing severance pay related to tenure in selected cases. The French law on social dialogue and employment simplifies among other things, annual information, consultation and negotiation obligations of employee representatives in companies with more than 50 employees. Smaller businesses will benefit from a timid relaxation of size-related obligations in the context of the Small Business Act (e.g., size-contingent regulations imposed on firms with 9 or 10 employees will apply, as of the entry into force of the reform, to those with 11 employees or more).1 1 http://ec.europa.eu/economy_finance/economic_governance/documents/201512_fr_imbalances_epc_report_en.pdf (Continued on the next page) 67 3.4. Product and services markets Box (continued) Table 1: Selected regulatory thresholds defined in terms of number of employees and /or monetary thresholds (with a focus on companies with less than 51 employees and EUR 10 million turnover) Source Threshold Description Labour market From 10 Obligation to appoint one staff delegate with a credit of 15 paid hours per month regulations employees on and company establishment for the exercise of workers' representation functions. The staff delegate also takes on risk prevention duties. However, the business owner can take on the risk prevention functions in companies with less than 25 employees if he/she has the appropriate skills and carries out regularly his/ her business duties at the company establishment. Accounting More than 10 employees (*) Labour market From 31 regulations employees on From 50 employees on (*) More than 50 employees Legal base Labour Code Last modified Mar-95 Law on risk prevention Sep-13 Collective dismissals regulation applies to companies with 10 employees, in the Labour Code event that all 10 employees are fired. 10% applicable co-financing rate for continuous vocational training (5% for RDL 4/2015 companies with 1 to 9 workers). Loss of incentives for hiring workers on a permanent basis when companies RDL 3/2014 reach 10 employees. RDL 17/2014 SMEs are no longer able to apply special accounting criteria if at the end of the Royal Decree fiscal year and over two consecutive years, the company fulfils at least two of the 1515/2007 following three conditions: Total assets more than EUR 1 million; turnover more than EUR 2 million; average number of workers greater than 10. Feb-14 Obligation to appoint three staff delegates, each with a credit of 15 paid hours per Labour Code company establishment for the exercise of workers' representation functions. Staff delegates appoint one risk prevention delegate among themselves. Law on risk prevention Obligation to create a five member workers' representation committee (comité de Labour Code empresa) for each establishment with 50 or more employees. Obligation to appoint two risk prevention delegates by the worker's Law on risk representatives. prevention Obligation to create a risk prevention committee with two risk prevention delegates and two other representatives from the company side. 20% applicable co-financing rate for continuous vocational training. RDL 4/2015 Loss of incentives for hiring workers on a permanent basis when companies Law 3/2012 reach 50 employees. RDL 16/2013 Companies carrying out collective dismissals (and not undergoing bankruptcy Labour code procedures) affecting more than fifty employees must provide affected workers with an outplacement plan through authorized outplacement companies. Mar-95 Mar-15 Feb-15 Dec-14 Nov-07 Nov-95 Mar-95 Nov-95 Mar-15 Feb-12 Dec-13 Feb-14 Accounting More than 50 employees (and / or other conditions) (*) Companies are no longer able to submit simplified balance sheet if at the end of Royal Sep-13 the fiscal year and over two consecutive years, the company fulfils at least two of Legislative the following three conditions: Total assets more than EUR 4 million; turnover Decree 1/2010 more than EUR 8 million; average number of workers greater than 50. Audit More than 50 employees (and / or other conditions) Obligation for companies to audit their accounts if at the end of the fiscal year and Royal Sep-13 over two consecutive years, the company fulfils at least two of the following three Legislative conditions: Total assets more than EUR 4 million; turnover more than Decree 1/2010 EUR 8 million; average number of workers greater than 50. Taxation Up to EUR 450,000 Monetary thresholds for the application of the simplified VAT regime: Company turnover in the preceding fiscal year under EUR 450 000 (to note that this threshold will be reduced to EUR 250 000 in 2016 and 2017 and to EUR 150 000 in 2018); different thresholds apply to agriculture and farming. Same thresholds apply for the application of the personal income tax imputed income method (estimación objetiva). EUR 6 million turnover or more Royal Decree 439/2007 (for PIT) Royal Decree 1624/1992 (for VAT) Payment of money retained or held on account for personal income tax is done Ministerial on a monthly basis (as opposed to a quarterly basis) for companies with turnover Order in excess of EUR 6 million. EHA/586/2011 Up until EUR 10 For Corporate Income Tax: specific rules for amortization, reductions in taxable million turnover income and others apply to companies with turnover below EUR 10 million. Law 27/2014 December 2014 (for VAT) July 2015 (for PIT) July 2015 (for PIT) Nov-14 Notes (1) Marked with (*) if the applicable EU acquis defines thresholds in the corresponding policy area. (2) RDL: Royal Decree Law Source: European Commission There is a legal argument for reforming professions in Spain. Law 25/2009, which transposed the Services Directive, called on the government to submit a draft law to Parliament, within the year following its entry into force, spelling out which professions require membership in the relevant professional bodies. This legal mandate has not been fulfilled to date. 68 3.4. Product and services markets Graph 3.4.7: Forward linkage effects. Other business activity sector and total economy 5 4.5 4 3.5 average per company over 2008-13) is also low not only compared to Germany, Italy, Netherlands, UK and France combined (4.2) but also with the total economy (4.8). As indicated above, lower company size can contribute negatively to the sectors’ productivity growth. Graph 3.4.8: Changes in gross value added deflator by component in selected sectors. 3 2.5 2 % 8 1.5 6 1 4 0.5 2 0 IT ES UK Other business activities NL DE FR Total economy (1) Data refer to mid-2000. (2) Forward linkage measures the extent to which the sector’s output is used as inputs in other branches, thereby participating in other sectors’ production. Alternatively, the forward linkage of the professional services measures how much output rises in that sector from a unit increase in final demand of all other sectors. (3) Forward linkage in the professional services sector is proxied by the forward linkage of the 'other business activity' category. Source: European Commission from OECD STAN InputOutput database. The productivity of professional services in Spain is lower than in comparable countries. The professional services sector is smaller in Spain than in other large EU member states. It accounts for 4.2 % and 5 % of total value added and employment, respectively (vs 6.8 % and 7.0 % in Germany, France, Italy, Netherlands and UK, combined). Productivity levels in these services are also lower in Spain (Graph 3.4.6). Given the high contribution of the professional services sector to other sectors’ output (Graph 3.4.7), productivity improvements in the former are likely to trigger productivity increases in the latter. Some indicators could point to competitionconstraining regulation in the professional services sector. This is shown in high profit margin growth (relative to the entire economy; Graph 3.4.8) and high gross operating rates (Graph 3.4.9). Relatively higher rents are only partially translated into productive investment, as shown by comparatively low investment rates in the professional services sector (Graph 3.4.9). Lastly, company size (2.7 persons employed on 69 0 -2 -4 -6 ES EU5 Total ES EU5 Manufacturing ES EU5 ES EU5 Construction Professional services ES EU5 Wholesale & retail Unit labour cost (contribution) Profit margin (contribution) Change in gross value added deflator (1) Average data 2008-2013; (2) EU 5 = DE, FR, IT, NL, UK; (3) Professional services sector proxied by NACEs M_N categories: professional, scientific and technical activities; administrative and support service activities. Source: European Commission from Eurostat Spain is among the ten most restrictive Member States in retail establishment. This is according to a recent Commission assessment of retail establishment restrictiveness (82) Wage-adjusted labour productivity has been one of the lowest in the EU over the past few years and Spain also displays relatively high mark-ups.(83) The 2014 reform aims to ease establishment, expansion of retail outlets and liberalise shop opening hours. However, its benefits are conditional upon regional governments adopting the necessary implementing acts. (82) European Commission (2015): A Single Market Strategy for Europe – analysis and evidence. SWD(2015) 202 final (83) Anna Thum-Thysen and Erik Canton, Estimation of service sector mark-ups determined by structural reform indicators, Economic Papers 547, European Commission, 2015. 3.4. Product and services markets Graph 3.4.9: Gross operating rate, investment rate and number of persons employed per enterprise. Professional services vs. total business economy. % 25 20 15 10 5 0 ES EU5 Gross operating rate ES EU5 Investment rate Professional services ES EU5 Average company size Total business economy (1) Average values 2008-2013; (2) Gross operating rate is defined as gross operating surplus over turnover; (3) Investment rate is defined as investment over value added at factors cost; (4) Business economy includes NACE rev2 sectors B to N, S95, X and K, except financial and insurance activities; (4) Professional services sector proxied by NACEs M category: professional, scientific and technical activities. Source: European Commission from Eurostat. The Law on market unity Spain’s public administration is highly decentralised. This is illustrated by the share of spending managed by the regional and local government levels (39 % of total non-consolidated expenditure over 2018-14, compared with 44 % in Denmark, 38 % in Germany, 30 % in Belgium and 26 % in Austria). Legislative powers are currently set out in regions’ statute laws across a series of 111 areas grouped into 28 categories, the bulk of which are either exclusive to the regions or shared with the central government.(84) Regions have used their normative powers to date. For example, in 2015 there was a ratio of 5.7 regional ordinary laws in force per law adopted by the national parliament (Graph 3.4.11). lower competition and companies’ ability to benefit from economies of scale. ()()() The 2015 Doing Business indicators reveal considerable variations in business regulations and their implementation in Spain. The survey benchmarks the ease of doing business across Spain’s 17 autonomous regions in selected areas such as time, cost and number of procedures needed to i) start a business, ii) get electricity, iii) get construction permits, iv) register property and v) start up an industrial SME (Graph 3.4.11). The results show that the dispersion in regions’ distance to frontier, a measure of performance, in starting a business, getting construction permits and registering property is higher in Spain than in Poland (Poland being the other EU country for which there is comparable data for 2015 on the ease of doing business at sub-national level). More importantly, the dispersion in getting construction permits across Spanish regions is larger than the dispersion across euro area countries, whereas in getting electricity, it is close to it (Graph 3.4.12). Furthermore, on average, it takes six procedures and 117 days to start an industrial SME. This is at least twice the time and three times the cost that it would take in thirteen other EU Member States. Graph 3.4.10: Spain. Cumulated number of ordinary laws in force and cumulated number of powers devolved to regions, 1980-2015 7000 6000 5000 4000 3000 2000 1000 0 80 85 90 95 00 05 10 15 regional parliaments Substantial differences in business regulations across regions generate transaction costs for entrepreneurs. They can also segment markets, national parliament powers devolved to regions Source: European Commission from Boletín Oficial del Estado (BOE) and Ministry of Finance. (84) http://www.seap.minhap.gob.es/web/areas/politica_a utonomica/Estatutos_Autonomia/estatutos_materias.html There is room for improving regional business licencing through exchanges of good practices. 70 3.4. Product and services markets In the 2015 Doing Business indicators, virtually all regions obtain an above-average score in at least one area, implying that almost all have good practices that they can share with others. Indeed, if Spain performed as its best region under each indicator, it could jump from its current position (33rd) to 24th in the World Bank’s ranking with regard to the ease of doing business. However, in some cases, the best Spanish practice is not competitive globally; the highest potential for improvement can be achieved by reducing time and cost to get construction permits and electricity connections and supply. At the country level, the 2016 edition of Doing Business ranks Spain 33 rd in terms of ease of doing business (Spain ranked 34 th in 2015). In spite of progress made, Spain underperforms the EU average in 6 of the 10 analysed indicators. For instance, starting up a business requires more time and procedures than in the EU average, the cost of getting a construction permit more than doubles that of the EU and for getting electricity and registering property is 75 % higher. obstruct the free movement of goods and services and the establishment of economic operators throughout Spain. It also aims to simplify existing legislation for economic activities (including at regional level) and minimise administrative burdens by means of better regulation criteria. Indeed, empirical evidence shows that the regulatory activity of the Spanish regions has costs in terms of lower productivity growth( 85) and in terms of lower regional innovation and proportion of employees working for companies with 200 employees or more.(86) Greater regulation at regional level in the retail sector may be associated with higher inflation, lower employment in the sector and greater commercial density.( 87) Graph 3.4.12: Standard deviation of distance to frontier in selected Doing Business indicators. 16 14 12 10 Graph 3.4.11: Summary results of Doing business subnational in Spain 08 06 04 02 00 Starting a business Dealing with construction permits PL ES Getting electricity Registering property EA (1) PL: Polish regions. ES: Spanish regions; EA: Euro area countries. Source: 2015 World Bank Doing Business, Doing Business regional (Spain and Poland) and European Commission. (1)The ranking is calculated on the average value of the distance to frontier indicator of the following four doing business indicators: starting up a business, getting construction permits, getting electricity and registering property. Best ranking=1; lowest ranking=19. Source: European Commission from World Bank. 2015. Doing Business in Spain 2015. Washington, DC: World Bank The 2013 law on market unity addresses regulatory fragmentation and good regulation in Spain. It aims at removing measures that may 71 The implementation of the law on market unity by regional governments is critical to its success. However, this is being done slowly at this level, judging from progress made in adapting (85) Zárate-Marco, A, Vallés-Giménez, L., ‘The cost of regulation in a decentralised context’. (2012) European Journal of Law and Economics (2012). (86) Marcos, F. Santaló, J. ‘Regulation, innovation and productivity’. (2010) IE Business School’ Working Paper WP10-04. (87) Matea, M. and Mora-Sanguinetti, J. ‘Developments in retail trade regulation in Spain and their macroeconomic implications’. (2010) Bank of Spain. Working Document 908. 3.4. Product and services markets sector specific regulations to eliminate inconsistencies with that law and on reaching agreements to develop simplified regulatory frameworks. On the former, regional governments are much less advanced in adapting legislation than the central government (see Annex A overview table). On the latter, there are difficulties in speeding up the adoption of agreements enforceable upon all regions, even if there is a critical mass of regions backing those in the interest of simplification and market unity. The reason is that every region can veto reform proposals on areas falling under their shared or exclusive powers. Nevertheless, recent changes brought about by the law on Spain’s public administration legal framework set out the possibility for sectoral conferences - i.e., bodies with central and regional government representatives - of issuing recommendations on policy matters. Regional governments adhering to those agree to their implementation. New restrictions on access to and exercise of economic activities are appearing in recent regional legislation. For example, Spain’s Competition Commission has noted that new regional legislation in the area of the collaborative economy (such as on car rentals and rentals of apartments and housing for tourist use) imposes unjustified and disproportionate burdens (e.g. obligation of the service provider to have a specific company form, licences granted depending on the result of economic needs tests, etc.).(88) This illustrates the double challenge of preserving market unity and fostering better regulation in Spain, in that it requires assessing and simplifying the stock of existing regulations and the flow of new legislation. Energy and climate change Spain’s high dependence on imported energy has a significant impact on its current account. (88) See: i) IPN/CNMC/007/15 on the Royal Decree of Aragon for the regulation of dwellings for touristic use; ii) IPN/CNMC/0012/15 on the regulation related the provision of hire-car with driver services; iii) CNMC Position on the Canary Island draft regulation of dwellings for touristic use. http://www.cnmc.es/CNMC/Prensa/TabId/254/ArtMID/66 29/ArticleID/1433/La-CNMC-requiere-al-Gobierno-deCanarias-que-suprima-o-modifique-distintos-art237culosde-su-reglamento-de-viviendas-vacacionales.aspx) According to Eurostat, Spain imported 70.5 % of its energy consumption in 2013, far above the EU average of 53.2 %. Furthermore, net imports of energy products represented 2.9 % of GDP in 2014, compared to the EU average of 2.4 %. This makes the country more susceptible to energy price and supply shocks, despite its welldiversified energy mix. Spain’s domestic energy production comes mainly from nuclear power generation and renewable energy sources (RES), and in addition it has a small subsidized domestic production of hard coal. With regard to energy efficiency, the trend of declining primary and final energy intensity has slowed down after 2009. As part of the response to the Energy Efficiency Directive, Spain has adopted the National Energy Efficiency Action Plan. Improving energy efficiency and developing further RES could contribute to reducing Spain’s reliance on imported energy. Renovation of the building stock is also an opportunity to improve energy efficiency and to create jobs. The completion of electricity and gas interconnectors with France is crucial for ensuring security of supply and improved functioning of energy markets. The new underground electricity interconnector between France and Spain (Baixas — Santa Llogaia), operational since September 2015, will double the existing interconnection capacity to 2.8 % of the installed generation capacity in Spain. On the basis of current plans Spain will fall short of its 2020 interconnection target of 10 % set by the Council. Insufficient interconnection capacity limits security of supply, prevents RES production from reaching its full potential, and represents a barrier towards price convergence with neighbouring countries, which, in turn, has a negative impact on consumers. As far as the gas market is concerned, Spain has six liquefied natural gas terminals and a seventh regasification plant was completed in 2012. Gas interconnection with France was upgraded in 2013 with a reverse flow facility, but the low interconnection capacity between the Spanish and French gas systems still hampers a full integration of the Iberian gas market into the Western European market. Spain is on track to reach its 2020 renewable energy target, but more efforts ahead of 2020 are crucial. Recent reforms to address the electricity tariff deficit have led to a slowdown in 72 3.4. Product and services markets the investment in renewables and selfconsumption. The share of RES in total energy consumption slightly increased in 2013 and 2014, but mainly due to lower energy consumption. Regulatory certainty and investor confidence are crucial to further promote RES, and there is a risk that current policies would not be sufficient to meet RES objectives. In December 2015, a Royal Decree was adopted to increase consumption of biofuels to achieve the 10 % target of RES in transport by 2020. Moreover, according to the most recent national projections, Spain is expected to reach its greenhouse gas (GHG) target in sectors not covered by the emissions trading scheme (ETS). Under the Europe 2020 Strategy, Spain has committed to reducing the GHG emissions in nonETS sectors by 10 % between 2005 and 2020, but thanks to existing measures a decrease of 12 % is forecasted. The strategy on alternative fuel vehicles adopted in July 2015 can support the goal of reducing GHG and pollutant emissions. The risk of contingent liabilities for public finances stemming from the electricity and gas systems has been reduced. The reforms implemented in 2013 and 2014 to stop the accrual of the electricity tariff deficit have brought the electricity system closer to financial balance. The system may record a small operating surplus in 2015 if current trends in demand continue. Moreover, a substantial reduction in the gas tariff deficit has been possible thanks to the measures taken in 2014. In 2015, the system’s revenues were also boosted by dry and windless weather, which resulted in higher demand for gas for electricity generation than in 2014. The gas tariff debt of around EUR 1.1 billion accumulated prior to 2014 is predicted to be recovered from customers over a 15-year period. Compared with other EU Member States, consumers in Spain bear the burden of high pre-tax automotive fuel prices. This might be due to high concentration in the fuel refining and distribution sector, the high level of vertical integration between supply, refining and retail activities, and the low market share of low-cost fuel retailers. CNMC, the competition authority, published a report revealing the persistence of barriers to entry and expansion of new entrants in 73 the wholesale fuel market.(89) Following the publication, several vertically integrated companies operating in the sector have sold their stakes in the operator of the fuel transport network. Transport Spain has extensive motorway and high-speed rail networks. Spain seems to have given higher priority to increasing geographical cohesion than to improving efficiency of its transport system. Investment policies have been focused on extending infrastructure rather than on maintenance. They have favoured the passenger transport network to the detriment of rail freight, or connectivity of production poles with consumption and export sites and bordering markets. The Spanish high-speed rail (HSL) network is the longest in the EU, however it generates relatively limited passenger traffic flows (see Graphs 3.4.13 and 3.4.14). Investment plans continue being focussed on extending HSL, and they still include HSL and motorways in areas with little traffic. There is a significant risk that some of the new HSL will not generate sufficient revenues to cover their operating costs.(90) Meanwhile, profitability of railway lines could be increased by larger use of freight transport, thus it is important that HSL are adapted to mixed passenger and freight traffic. A detailed plan to deploy UICgauge lines and improve interoperability of freight corridors is still missing. Mechanisms to ensure better strategic planning of transport infrastructure have been introduced, but some of them remain weak. First, an advisory council for infrastructure, a body issuing non-binding opinions on major future infrastructure projects, was established in July 2015. The operational independence of the council is weak and depends primarily on resources from the Ministry of Public Works. Second, the new law on railways, adopted in September 2015, revises instruments of strategic planning of infrastructure and reviews rail access charges. In particular, the elimination of the annual network access fee is supposed to reduce fixed costs of railway (89) CNMC, Study of the wholesale automotive fuel market in Spain, 24 June 2015. (90) O.Betancor, G. Llobet, Contabilidad Financiera y Social de la Alta Velocidad en España, FEDEA, 20 March 2015. 3.4. Product and services markets operators, thus lowering entry barriers for new operators. It is unclear, however, how the new framework would prevent overinvestment in railway infrastructure. Third, the new law on highways, adopted in September 2015, intends to improve the coordination between public administrations in road and urban planning, extends the application of cost-benefit analysis of new infrastructure projects, and promotes competition in the fuel distribution sector. Finally, in October 2015, a more balanced risk-sharing between the state and concessionaires was introduced in concession contracts. If a concessionaire is responsible for terminating the concession, the value to be recovered will be established in a new tender, thus reflecting the market value of the concession, and not the costs incurred by the concessionaire. Graph 3.4.14: Number of passenger-kilometres per kilometre of HSL network in Spain compared to other countries, 2013 millions 25 20 15 10 5 0 FR Graph 3.4.13: High-speed line (HSL) network in Spain compared to other EU countries, 2014 ES=1 1.4 1.2 HSL per million inhabitants 1.0 0.8 0.6 0.4 0.2 0.0 DE IT ES BE NL The digital economy Density of HSL network FR IT Source: European Commission, Union Internationale des Chemins de Fer, national sources Length of HSL network ES DE BE NL Density of HSL network is calculated per unit of area. Values for FR, DE, IT, BE and NL are relative to values for ES. Source: European Commission, Union Internationale des Chemins de Fer, national sources A fund to improve land access to maritime ports was established in July 2015. The fund is financed by contributions from main ports and will focus on improving railway (and to a lesser extent road) connections. Nevertheless, the system of port charges is complex and non-transparent, and ports still do not have sufficient autonomy in their charging policy. Moreover, according to the CNMC, there is lack of competition in the provision of services within ports. Some regulatory improvements have been observed, but the relatively low level of digital skills hampers development of the digital economy in Spain. Spain has recently increased access to fast broadband (particularly fibre) networks and supply of digital services, especially in the public sector. However, fast and ultrafast broadband subscriptions continue to lag behind, and unsatisfactory levels of digital skills and universal digital literacy (e.g. 53.9 % of people aged 16-74 in Spain show basic digital skills, compared to an EU average of 55.3 %) limit economic benefits of investment in information and communication technologies (ICT) by firms and public authorities. In addition, big disparities in fast and ultrafast broadband coverage between regions persist, rural areas being particularly affected. Spanish SMEs do not exploit sufficiently the potential of cross-border internet sales. From 2015, electronic invoicing has become obligatory for all suppliers dealing with the central public administration for invoices higher than EUR 5 000, thus limiting scope for fraud. The law on administrative procedure, revised in October 2015, promotes e-government by making it compulsory for firms to deal electronically with public administration services. 74 3.4. Product and services markets Environment Decoupling economic growth from water use remains a challenge in Spain.(91) Spain is a water-stressed country, meaning that water demand exceeds the available water resources under sustainable conditions. At the same time, water tariffs are slightly lower than the EU average and there are large variations between cities and regions. An adequate water-pricing policy to recover the cost of water services, together with promotion of wastewater reuse, higher transparency of prices and subsidies, as well as better control of water abstraction, could all harness water saving potential, especially in the agriculture sector, the major consumer of water. There is also scope for a more efficient use of water supply infrastructures. Finally, flood prevention measures are often disregarded, despite being cheaper than the costs of flood recovery. There is scope for improving the efficiency of the Spanish economy in the use of resources. Innovative measures to reduce the use of resources and energy can increase savings of small and medium enterprises and improve their competitiveness. Moreover, a still high proportion of municipal waste in Spain is landfilled (around 60 % in 2013, compared to the EU average of 31 %), so that the country is far from reaching the 50 % recycling target by 2020 and moving to an economic model with a more circular use of resources. Finally, personal transport exacerbates seasonal problems with air quality and traffic congestion in major Spanish cities, leading to health and economic costs. (91) Study ‘Analysis of the potential for growth and job creation through the protection of water resources’. DG ENV 2015. 75 Several regulatory features contribute to low productivity in Spain. This chapter shows a link between Spain’s small company size and productivity developments, as smaller companies in Spain have lower productivity levels relative to larger ones and to smaller firms in comparator countries. Firm growth in Spain, combined with improvements in policy variables such as human capital, innovation, technology, access to finance and judicial efficacy, could spur aggregate productivity. The implementation of the market unity law could also benefit firms’ productivity, help firm grow and allow companies to exploit economies of scale in a single market. Moreover, productivity increases in the professional services sector are likely to improve productivity in other sectors that use those inputs, as the output of the former is largely used in the production of the latter. Some challenges remain in the areas of energy, transport and environment. The interconnection capacity with the rest of Europe restricts the capacity of renewable sources to reach their full potential. Some steps have been taken to provide for a more stringent cost-benefit analysis of transport infrastructure projects, but there is no certainty that redundant or unnecessary investment will be avoided in the future. The Spanish economy has not been successful in decoupling economic growth from water use. 3.5. PUBLIC ADMINISTRATION, FISCAL FRAMEWORKS AND TAXATION Public administration and judicial system Recent legislative reforms are intended to improve efficiency and quality of the justice system, in particular the management of resources. According to the 2016 EU Justice Scoreboard (to be published), despite some improvement, perception of independence remains low and the length of judicial proceedings is high for litigious civil and commercial lawsuits. First, new legislation has been introduced to free resources by taking non-litigious matters out of the courts and promoting alternative dispute resolution mechanisms, including conciliation. Second, measures have been taken to improve the distribution of tasks between courts based on their workload. Third, procedural laws have been reformed, notably to generalise the use of information and communication technology tools.(92) The efforts to modernise the judicial system and reduce length of proceedings are welcome, but it is still too early to assess the impact of the reforms. Some particular aspects have raised concerns about the independence of the judiciary.(93) Regarding digitalisation reforms, the lack of adequate human and material resources and the coexistence of different methods is an obstacle for rapid and uniform implementation. There has been progress in the area of transparency of administrative decision making and the fight against corruption. With all legislative measures of the September 2013 package for democratic renewal now in place (covering among others measures to increase the transparency of party financing, asset disclosure, and tackling conflicts of interest), Spain has a stronger legal framework for integrity in the public sector and for fighting corruption. However, the recent surge in criminal investigations of corruption cases at regional and local level( 94) has (92) Law 15/2015 on voluntary jurisdiction, Constitutional law 7/2015 on judicial power and Law 42/2015 reforming the civil procedural law. 93 ( ) See 2015 Situation report N°2 on the judiciary and judges in the Council of Europe Member States, Consultative Council of European Judges (CCJE), http://www.coe.int/t/dghl/cooperation/ccje/cooperation/def ault_en.asp (94) See the 2015 Report of the Special Public Prosecutor’s Office against Corruption and Organised Crime https://www.fiscal.es/memorias/memoria2015/FISCALIA_ SITE/index.html. not triggered the development of prevention strategies at levels below that of the central government. Furthermore, as noted by the first EU Anti-corruption Report, the rules on asset disclosure and conflicts of interests vary across levels of government and categories of officials. While the powers of the Office of Conflicts of Interest have been increased, some other elements (e.g., its formal attachment to the Ministry of Finance and Public Administration) may undermine its independence and ability to apply sanctions. In addition, Spain does not have dedicated legislation protecting whistle-blowers, other than in the areas of unfair dismissal and discriminatory treatment of employees. Lastly, lobbying is unregulated in Spain; there is no mandatory registration or obligation of public servants to report contacts with lobbyists, thus reducing transparency in this field. A high number of outstanding procurementrelated infringements against Spain has been recently observed. Over 2009-2015, the Commission launched eight infringements and investigations related to presumed breach of EU public procurement rules by Spain (excluding cases dealing with European Structural and Investment Funds). This number places Spain among the worst performers in the EU. Most of these cases deal with sub-central governments, which account for the lion’s share of contract award notices (40 % in 2014 vs 15 % by the central government). Spain stands out for a relatively low publication rate of contract notices. They represented 1.8 % of GDP in 2014, compared with 4.4 % in the EU, which ranks Spain 23rd out of 28 countries. It also stands out for a relatively high use of the negotiated procedure without prior publication (10 % of all award notices vs. 5 % in the EEA, ranking: 22 of 31 countries). This translates into limited competition from undertakings from other EU countries and frequently, into direct awards, with expensive consequences for the public budget.(95) Other issues, as highlighted by Spain’s (95) See report of the National Commission for Markets and Competition (PRO/CNMC/001/15) also estimated that the absence of competition could cause an increase of 25 % in the public procurement budget, which, in absolute numbers, could amount to 4.6 % of the yearly GDP or approximately EUR 47.5 billion. 76 3.5. Public administration, fiscal frameworks and taxation Court of Auditors, include a systematic use of contract changes, the splitting of contracts into smaller ones, an excessive use of urgent procedures, insufficient justification of some decisions taken by the procurement authorities during the procurement cycle (i.e. design, tender and execution), as well as often unclear tender documents and administrative decisions.(96) Overall, the lack of a coherent public procurement policy at all government levels and insufficient coordination among them is a matter for concern. Insufficient control mechanisms hinder the implementation of public procurement rules and may create opportunities for corruption.( 97) Taxation In 2015, Spain started to implement the tax reform adopted in 2014. The reform focuses on personal income taxation (PIT), where tax rates and the number of tax brackets have been reduced and tax allowances redesigned. It also reduces the corporate income tax rate, while broadening its tax base. The reform is to be phased in over 20152016. In July 2015, Spain decided to bring forward the reduction of the PIT originally planned for 1 January 2016 to 1 July 2015, arguing that increased tax revenue as a result of the economic recovery creates room for bringing forward the tax cuts. Without including the second-round effects, the government estimated the ex ante fiscal cost of the PIT reform, once fully implemented, to be almost EUR 6 billion, or 12 % of total tax revenue from PIT in 2014. This is in line with the results of the simulations conducted by the European Commission Joint Research Centre based on the EUROMOD model (See Box 3.5.1) (98).These simulations also show that, despite its progressive (96) See the report by the Spanish Court of Auditors concerning the year 2012 (Informe de fiscalización relativo a la contratación del sector público estatal celebrada durante el ejercicio 2012, published in the State Official Journal of 23 October 2015). (97) According to respondents to FLASH EB 428 Business attitudes towards corruption (http://ec.europa.eu/COMMFrontOffice/PublicOpinion/ind ex.cfm/Survey/getSurveyDetail/instruments/FLASH/surve yKy/2084), 56 % of Spanish business representatives who have participated in a public tender recently say that corruption has prevented their company from winning a procurement procedure, and practices such as abuse of negotiated procedure (67 %), tailor-made specifications (60 %) and collusion of bidders (52 %) are reported to be widespread. (98) 2015 Draft Budgetary Plan of Spain. 77 design, the reform has a very limited impact on the high level of income inequality, and may even contribute to increase it slightly. Spain raises roughly equal shares of revenues from direct taxes, indirect taxes and social contributions. Since 2011, indirect taxes have seen their share in Spain’s overall tax revenue increase. This is mainly due to the increases of VAT rates in 2010 and 2012, and, more recently, the recovery of private consumption. In 2014, indirect taxes represented more than one third of total taxes, and with the tax reform lowering direct taxation, this share is likely to increase further. However, the level of indirect taxation in Spain remains one of the lowest in the EU — at 11.6 % of GDP in 2014. In the same year, the implicit tax rate on consumption was 15.2 %, the second lowest in the EU. The implicit tax rate on labour was 32.2 %, somewhat below the EU average of 36.4 %. Environmental taxes amounted to only 1.86% of GDP in 2013, despite increases in recent years. These increases include inter alia higher excise rates for certain types of oil and gas and a new tax on fluorinated greenhouse gases. The report issued in February 2014 by the government-appointed Committee of experts on the reform of the Spanish tax system made specific recommendations to harmonise and improve the performance of environmental taxes in Spain. These recommendations were not followed up on in the tax reform approved in 2014. In 2013, Spain recorded the largest VAT policy gap in the EU (at 53.9 % compared to the EU average of 47.2 %). The policy gap is an indicator of the VAT revenue theoretically foregone by applying non-standard rates to some goods and services, expressed as a share of revenues that would be collected if everything was taxed at the standard rate. Spain applies a super-reduced VAT rate of 4 %, a reduced rate of 10 % and a standard rate of 21 %, giving rise to a significant VAT policy gap. The VAT compliance gap, i.e. the difference between the theoretical VAT liability and the revenue actually received, as a percentage of the former decreased slightly from 2012 to 2013. Further improvements are to be expected following a concerted effort to address the compliance issue, as described below. 3.5. Public administration, fiscal frameworks and taxation Property taxation relies to a relatively high degree on transaction taxes rather than recurrent taxes. The transaction tax rate is around 7 %, above the EU average, whereas recurrent taxes on property, at 1.2 % of GDP, are below the EU average of 1.3 % in 2014. No major policy changes have been introduced in the area of property taxation in recent years. From a theoretical point of view, recurrent property taxes are considered among the taxes least detrimental to growth and preferable to transaction taxes, as the former allow a more efficient allocation of assets, as well as higher labour mobility. The Spanish tax system features elements that can hinder investment. Investment as measured by gross capital formation dropped sharply during the crisis (from 31 % of GDP in 2007 to 19.6 % in 2014 — see Section 2.4). The effective marginal and average tax rates on non-financial corporations are still relatively high, at 38.6 % and 32.9 % in 2015, respectively.(99) The effective marginal tax rate, i.e. the tax on the last euro invested, is particularly important as it affects how much additional investment companies will make. In addition, a high debt bias in corporate taxation can hamper the development of equity markets. In Spain, the difference between the pre- and post-tax cost of capital for equity is larger than the same difference for debt-funded investment, with the gap being the third-largest in the EU in 2015. The reduction of the corporate tax rate planned for 2016 from 28 to 25 % should reduce this gap. Spain has intensified its fight against tax fraud and avoidance. In 2015 the Tax Administration focused on the control of internet domains, electronic commerce and illegal trade taking place through the web and intensified the use of IT auditing tools. Country by country reporting obligations were imposed on international corporate groups. Early detection of organized VAT fraud has been reinforced and coordination initiatives have also been strengthened. In addition, the General Tax Code was reformed in September 2015 with measures specifically addressing tax evasion and avoidance. A new electronic VAT filing system for invoices is foreseen for 2017. Other measures will increase the tools of the Inland Revenue Service when assessing taxes with a view to discovering tax fraud. Fiscal framework Since 2012, Spain's fiscal framework has been strengthened. The 2012 Stability law introduces important changes in Spain’s legislation, such as the definition of medium term budget objectives and a spending rule, along with mechanisms to ensure their observance by the relevant public administration. The law was amended at the end of 2013 to among other things, enhance the controls over each general government level commercial debt. Recent policy developments aim to further increase transparency and accountability in regions’ public finances. These are in addition to the publication since 2013 of monthly regional budget execution data in national account terms. By way of illustration, in October 2015 the Ministry of Finance issued guidelines to help regions to apply the stability law’s spending rule. In February 2016, it plans to start publishing detailed data on regional governments’ spending on health and pharmaceuticals. Compared with last year, there has also been progress in the preparation of regional government’s multiannual budget plans starting in 2016, with among other things, specification of revenue and expenditure for the years covered. In spite of considerable progress made, improvements in other related areas have been less noticeable. For example, a majority of regional governments keep failing to include in their draft budgets and general accounts for 2016 information on the entirety of regional entities coming within the scope of the stability law. While Spain’s General Comptroller (IGAE) makes the necessary adjustments to ensure that the budget information in national account terms factors in all entities falling within the scope of the general government, this omission reduces the completeness of regional budget laws. (99) ZEW (2015) data. 78 3.5. Public administration, fiscal frameworks and taxation Box 3.5.1: PIT reform – EUROMOD simulations The Spanish personal income tax (PIT) reform adopted in 2014 aims at reducing the tax liabilities for most taxpayers, with reductions in tax rates and increases in allowances. Simulations of the impact of the reform on general income (all income except savings income) conducted by the European Commission Joint Research Centre based on the EUROMOD model show that almost 60% of the households are affected by the reform. The only households that are not affected are (i) those with zero PIT liability before and after the reform and (ii) households that paid no tax before the reform but received and will keep receiving the working mother tax credit, but are not entitled to claim any of the new tax credits. Table 1 shows average disposable household income by decile before and after the PIT reform, and the corresponding changes. The reform increases the average disposable income for households by 1.4%. Overall, ex-ante (i.e. before taking any second-round or behavioural effects into account) the reform reduces tax revenues by 6 billion euro, almost 12% of the tax revenue in 2014.1 Table 1: Average disposable household income by decile Source: European Commission, Joint Research Centre, based on the EUROMOD model. Overall, the tax reform made PIT more progressive, meaning that liabilities from income taxes after the reform are more concentrated in relation to gross income than before. However, the redistributive power of taxation does not only depend on the concentration of taxes, but also on the overall tax level (i.e. the total amount of money that is redistributed through taxation). In this particular case, the increase in progressivity is more than offset by the significant reduction in total tax revenues. In other words, the tax reduction reduces the ability of the tax system to make after-tax incomes more equal even with higher progressivity (See Table 2). 1 In EUROMOD, uprating factors are used as discount factors to adjust monetary dataset variables to the price level of the year for which the tax system is analysed. This update is necessary because the input data files to EUROMOD are currently based on EU-SILC (European Union Survey on Income and Living Conditions) 2012 survey data, which may not correspond with the most recent (simulated) tax benefit system. Therefore, the uprating factors allow for time consistency between the monetary variables of the survey and the tax system under analysis. (Continued on the next page) 79 3.5. Public administration, fiscal frameworks and taxation Box (continued) Table 2: Inequality, progressivity and redistributive effect (1) The Kakwani Index is calculated as the difference between the degree of inequality of tax liabailities and the degree of inequality of pre-tax income. The higher the value, the more progressive the tax system is. (2) The Reynolds-Smolensky index is calculated as the difference between the degree of inequality of pre-tax income and the degree of inequality of after-tax income. It can also be calculated as the Kakwani index multiplied by the net average rate (minus a usually small re-ranking effect). The higher the value, the more redistributive the tax system is. Source: European Commission, Joint Research Centre, based on the EUROMOD model. In a similar way, a considerable number of regional governments (8 of 13 regions assessed in the ministry of finance’s annual report on the regions’ budgets for 2016) failed to include in their budget laws for 2016 enough information on the eligible expenditure to allow verification of compliance with the above-mentioned spending rule. Moreover, while public accounting rules are, broadly speaking, similar across regions, there are in some cases differences in the treatment of specific transactions. There are also variations across regions in the definition of budgetary codes, budgetary documents, accompanying tables and budgetary structures that hinder their comparability. These differences do not affect the consistency of regional deficit data in accrual terms (used for Excessive Deficit Procedure purposes). However, a greater degree of convergence of budgetary and public accounting practices at regional level would facilitate the comparison and consolidation of budget data in cash terms. Furthermore, there is no common timeline for the submission of regional governments’ budgets to the respective regional parliaments, which can range from October until December of any given year. This makes the assessment of regional government measures reported in the draft budget plan (with a cut-off date of 15 October) more cumbersome, given uncertainties surrounding their specification in regions’ budget laws. final Lastly, access to the regional liquidity fund is subject to conditions, the observance of which is monitored by the Ministry of Finance on a monthly basis. However, unlike for the follow up reports of regions’ economic and financial plans, the Spanish law does not mandate the Ministry of Finance to publish the regional liquidity fund’s monitoring reports. Spain’s fiscal framework includes tools to prevent and correct deviations from fiscal targets. The 2012 Stability law introduces an early-warning mechanism so that the necessary early corrective action can be taken in the event that there is found to be a risk of non-compliance with stability, public debt or spending rule targets. If no action is taken, the appropriate corrective and enforcement measures will be applied. The experience of the past few years shows however, that there is scope to make greater use of those tools, especially at regional level. For example, 13 of 17 regional governments failed to reach the deficit targets for 2014 and were therefore called on to submit an adjustment plan to correct the slippage. However, only one adjustment plan (for the period 2015-16) was adopted in 2015 by the Financial and Fiscal Policy Council (Table 3.5.1). This was due, albeit in part, to the time needed by the 12 other regions to form new governments following the 2015 regional elections. Moreover, the Ministry of Finance’s staff follow-up reports 80 3.5. Public administration, fiscal frameworks and taxation Table 3.5.1: Implementation of the Stability law’s corrective measures in 2014 and 2015 2015-2016 EFPs (to correct fiscal slippages in 2014) Actual timeline 2014-2015 EFPs (to correct fiscal slippages in 2013) Legal timeline (BSOL) Non-compliant regional government 1. Starting point 2. Drawing up and approval of regions' corrective plans -i.e., Economic and Financial Plans (EFPs) Ministry of Finance's report on the level of regions' compliance with stability targets 2.1 Independent Fiscal Institution's (AIReF) report on regions' EFPs Before 15 April / 15 October of the corresponding year Before submission to the Financial By mid-May of the By mid-July of the and Fiscal Policy corresponding year corresponding year Council (FFPC) 3. Publication of the Ministry of Finance's quarterly monitoring reports on the implementation of region's Economic and Financial Plans 2.2 Submission of 2.3 Approval of EFP EFPs to the by the Financial Reference period: Financial and Fiscal and Fiscal Policy 3rd quarter 2014 Policy Council Council (FFPC) (FFPC) Reference period: 4th quarter 2014 Reference period: 1st quarter 2015 Reference period: 2nd quarter 2015 Reference period: 3rd quarter 2015 Dec-14 Apr-15 Jul-15 Oct-15 Dec-15 Aragon 11-Apr-14 28-Jul-14 31-Jul-14 31-Jul-14 12-Feb-15 16-Jun-15 15-Jul-15 18-Jan-16 - Murcia 11-Apr-14 28-Jul-14 31-Jul-14 23-Dec-14 - 16-Jun-15 15-Jul-15 18-Jan-16 - Valencia 11-Apr-14 28-Jul-14 31-Jul-14 23-Dec-14 - 16-Jun-15 15-Jul-15 18-Jan-16 - Castilla la Mancha 11-Apr-14 28-Jul-14 31-Jul-14 23-Dec-14 - 16-Jun-15 15-Jul-15 18-Jan-16 - Catalonia 11-Apr-14 28-Jul-14 31-Jul-14 23-Dec-14 - 16-Jun-15 15-Jul-15 18-Jan-16 - Cantabria (*) 24-Oct-14 22-Dec-14 23/12/2014 (*) 23/12/2014 (*) 16-Jun-15 15-Jul-15 18-Jan-16 - Aragon 24-Apr-15 03-Dec-15 - - - - Murcia 24-Apr-15 27-Jul-15 - - - - Valencia 24-Apr-15 03-Dec-15 - - - - Castilla la Mancha 24-Apr-15 03-Dec-15 - - - - Catalonia 24-Apr-15 8-Jul-2015 29-Jul-15 29-Jul-15 18-Jan-16 - Cantabria 24-Apr-15 03-Dec-15 - - - - Andalusia 24-Apr-15 03-Dec-15 - - - - Asturias 24-Apr-15 27-Jul-15 - - - - Baleares 24-Apr-15 Not submitted to AIReF - - - - Castile-Leon 24-Apr-15 27-Jul-15 - - - - Extremadura 24-Apr-15 03-Dec-15 - - - - Madrid 24-Apr-15 8 Jul 2015 - - - - Rioja 24-Apr-15 29-Jul-15 - - - - Timeline according to Spain’s Budget Stability Organic Law: Region’s Economic and Financial Plans (EFPs) are submitted to the Financial and Fiscal Policy Council (FFPC) within a maximum of one month from the date on which the non-compliance is reported by MoF (i.e. before mid-April or midOctober each year). The submission of EFPs to FFPC follows a report from Spain’s Independent Fiscal Institution (AIReF). EFPs are approved by the FFPC within a maximum of two months following their submission. EFPs must be set in motion not more than three months after the date on which the non-compliance is reported by MoF. The MoF draws up a quarterly follow-up report on the implementation of the measures contained in the current EFP and publishes those reports. There is no legal deadline for the publication of the MoF quarterly reports, although in the interest of time, they should be issued shortly after the quarterly budget execution data are released (to note; in any given year, quarterly budget execution data for Q1, Q2, Q3 and Q4 are available in June, September, December and March of the subsequent year, respectively). (*) The slippage with the 2013 deficit target for Cantabria was identified by the Ministry of Finance in mid-October 2013. The submission and approval of Cantabria’s 2014-2015 Economic and Financial Plan was done on time. Source: European Commission on the implementation of the existing adjustment plans (referring to 2014-15) have been published with some delay, thus reducing available time for the central government to request the implementation of the measures suggested in those reports(100) and for regions, to execute them. Furthermore, up until November 2015 (i.e. the latest available budget execution data at the time of writing) the regional public deficit stood at 1.3 % of GDP. This was above the 0.7 % deficit objective for 2015 thus pointing to a clear risk of non-negligible deviation by year-end. Despite the recommendations made by Spain’s independent fiscal institution (Independent Authority for Fiscal Responsibility -AIReF), no preventive measures set out in Spain’s stability law have been applied in 2015 on regions at risk of non-compliance. (100) See http://www.minhap.gob.es/Documentacion/Publico/Portal Varios/FinanciacionTerritorial/Autonomica/PEFCCAA/Inf orme%20de%20Seguimiento%20de%20los%20PEF%2020 15.%20Primer%20Trimestre.pdf 81 Spain’s fiscal framework also includes tools to underpin the sustainability of regional expenditure growth. In 2015 the central government has increased the subsidisation of regional governments’ interest expense (implying EUR 3.2 billion savings for regions in that year). However, regional governments have failed to use this windfall to reduce their deficits decisively. The fall in interest spending has been offset by considerable increases in expenditure categories under their control, thus slowing down the pace of fiscal consolidation (Graph 3.5.1). In 2016, deficit reduction at regional level will be assisted by increased revenues from the regional financing system (additional EUR 7 billion compared with 2015). Against this backdrop, and as tax revenues recover, observance of Spain’s stability law’s expenditure rule (together with the deficit target) can underpin consolidation, by among other things, avoiding that extra revenues are entirely spent. The implementation of a spending rule on regional governments in the past would have helped in containing expenditure growth and ceteris paribus, 3.5. Public administration, fiscal frameworks and taxation recording lower deficits until 2009. Between 2009 and 2014, exact observance of the maximum level of eligible spending set by expenditure rule, would not have been enough to deliver the observed reduction in the regions’ public deficit. (Graph 3.5.2) Graph 3.5.1: Regional budget execution in 2015: contributions to expenditure growth y-o-y% 6 5 4 3 2 1 0 -1 -2 -3 -4 14 15 14 15 14 15 June September November Total expenditure (excl. interest expense and transfers to other public administrations) Interest expense Total expenditure growth (excluding transfers to other public administrations) Source: IGAE and European Commission calculations Secondly, AIReF’s right of access to information has been weakened, relative to the provisions of AIReF’s organic law, following the approval in July 2015 of a ministerial decision on this matter.(101) Compared with AIReF’s law, the ministerial decision requires AIReF to channel all requests for information through the Ministry of Finance, thus preventing AIReF from contacting other public administrations directly. It also increases (relative to AIReF’s organic law and statutes) the number of cases where the Ministry can deny access to the data requested. Against this backdrop, AIReF decided in December 2015 to lodge an appeal before Spain's high administrative court (audiencia nacional) against the Ministry of Finance’s administrative decision disregarding AIReF's comments to the ministerial decision. Graph 3.5.2: Spain. Regional governments deficit with and without an expenditure rule % of GDP 1 0 -1 Some features of AIReF’s regulatory framework hinder its role as monitoring institution. Spain’s independent fiscal institution (AIReF) is now well-established. It delivers among other things, regular assessments of budgetary plans and performance of the central government, the social security funds, regional and local governments. It also assesses and endorses (if applicable) the macroeconomic forecasts underpinning national and regional budget laws. However, some features of its regulatory framework may hamper the delivery of its tasks and weaken the impact of its assessments: Firstly, although the legislation establishing AIReF foresees a comply-or-explain principle, it does not call on the addressees of AIReF’s recommendations to publicly explain the reasons for not taking on board its advice, thus undermining the effectiveness of that principle. In this context, AIReF has tried, on its own initiative, to remedy this deficiency by publishing regularly on its website the replies of the addressees of its recommendations. -2 -3 -4 -5 -6 -7 04 05 06 07 08 09 10 11 12 13 14 Deficit compliant with expenditure rule Actual deficit (1) This chart is based on the following assumptions: Expenditure on Union programmes fully matched by Union funds revenue are proxied by national account categories D.74 and D.92r. Data on capital and current transfers to public administrations are taken from .IGAE’s annual data on region’s accounts. Data referred to 2013 and to 2014 are taken from the Ministry of Finance’s report on region’s compliance with the expenditure rule. The reference rate of medium-term growth of Spain's GDP is based on data reported in Spain’s Stability Programmes. Source: European Commission from IGAE (101) Orden HAP 1287/2015. 82 3.5. Public administration, fiscal frameworks and taxation The involvement of regional governments is critical for successful public administration reform in Spain. This chapter highlights the challenges of public procurement policy in a decentralised setting such as Spain. It also identifies areas within taxation where further efficiency gains could be achieved. The chapter assesses progress made in the transparency on administrative decision making, with a focus on sub-national governments. There have also been further improvements in increasing the transparency and accountability in regions’ public finances. However, Spain’s public deficit is still sizeable and the share of public spending managed by regions is also large. Further strengthening of regions’ budgeting practices and of the regulatory framework of Spain’s independent fiscal institution, combined with a rigorous implementation of the stability law’s preventive and corrective measures would help ensure compliance with the fiscal, debt and expenditure rule targets. 83 ANNEX A Overview table Commitments Summary assessment (102) 2015 country-specific recommendations (CSRs) CSR 1: Ensure a durable correction of the excessive deficit by 2016 by taking the necessary structural measures in 2015 and 2016 and using windfall gains to accelerate the deficit and debt reduction. Strengthen transparency and accountability of regional public finances. Improve the costeffectiveness of the healthcare sector, and rationalise hospital pharmaceutical spending. CSR 2: Complete the reform of the savings bank sector, including by means of legislative measures, and complete the restructuring and privatisation of state-owned savings banks. Spain has made limited progress in addressing CSR 1: Some progress has been made to strengthen transparency and accountability of regional public finances. On 30/10/15, IGAE, the state general comptroller, issued guidelines on how to implement the spending rule at regional government level. Moreover, the Ministry of Finance is expected to start publishing detailed data on regional governments’ spending on health and pharmaceutical products in early 2016, following the amendments made to Spain’s general law on healthcare in July 2015. Despite progress made throughout the previous legislature, there remains room for achieving greater convergence of budgetary codes, budgetary documents, accompanying tables and public accounting rules for regional governments in the interest of transparency.Limited progress has been made in improving the cost-effectiveness of the healthcare sector, and rationalising hospital pharmaceutical spending. The new voluntary fiscal rule supposed to limit growth in healthcare spending in 2015 and 2016 needs to be implemented by regions. The agreement with pharmaceutical industry should in 2016 limit growth in expenditure on original nongeneric prescription drugs to the reference GDP growth rate. Spain has made substantial progress in addressing CSR 2: The implementation of the savings bank reform is well advanced. The law on savings banks (Law 26/2013) to reduce controlling stakes of banking foundations in the banks was finally implemented with Royal Decree 877/2015 and Circular 6/2015. There was no further progress on privatisation of (102) The following categories are used to assess progress in implementing the 2015 CSRs: No progress: The Member State (MS) has neither announced nor adopted measures to address the CSR. This category also applies if the MS has commissioned a study group to evaluate possible measures. Limited progress: The MS has announced some measures to address the CSR, but these appear insufficient and/or their adoption/implementation is at risk. Some progress: The MS has announced or adopted measures to address the CSR. These are promising, but not all of them have been implemented and it is not certain that all will be. Substantial progress: The MS has adopted measures, most of which have been implemented. They go a long way towards addressing the CSR. Fully implemented: The MS has adopted and implemented measures that address the CSR appropriately. 84 A. Overview table 2015 country-specific recommendations (CSRs) state-owned banks. The entry into force of a new accounting framework for SAREB, the Spanish asset management company, is a positive development, as it will allow proper treatment of impairments and asset-price evolution, and help in adapting deleveraging policies of SAREB to credible market assumptions. CSR 3: Promote the alignment of wages and productivity, in consultation with the social partners and in accordance with national practices, taking into account differences in skills and local labour market conditions as well as divergences in economic performance across regions, sectors and companies. Take steps to increase the quality and effectiveness of job search assistance and counselling, including as part of tackling youth unemployment. Streamline minimum income and family support schemes and foster regional mobility. Spain has made some progress in addressing CSR 3: Some progress has been reached in wage setting, owing in particular to the latest collective bargaining agreement for 2015-2016 signed by social partners in June 2015. The agreement strives to take into account differences in skills and local labour market conditions, as well as divergences in economic performance across regions, sectors and companies. However, the number of workers covered by firm-level agreements is still very low. Some progress has been made to increase the quality and effectiveness of job search assistance and counselling, including as part of the tackling youth unemployment. The implementation of the Activation Strategy 2014-2016 is progressing very slowly, as well as the cooperation between the regions and the central government. The national Youth Guarantee was set in motion. However, participation in initiatives to increase labour market participation, entrepreneurship, and the employability of young people is still much lower than expected, and effective outreach mechanisms are lacking. Limited progress has been registered in ensuring effective minimum income support schemes that allows smooth transition to the labour market. Income support schemes and social services are scattered across many institutions and levels of government that limit the portability and mobility of the beneficiaries. The delivery of family support schemes (notably affordable early childhood education and care, and long term care) remains poor and regional mobility has not improved. CSR 4: Remove the barriers preventing businesses from growing, including size-contingent regulations. 85 Spain has made some progress in addressing CSR 4: Some progress has been made in removing the A. Overview table 2015 country-specific recommendations (CSRs) Adopt the planned reform on professional services. Accelerate the implementation of the law on market unity. barriers preventing businesses from growing. Some measures were adopted since the publication of the 2015 Country Report for Spain with a view to fostering company growth. The April 2015 law on corporate finance aims to improve SME’s access to bank credit and non-bank financing. The October 2015 law on the legal framework of public administration sets out the obligation to assess the impact of new legislation on SMEs. No progress has been made in adopting the planned reform of professional services. The Spanish government decided in 2015 not to pursue this reform. As a result, no draft law has been sent to Parliament, despite the fact that technical work linked to the reform had been completed. Some progress has been made in accelerating the implementation of the law on market unity. At the cut-off date of this report, the central government had completed around 60% of the planned amendments to sector specific legislation. The rate of completed amendments at regional level is around 17%, thus showing little progress since the publication of the 2015 Country Report for Spain. At the time of writing one agreement had been reached at sectoral conference level on gambling. However, some technical groups reporting to the sectoral conferences have made agreements in the areas of industry, tourism, urban and environmental regulations. Cooperation mechanisms among the different administrations set out in the Law, such as the electronic application to share information among central, regional and local authorities, are operational. Lastly, the law also introduces a complaint mechanism offering the possibility for economic agents to seek redress on barriers to market unity within shorter deadlines than ordinary administrative appeals. At the time of writing, 150 complaints had been submitted. 86 A. Overview table Europe 2020 (national targets and progress) Europe 2020 national targets Assessment Employment rate target: 74 % of those aged 20-64 59.9 % (2014 levels) Due to strong job creation since mid-2013, the employment rate in Spain has increased by more than 2.4 pps. since the trough experienced in 2013. Strong job creation is expected to continue over the short term, sustaining further increases in the employment rate. Nonetheless, the employment rate is still 8 pps. below the level achieved in 2007. R&D target set in the 2015 NRP: 2 % of GDP 1.2 % (provisional data for 2014) Spain’s spending on R&D relative to its GDP (i.e., R&D intensity), by both the private and public sectors, continued declining in 2014 and stood at 1.2 % of GDP (2 % in the EU). Reaching the 2 % national R&D intensity target by 2020 is will be a challenge. National greenhouse gas (GHG) emissions target: -10 % in 2020 compared to 2005 (in sectors not included in the emission trading scheme). According to the latest national projections submitted to the Commission in 2015, and taking into account existing measures, it is expected that the target will be achieved: -12 % in 2020 as compared with 2005 (margin of 2 pps.) 2020 Renewable energy target: 20 % With a renewable energy share of 16.2 % in 2014, Spain is on track to reach the 2020 target but efforts should continue ahead of 2020. In particular, Spain has to continue guaranteeing a stable framework for the development of the sector. With a 0.5 % RES share in transport, Spain is lagging behind in RES development in transport and could have difficulty in reaching the binding 10 % transport target by 2020 in spite of the new legislation to increase the consumption of biofuels and the strategy to boost alternative fuel vehicles adopted in 2015. Spain’s 2020 energy efficiency target is 119.8 million tonnes of oil equivalent (Mtoe) expressed in primary energy consumption (80.1 Mtoe expressed in final energy consumption) Even if Spain’s current primary energy consumption is below its 2020 target, additional efforts could be needed to keep primary energy consumption at this level or to minimise its increase when GDP increases again in the next five years. Early school leaving target: 15 % 21.9 % (2014 levels) Energy efficiency target. The country has achieved great reductions in early 87 A. Overview table Europe 2020 national targets Assessment school leaving, but it remains an outstanding issue with some regions reaching 32 % (Balearic Islands) or 27 % (Andalusia), while others appear as front runner sin EU with rates under 10 %. ESL appears closely linked to the family socioeconomic background of students and to specific regional growth economies based on low-skilled jobs. Tertiary education target: 44 % 42.3 % (2014 levels) Spain has a high rate of tertiary attainment but its positive impact is undermined by 1) the lack of alignment between study programmes and growth/economic transformation needs, and 2) the lack of capacity for the labour market to create high quality jobs to retain highly qualified graduates. This leads to low employability rates for specific study programmes and underemployment of a high proportion of graduates Risk of poverty or social exclusion target: 1.4 -1.5 less people in or at risk of poverty and social exclusion The number of people at risk of poverty or social exclusion increased by more than 1.3 million between 2010 and 2014. 88 ANNEX B MIP scoreboard Table B.1: The MIP scoreboard for Spain Thresholds 2009 2010 2011 2012 2013 2014 -4%/6%-7.8* -7.7 -5.8 -3.8 -2.4 -0.6 0.7 -35%-44.1* -93.8* -89.1* -91.4* -89.0 -94.5 -94.1 3 years % change ±5% & ±11% 4.6 -0.3 -2.5 -5.3 -0.4 -1.0 Export market share - % of world exports 5 years % change -6% -9.0 -11.7 -8.2 -17.8 -10.6 -11.5 Nominal unit labour cost index (2010=100) 3 years % change 9% & 12% 11.8p 5.7p -1.0p -5.4p -4.3p -4.1p -5.8 -3.7 -9.8 -16.8 -10.0 0.1 Current account balance, (% of GDP) 3 year average Net international investment position (% of GDP) Real effective exchange External imbalances rate - 42 trading partners, and competitiveness HICP deflator Internal imbalances New employment indicators 41.0* Deflated house prices (% y-o-y change) 6% Private sector credit flow as % of GDP, consolidated 14% -1.2 0.9 -3.8 -11.0 -10.7 -7.1 Private sector debt as % of GDP, consolidated 133% 202.1 201.1 196.8 187.8 176.3 165.8 General government sector debt as % of GDP 60% 52.7 60.1 69.5 85.4 93.7 99.3 Unemployment rate 10% 12.5 16.4 19.7 22.0 24.1 25.1 Total financial sector liabilities (% y-o-y change) 16.5% 3.7 -2.0 2.8 3.3 -10.5 -1.9 Activity rate - % of total population aged 15-64 (3 years change in p.p) -0.2% 2.0 1.7 1.2 1.2 0.8 0.3 Long-term unemployment rate - % of active population aged 15-74 (3 years change in p.p) 0.5% 2.5 5.6 6.9 6.7 5.7 4.0 Youth unemployment rate - % of active population aged 15-24 (3 years change in p.p) 2% 19.8 23.4 21.7 15.2 14.0 7.0 3 year average 27.9e Flags: *: BPM5/ESA95 figure. p: provisional. e: estimated. Note: Figures highlighted are those falling outside the threshold established in the European Commission's Alert Mechanism Report. For REER and ULC, the first threshold applies to euro area Member States. Source: European Commission 89 ANNEX C Standard tables Table C.1: Financial market indicators Total assets of the banking sector (% of GDP) Share of assets of the five largest banks (% of total assets) Foreign ownership of banking system (% of total assets) Financial soundness indicators: - non-performing loans (% of total loans)1) - capital adequacy ratio (%)1) 1) - return on equity (%) Bank loans to the private sector (year-on-year % change) Lending for house purchase (year-on-year % change) Loan to deposit ratio Central Bank liquidity as % of liabilities Private debt (% of GDP) Gross external debt (% of GDP)2) - public - private Long-term interest rate spread versus Bund (basis points)* Credit default swap spreads for sovereign securities (5-year)* 2010 321.1 44.3 9.6 2011 338.3 48.1 9.5 2012 343.4 51.4 9.1 2013 305.6 54.4 8.1 2014 285.6 58.3 8.5 2015 262.0 - 4.7 11.9 6.0 12.1 7.5 11.6 9.4 13.3 8.5 13.7 7.0 14.4 8.0 1.3 0.9 108.8 2.6 200.3 26.6 56.7 150.8 168.9 1.5 -1.9 -1.2 108.7 6.5 196.2 25.6 54.4 283.3 250.0 -21.0 -7.4 -3.3 108.1 13.5 187.2 24.2 40.3 435.1 325.7 5.4 -8.6 -4.1 98.7 8.7 176.0 40.8 51.7 299.2 185.5 5.7 -4.9 -3.7 93.3 6.2 164.6 48.5 51.3 156.0 71.4 10.3 -2.5 -4.2 91.4 6.1 50.1 49.3 124.0 72.6 1) Latest data Q2-2015. 2) Latest data September 2015. Monetary authorities, monetary and financial institutions are not included. * Measured in basis points. Source: IMF (financial soundness indicators); European Commission (long-term interest rates); World Bank (gross external debt); Eurostat (private debt); ECB (all other indicators). Table C.2: Labour market and social indicators 2010 Employment rate (% of population aged 20-64) Employment growth (% change from previous year) Employment rate of women (% of female population aged 20-64) Employment rate of men (% of male population aged 20-64) Employment rate of older workers (% of population aged 55-64) Part-time employment (% of total employment, aged 15 years and over) Fixed term employment (% of employees with a fixed term contract, aged 15 years and over) Transitions from temporary to permanent employment Unemployment rate age group 15-74) (1) (% active population, (2) Long-term unemployment rate (% of labour force) Youth unemployment rate (% active population aged 15-24) (3) Youth NEET rate (% of population aged 15-24) Early leavers from education and training (% of pop. aged 18-24 with at most lower sec. educ. and not in further education or training) Tertiary educational attainment (% of population aged 30-34 having successfully completed tertiary education) Formal childcare (30 hours or over; % of population aged less than 3 years) 2011 2012 2013 2015 (4) 2014 62.8 62.0 59.6 58.6 59.9 61.7 -1.7 -2.7 -4.1 -2.9 0.9 2.9 56.3 56.1 54.6 53.8 54.8 56.0 69.2 67.7 64.6 63.4 65.0 67.3 43.5 44.5 43.9 43.2 44.3 46.5 13.0 13.6 14.5 15.8 15.9 15.8 24.7 25.1 23.4 23.1 24.0 25.0 15.9 10.8 14.4 14.4 12.0 - 19.9 21.4 24.8 26.1 24.5 22.5 7.3 8.9 11.0 13.0 12.9 11.7 41.5 46.2 52.9 55.5 53.2 49.2 17.8 18.2 18.6 18.6 17.1 - 28.2 26.3 24.7 23.6 21.9 - 42.0 41.9 41.5 42.3 42.3 - 18.0 20.0 15.0 16.0 - - (1) Unemployed persons are all those who were not employed but had actively sought work and were ready to begin working immediately or within two weeks. (2) Long-term unemployed are peoples who have been unemployed for at least 12 months. (3) Not in Education Employment or Training. (4) Average of first three quarters of 2015. Data for total unemployment and youth unemployment rates are seasonally adjusted. Source: European Commission (EU Labour Force Survey). 90 C. Standard tables Table C.3: Labour market and social indicators (continued) Expenditure on social protection benefits (% of GDP) 2009 2010 2011 2012 2013 2014 Sickness/healthcare 7.1 7.0 6.9 6.6 6.4 - Invalidity 1.7 1.7 1.8 1.8 1.9 - Old age and survivors 9.8 10.4 10.9 11.4 12.0 - Family/children 1.5 1.5 1.4 1.4 1.3 - Unemployment 3.5 3.3 3.6 3.5 3.3 - Housing and social exclusion n.e.c. 0.2 0.2 0.2 0.1 0.1 - 24.0 24.2 24.9 25.0 25.2 - 3.3 3.6 4.0 3.7 3.6 Total of which: means-tested benefits Social inclusion indicators People at risk of poverty or social exclusion(1) (% of total population) Children at risk of poverty or social exclusion (% of people aged 0-17) (2) At-risk-of-poverty rate (% of total population) Severe material deprivation rate(3) (% of total population) Proportion of people living in low work intensity households(4) (% of people aged 0-59) In-work at-risk-of-poverty rate (% of persons employed) Impact of social transfers (excluding pensions) on reducing poverty Poverty thresholds, expressed in national currency at constant prices(5) Gross disposable income (households; growth %) Inequality of income distribution (S80/S20 income quintile share ratio) 2009 2010 2011 2012 2013 2014 24.7 26.1 26.7 27.2 27.3 29.2 32.0 33.3 32.2 32.4 32.6 35.8 20.4 20.7 20.6 20.8 20.4 22.2 4.5 4.9 4.5 5.8 6.2 7.1 7.6 10.8 13.4 14.3 15.7 17.1 11.7 10.9 10.9 10.8 10.5 12.5 24.2 28.1 31.3 28.5 32.0 28.6 8289 8202 7667 7406 7051 6814 1.9 -1.5 0.8 -3.2 -0.8 0.9 5.9 6.2 6.3 6.5 6.3 6.8 (1) People at risk of poverty or social exclusion (AROPE): individuals who are at risk of poverty (AROP) and/or suffering from severe material deprivation (SMD) and/or living in households with zero or very low work intensity (LWI). (2) At-risk-of-poverty rate (AROP): proportion of people with an equivalised disposable income below 60 % of the national equivalised median income. (3) Proportion of people who experience at least four of the following forms of deprivation: not being able to afford to i) pay their rent or utility bills, ii) keep their home adequately warm, iii) face unexpected expenses, iv) eat meat, fish or a protein equivalent every second day, v) enjoy a week of holiday away from home once a year, vi) have a car, vii) have a washing machine, viii) have a colour TV, or ix) have a telephone. (4) People living in households with very low work intensity: proportion of people aged 0-59 living in households where the adults (excluding dependent children) worked less than 20 % of their total work-time potential in the previous 12 months. (5) For EE, CY, MT, SI and SK, thresholds in nominal values in euros; harmonised index of consumer prices (HICP) = 100 in 2006 (2007 survey refers to 2006 incomes) Source: For expenditure for social protection benefits ESSPROS; for social inclusion EU-SILC. 91 C. Standard tables Table C.4: Structural policy and business environment indicators Performance indicators 2009 Labour productivity (real, per person employed, y-o-y) Labour productivity in industry Labour productivity in construction Labour productivity in market services Unit labour costs (ULC) (whole economy, y-o-y) ULC in industry ULC in construction ULC in market services Business environment 2010 2011 2012 2013 2014 1.56 16.62 0.80 5.50 -1.05 1.76 2.78 2.20 1.53 1.56 6.98 3.41 -1.35 4.46 1.34 0.46 0.36 1.22 1.44 -8.08 2.65 -4.11 1.03 -0.90 -1.63 -4.12 0.23 0.01 -7.15 -3.97 2.56 -5.65 -1.35 0.34 -1.46 -1.90 2009 2010 2011 2012 2013 2014 Time needed to enforce contracts(1) (days) 515 515 515 515 510 510 Time needed to start a business(1) (days) 61.0 61.0 52.0 29.0 30.0 24.0 Outcome of applications by SMEs for bank loans (2) Research and innovation 1.38 2009 R&D intensity Total public expenditure on education as % of GDP, for all levels of education combined Number of science & technology people employed as % of total employment Population having completed tertiary education(3) Young people with upper secondary level education(4) Trade balance of high technology products as % of GDP Product and service markets and competition 0.99 2010 0.94 2011 1.15 2012 0.98 2013 0.97 2014 1.35 1.35 1.32 1.27 1.24 1.20 5.02 4.98 4.82 4.34 na na 40 40 43 44 45 46 27 28 29 30 31 32 60 62 62 63 64 66 -1.12 -1.24 -1.05 -0.86 -0.70 -0.88 2003 2008 2013 OECD product market regulation (PMR)(5), overall 1.79 1.59 1.44 OECD PMR(5), retail 3.67 3.48 2.88 OECD PMR(5), professional services 2.92 2.74 2.43 2.27 1.65 1.59 (5) (6) OECD PMR , network industries (1) The methodologies, including the assumptions, for this indicator are shown in detail here: http://www.doingbusiness.org/methodology . (2) Average of the answer to question Q7B_a. "[Bank loan]: If you applied and tried to negotiate for this type of financing over the past six months, what was the outcome?". Answers were codified as follows: zero if received everything, one if received most of it, two if only received a limited part of it, three if refused or rejected and treated as missing values if the application is still pending or don't know. (3) Percentage population aged 15-64 having completed tertiary education. (4) Percentage population aged 20-24 having attained at least upper secondary education. (5) Index: 0 = not regulated; 6 = most regulated. The methodologies of the OECD product market regulation indicators are shown in detail here: http://www.oecd.org/competition/reform/indicatorsofproductmarketregulationhomepage.htm (6) Aggregate OECD indicators of regulation in energy, transport and communications (ETCR). Source: European Commission; World Bank — Doing Business (for enforcing contracts and time to start a business); OECD (for the product market regulation indicators); SAFE (for outcome of SMEs' applications for bank loans). 92 C. Standard tables Table C.5: Green growth Green growth performance Macroeconomic Energy intensity Carbon intensity Resource intensity (reciprocal of resource productivity) Waste intensity Energy balance of trade Weighting of energy in HICP Difference between energy price change and inflation Real unit of energy cost Ratio of labour taxes to environmental taxes Environmental taxes Sectoral Industry energy intensity Real unit energy cost for manufacturing industry Share of energy-intensive industries in the economy Electricity prices for medium-sized industrial users Gas prices for medium-sized industrial users Public R&D for energy Public R&D for environment Municipal waste recycling rate Share of GHG emissions covered by ETS* Transport energy intensity Transport carbon intensity Security of energy supply Energy import dependency Aggregated supplier concentration index Diversification of energy mix 2009 2010 2011 2012 2013 2014 kgoe / € kg / € kg / € kg / € % GDP % % % of value added ratio % GDP 0.14 0.38 0.67 -2.3 10.39 -1.6 11.5 10.2 1.6 0.14 0.36 0.60 0.14 -2.9 10.23 4.3 13.0 10.2 1.6 0.14 0.37 0.53 -3.7 10.78 12.6 14.4 10.6 1.6 0.14 0.37 0.44 0.13 -3.7 11.60 7.4 10.7 1.6 0.13 0.35 0.42 -3.3 12.39 -1.9 8.7 1.9 0.41 -2.9 12.30 2.6 9.1 1.8 kgoe / € % of value added % GDP € / kWh € / kWh % GDP % GDP % % kgoe / € kg / € 0.16 35.9 8.10 0.11 0.03 0.03 0.04 42.1 38.1 1.08 2.72 0.15 43.1 8.50 0.11 0.03 0.03 0.03 37.8 35.0 1.01 2.50 0.15 49.8 8.47 0.11 0.03 0.03 0.03 37.0 38.3 0.96 2.30 0.14 8.38 0.12 0.04 0.01 0.02 39.4 39.7 0.86 2.07 0.15 0.12 0.04 0.01 0.02 39.8 38.1 0.81 2.03 0.12 0.04 0.02 0.02 38.3 - % HHI HHI 79.1 13.5 0.32 76.7 13.4 0.31 76.3 15.1 0.29 73.0 16.8 0.27 70.5 20.2 0.27 - General explanation of the table items: All macro intensity indicators are expressed as a ratio of a physical quantity to GDP (in 2005 prices) Energy intensity: gross inland energy consumption (in kgoe) divided by GDP (in EUR) Carbon intensity: greenhouse gas emissions (in kg CO2 equivalents) divided by GDP (in EUR) Resource intensity: domestic material consumption (in kg) divided by GDP (in EUR) Waste intensity: waste (in kg) divided by GDP (in EUR) Energy balance of trade: the balance of energy exports and imports, expressed as % of GDP Weighting of energy in HICP: the proportion of "energy" items in the consumption basket used for the construction of the HICP Difference between energy price change and inflation: energy component of HICP, and total HICP inflation (annual % change) Real unit energy cost: real energy costs as a percentage of total value added for the economy Environmental taxes and labour taxes : from European Commission, ‘Taxation trends in the European Union’ Industry energy intensity: final energy consumption of industry (in kgoe) divided by gross value added of industry (in 2005 EUR) Real unit energy costs for manufacturing industry: real costs as a percentage of value added for manufacturing sectors Share of energy-intensive industries in the economy: share of gross value added of the energy-intensive industries in GDP Electricity and gas prices for medium-sized industrial users: consumption band 500–20 00MWh and 10 000–100 000 GJ; figures excl. VAT. Municipal waste recycling rate: ratio of recycled municipal waste to total municipal waste Public R&D for energy or for the environment: government spending on R&D (GBAORD) for these categories as % of GDP Proportion of greenhouse gas (GHG) emissions covered by EU Emission Trading System (ETS): based on greenhouse gas emissions (excluding land use, land use change and forestry) as reported by Member States to the European Environment Agency Transport energy intensity: final energy consumption of transport activity (kgoe) divided by transport industry gross value added (in 2005 EUR) Transport carbon intensity: greenhouse gas emissions in transport activity divided by gross value added of the transport sector Energy import dependency: net energy imports divided by gross inland energy consumption incl. consumption of international bunker fuels Aggregated supplier concentration index: covers oil, gas and coal. Smaller values indicate larger diversification and hence lower risk. Diversification of the energy mix: Herfindahl index over natural gas, total petrol products, nuclear heat, renewable energies and solid fuels * European Commission and European Environment Agency Source: European Commission (Eurostat) unless indicated otherwise 93
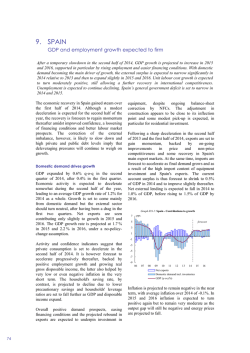
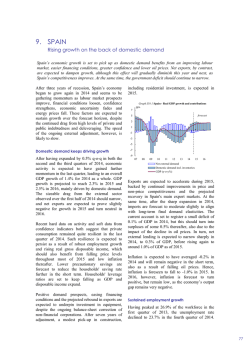


© Copyright 2026