Situación Comercial SOJA - TRIGO - MAIZ y SORGO - 13/14 Vs. 12/13
Situación Comercial SOJA - TRIGO - MAIZ y SORGO - 13/14 Vs. 12/13
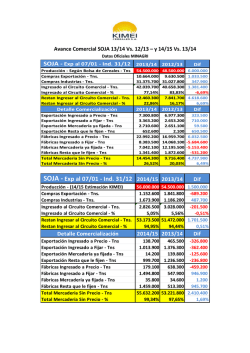
SOJA - Exp al 1/10 - Ind 24/09
Producción - Según Bolsa de Cereales - Tns
Compras Exportación - Tns.
Compras Industrias - Tns.
Ingresado al Circuito Comercial - Tns.
Ingresado al Circuito Comercial - %
Restan Ingresar al Circuito Comercial - Tns.
Restan Ingresar al Circuito Comercial - %
Detalle Comercialización
Exportación Ingresado a Precio - Tns
Exportación Ingresado a Fijar - Tns
Exportación Mercadería ya fijada - Tns
Exportación Resta que le fijen - Tns
Fábricas Ingresado a Precio - Tns
Fábricas Ingresado a Fijar - Tns
Fábricas Mercadería ya fijada - Tns
Fábricas Resta que le fijen - Tns
Total Mercaderia Sin Precio - Tns
Total Mercaderia Sin Precio - %
MAIZ - Exp al 1/10 - Ind 3/09
Producción - Según Bolsa de Cereales - Tns
Compras Exportación - Tns.
Compras Industrias - Tns.
Ingresado al Circuito Comercial - Tns.
Ingresado al Circuito Comercial - %
Restan Ingresar al Circuito Comercial - Tns.
Restan Ingresar al Circuito Comercial - %
Detalle Comercialización
Exportación Ingresado a Precio - Tns
Exportación Ingresado a Fijar - Tns
Exportación Mercadería ya fijada - Tns
Exportación Resta que le fijen - Tns
Industria Ingresado a Precio - Tns
Industria Ingresado a Fijar - Tns
Industria Mercadería ya fijada - Tns
Industria Resta que le fijen - Tns
Total Mercaderia Sin Precio - Tns
Total Mercaderia Sin Precio - %
Datos MINAGRI - Dirección Mercados Agrícolas TRIGO - Exp al 3/9 - Ind 24/9
2013/14 2012/13
Dif
2013/14
2012/13
55.000.000
9.867.400
24.255.400
34.122.800
62,04%
20.877.200
37,96%
48.500.000 6.500.000
9.402.300
465.100
25.714.200 -1.458.800
35.116.500
-993.700
72,41%
-10,36%
13.383.500 7.493.700
27,59%
10,36%
10.100.000
2.469.600
4.612.300
7.081.900
70,12%
3.018.100
29,88%
8.200.000
4.927.100
3.684.500
8.611.600
105,02%
-411.600
-5,02%
2013/14
2012/13
6.151.800
3.715.600
2.259.900
1.455.700
17.290.300
6.965.100
5.085.900
1.879.200
24.212.100
44,02%
6.563.100
-411.300
2.839.200
876.400
2.833.800
-573.900
5.400 1.450.300
13.003.800 4.286.500
12.710.400 -5.745.300
10.402.800 -5.316.900
2.307.600
-428.400
15.696.500 8.515.600
32,36%
11,66%
2013/14
2012/13
Dif
Dif
25.200.000 24.800.000
400.000
16.301.900 18.626.700 -2.324.800
3.273.800 3.084.200
189.600
19.575.700 21.710.900 -2.135.200
77,68%
87,54%
-9,86%
5.624.300 3.089.100 2.535.200
22,32%
12,46%
9,86%
2013/14
2012/13
Dif
11.535.600 16.778.800 -5.243.200
4.766.300 1.847.900 2.918.400
1.618.100
885.100
733.000
3.148.200
962.800 2.185.400
2.823.300 2.699.100
124.200
450.500
385.100
65.400
238.400
236.400
2.000
212.100
148.700
63.400
8.984.600 4.200.600 4.784.000
35,65%
16,94%
18,72%
Producción - Según Bolsa de Cereales - Tns
Compras Exportación - Tns.
Compras Industrias - Tns.
Ingresado al Circuito Comercial - Tns.
Ingresado al Circuito Comercial - %
Restan Ingresar al Circuito Comercial - Tns.
Restan Ingresar al Circuito Comercial - %
Detalle Comercialización
Exportación Ingresado a Precio - Tns
Exportación Ingresado a Fijar - Tns
Exportación Mercadería ya fijada - Tns
Exportación Resta que le fijen - Tns
Industria Ingresado a Precio - Tns
Industria Ingresado a Fijar - Tns
Industria Mercadería ya fijada - Tns
Industria Resta que le fijen - Tns
Total Mercaderia Sin Precio - Tns
Total Mercaderia Sin Precio - %
SORGO - Exp al 1/10 - Ind 3/09
Producción - Según Bolsa de Cereales - Tns
Compras Exportación - Tns.
Compras Industrias - Tns.
Ingresado al Circuito Comercial - Tns.
Ingresado al Circuito Comercial - %
Restan Ingresar al Circuito Comercial - Tns.
Restan Ingresar al Circuito Comercial - %
Detalle Comercialización
Exportación Ingresado a Precio - Tns
Exportación Ingresado a Fijar - Tns
Exportación Mercadería ya fijada - Tns
Exportación Resta que le fijen - Tns
Industria Ingresado a Precio - Tns
Industria Ingresado a Fijar - Tns
Industria Mercadería ya fijada - Tns
Industria Resta que le fijen - Tns
Total Mercaderia Sin Precio - Tns
Total Mercaderia Sin Precio - %
2013/14
2.290.200
179.400
34.500
144.900
3.862.700
749.600
606.000
143.600
3.306.600
32,74%
2013/14
4.300.000
894.800
89.300
984.100
22,89%
3.315.900
77,11%
2013/14
733.900
160.900
68.200
92.700
86.900
2.400
1.100
1.300
3.409.900
79,30%
2012/13
Dif
1.900.000
-2.457.500
927.800
-1.529.700
-34,90%
3.429.700
34,90%
Dif
4.725.200 -2.435.000
201.900
-22.500
79.200
-44.700
122.700
22.200
3.025.900
836.800
658.600
91.000
637.400
-31.400
21.200
122.400
-267.700 3.574.300
-3,26%
36,00%
2012/13
4.500.000
1.595.100
61.700
1.656.800
36,82%
2.843.200
63,18%
2012/13
1.434.800
160.300
90.800
69.500
59.000
2.700
2.700
0
2.912.700
64,73%
Dif
-200.000
-700.300
27.600
-672.700
-13,93%
472.700
13,93%
Dif
-700.900
600
-22.600
23.200
27.900
-300
-1.600
1.300
497.200
14,57%
© Copyright 2026


