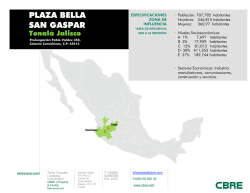
Fundamentals steadily improve as lease rates rise
MARKETVIEW
Mexico Capital Markets Q2 2015
Mexico’s public debt and demand leads the
expansion of Commercial Real Estate.
MX Stock Exchange Index (up to May)
Total Amount Raised
REITS Assets Value
US $10,156 (M)
US $21,968 (M)
44,703
*The arrows indicate the change from to the previous quarter.
Figure 1: Mexico City Office Market: Under Construction, Completions, Gross and Net Absorption, 1998-2015**.
1,700,000
1,600,000
1,500,000
1,400,000
1,300,000
1,200,000
1,100,000
1,000,000
900,000
800,000
700,000
600,000
500,000
400,000
300,000
200,000
100,000
0
Under Construction (sq.m)
New Delivered Stock (sq.m)
Net Absorption (sq.m)
Gross Absorption (sq.m)*
Source: CBRE Research, Q2 2015.
*/Includes pre-lease transactions.
**/ Estimated Data.
OVERVIEW
•
FIBRAs (Real Estate Investment Trusts) and CKDs
(Capital Development Certificates) in Mexico
represent 1.4% of GDP.
•
The aggressive acquisition of premium properties by
FIBRAs has led to the compression of cap rates,
particularly in the Class AAA offices market.
•
Given the increase in interest rates by the U.S.
Federal Reserve, we expect a decompression of cap
rates of around 50 basis points across the different
sectors.
The liquidity of FIBRAS in Mexico has provided a
boost to the expansion phase of the real estate cycle
across all segments. The most obvious example can
be found in the Mexico City office market, with 1.6
million square meters of class A and A+ space
registered as under construction, and 1.3 million
square meters of construction work planned over
the next five years. Net absorption (demand for
existing spaces) reached a record high of 354,000
square meters in 2014 while lease and sale closed
deals (gross absorption) including pre-leases saw a
record of almost 430,000 square meters.
Source: CBRE Research, Q2 2015
2T 2015 CBRE Research
© 2015 CBRE, Inc. |
1
M A R K E T V I E W MEXICO CAPITAL MARKETS
OVERVIEW
by U.S. Federal Reserve in the coming months, we
would expect a decompression of cap rates of around
The institutionalization of the commercial real estate
50 basis points across different sectors.
market in Mexico has encouraged and created the
need for more sophisticated instruments (FIBRAs
Even when the absorption rates of the office sector
and CKDs are the best examples) to satisfy the
remain relatively healthy with respect to the new
increasing developer and investor demands.
offering incorporated into the inventory, it bears
noting that the construction of new corporate spaces
Just three years after their introduction, FIBRAs and
is unprecedented, and there may be downward
CKDs account for 1.4% of GDP, according to data
pressure exerted on leases into 2016, particularly in
from the Central Bank of Mexico, thus underscoring
suburban Mexico City areas.
their high potential for growth.
On the other hand, the industrial segment will
The aggressive dynamics shown by FIBRAs to create
continue to benefit from the boost in demand from
high-quality portfolios has led to a compression of
the automotive and logistics industries, where
cap rates, particularly in the premium office market;
Mexico has become the primary beneficiary of the
however, given the volatility of the financial markets
nearshoring of companies that previously produced
and the scheduled increase in interest rates
their products for the U.S. market in Asia.
Figure 2: Cap Rates by Asset Type in Main Markets, 2011 –2017*
11.0
10.0
Cap Rate %
9.0
8.0
7.0
6.0
5.0
4.0
2011
2012
City Office
CdMx
México
Oficinas
2013
2014
Retail
Promedio
RetailMexico
Mx Avg
2015
Cd
México
Mx
City Industrial
Industrial
2016
2017
Monterrey
Monterrey
Industrial
Industrial
Source: CBRE Research, Q2 2015.
*/2015 to 2017: estimated data.
Q2 2015 CBRE Research
© 2015 CBRE, Inc. |
2
M A R K E T V I E W MEXICO CAPITAL MARKETS
OVERVIEW
In
2014,
the
FIBRAs
index
posted
a
better
performance than the Mexican Stock Exchange’s
Also,
the
retail
market
has
begun
an
Index (13% vs. 0.7% growth), thus making these
institutionalization process that will boost its
instruments attractive options for investor portfolios.
potential to make up for Mexico’s shortcomings in
shopping center density (0.2 sq. m. per capita)
During the first five months of 2015, financial market
compared to other emerging markets such as Brazil
volatility affected the progression of the Stock
(0.4 sq. m.) and mature markets such as Canada (1.2
Exchange Index; however, we expect the indexes to
Sq. m.).
resume a less volatile trend once the markets
discount the effects of interest rates increases.
The hotel sector, and especially the business
hospitality segment, maintains a very favorable
Rising interest rates may also be indicative of the
outlook as the result of benefits deriving from the
recovery of the U.S. economy, which may boost
automotive boom in markets such as the Bajio in
demand for Mexican exports and hopefully, for local
Central Mexico and Northwestern Mexico, with the
Real Estate, particularly in the automotive, logistics,
devaluation of the Mexican peso against the dollar
financial services, retail and private services sectors,
also making the country an attractive destination for
which have become factors driving the Mexican
foreign visitors.
economy, as well as in areas that we hope will also
pick up, such as energy and telecommunications.
Figure 3: REITS Index (May 2014 – May 2015)
250
245
REITS Index (BMV)
240
235
230
225
220
215
210
(May -14)
(Ago -14)
(Nov -14)
(May -15)
Source: CBRE Research, Q2 2015.
Q2 2015CBRE Research
© 2015 CBRE, Inc. |
3
M A R K E T V I E W MEXICO CAPITAL MARKETS
Figure 4: REITS Main Indicators, Q1 2015.
REIT
Type
Active Value
(Millions Pesos)
Number of
Properties
Properties
(sq m.)
FIBRA UNO
Mix (Commercial, Offices and
Industrial)
155,364
445
6,041,700
Fibra Hotel
Hotel
10,005
71
Fibra Macquarie
Mix (Commercial, Offices and
Industrial)
36,232
Fibra Inn
Hotel
Fibra Terrafina
Offices (%)
Industrial
(%)
Comercial
(%)
Hotel (%)
8.2
52.9
38.7
-
9,673
-
-
-
100
277
3,163,700
6
86.1
8
-
7,362
31
5,538
-
-
-
100
Industrial
29,509
196
2,619,866
-
100
-
-
Fibra Shop
Commercial
10,874
14
381,089
-
-
100
-
Fibra Danhos
Mix (Commercial, Offices and
Industrial)
45,045
11
402,642
28.8
-
68.3
2.9
Fibra Prologis
Industrial
31,051
184
2,929,232
-
100
-
-
Fibra Monterrey Mix (Offices and Industrial)
2,534
9
132,304
63
36.1
1
-
Source: CBRE Research with data from REITS Quarterly Reports.
*Indicates number of rooms.
In Q1 2015, the assets held by FIBRAs were roughly equal to the foreign direct investment (FDI) in Mexico
during 2014, with almost US$22 billion of assets compared to US$23 billion of FDI, thus signifying the
importance of these instruments within the national economy. These instruments have also yielded resources
of almost US$10 billion, as reflected in the acquisitions reported in recent months and the aggressive
acquisition plan for premium property across all segments.
There are currently 40 CKDs in existence, raising approximately US$7.4 billion since 2009, of which
approximately 28% is channeled to specialized Real Estate certificates. We expect investment in these
instruments to grow in light of the announcement made by the financial authorities of simplification of the
Afores procedures to ensure direct invest in CKDs without the need to go through an intermediary.
Figure 5: REITS´s Main Acquisitions (May 2014 to May 2015)
Buyer
Seller
Property Name/ Portfolio
Type
Price (USD) Cap Rate (%)
Transaction Date
Fibra Uno
Confidential
Kansas Portfolio
Retail
674,757,908
8.52%
May 2015
Fibra Danhos
Grupo IPB
Via Vallejo
Retail
414,744,361
10.00%
November 2014
Fibra Uno
eGroup
Offices Samara
Office
268,108,123
8.52%
December 2014
Fibra Uno
Confidential
Gallery Guadalajara
Retail
266,570,589
n.a
July 2014
Fibra Uno
GICSA
Masaryk 111
Office
114,365,641
7.59%
July 2014
Fibra Uno
Prudential RE Investors
Río Churrubusco 601
Retail
113,265,306
n.a
May 2015
Fibra Uno
Siahou Sitton
Hilton Mexico City Reforma
Hotel
90,000,000
n.a
July 2014
Fibra Uno
eGroup
Samara Shops (1-3F)
Retail
79,354,963
8.52%
December 2014
Fibra Uno
Prudential RE Investors
Tower Mitikah
Office
71,734,694
n.A
May 2015
Fibra Uno
Confidential
Utah
Office
67,900,000
8.84%
March 2015
Source: CBRE Research with data from Real Capital Analytics and internal sources.
n.a: Not available.
Q2 2015 CBRE Research
© 2015 CBRE, Inc. |
4
M A R K E T V I E W MEXICO CAPITAL MARKETS
CBRE MEXICO OFFICES
CONTACTS
CBRE MEXICO OFFICE
Yadira Torres-Romero
Director
Ph: + 52 (55) 5284 0014
e: [email protected]
Mexico City
Torre Virreyes,
Pedregal 24 17th Floor
Lomas de Chapultepec
Mexico City, 11040
Pablo López Gallardo
Coordinator
Ph: + 52 (55) 8526 8822
e: [email protected]
To learn more about CBRE Research,
or to access additional research reports,
please visit the Global Research Gateway at
Luisa Viridiana Alaniz Leyvas
Analyst
Ph: + 52 (55) 8526 8792
e: [email protected]
www.cbre.com/researchgateway.
La información contenida en este reporte, incluyendo proyecciones, ha sido obtenida a través de fuentes confiables. A pesar de que no dudamos de su veracidad, no la
hemos verificado y por tanto no la garantizamos, justificamos o representamos. Es su entera responsabilidad confirmar la veracidad de esta información en su
totalidad. Esta información ha sido diseñada exclusivamente para el uso de los clientes de CBRE y profesionales y no puede ser duplicada sin previa autorización de
CBRE.
© Copyright 2026
