
REDES DE CALOR Y FRÍO EN ESPAÑA. CATALUÑA
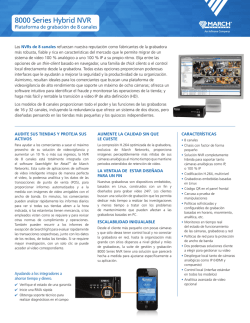
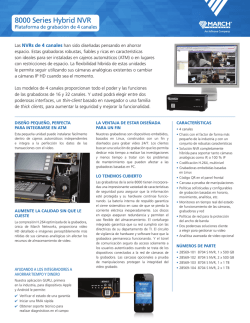
DHC NETWORKS IN SPAIN.
CATALONIA LEADS THE
AUTONOMOUS COMMUNITIES;
THE TERTIARY SECTOR IS THE
BIGGEST CLIENT
En octubre de 2011 ADHAC, con la colaboración del IDAE, decidió comenzar la elaboración de un censo de redes de calor
y frío existentes en el territorio español. El censo abarca
tanto redes como microrredes y la información para su elaboración proviene de datos internos de los socios ADHAC, de
recogida de datos de explotadores/propietarios de redes y de
información pública. El objetivo de esta información es dar
una imagen de la situación de las redes urbanas de calor y
frío en España. El pasado mes de octubre ADHAC presentó en
la sede del IDAE el Censo de Redes de Calor y Frío 2015, donde
se expusieron los datos principales de este inventario actualizado a 2015.
In October 2011 ADHAC, Spain’s District Heating and Cooling
Association, in collaboration with the Institute for Energy
Diversification and Saving (IDAE), started to draw up a census
on the existing DHC networks in Spain. The census covered
both grids and microgrids and the information gathered
comes from internal data provided by ADHAC members, data
collated from network operators/owners and publicly
available information. The aim of this information is to give a
picture of the situation of DHC networks in Spain. Last October
at the IDAE offices, ADHAC presented the District Heating and
Cooling Networks Census 2015, at which the association set
out the main findings of this inventory updated for 2015.
Los datos del Censo 2015 muestran un total de 247 redes censadas,
si bien se han localizado un total de 270. Estos datos muestran un
avance significativo respecto de los datos de años anteriores: 2012
con 46 redes censadas, 2013 con 139 redes, y 2014 con 202 redes.
The data from the 2015 Census covers 247 networks surveyed,
however a total of 270 have actually been identified. The
information show considerable progress compared to previous
years: 2012 covered 46 surveyed networks, with 2013 surveying
139, increasing to 202 in 2014.
El estudio de este año ha permitido la depuración de redes no inactivas. Geográficamente se observa un incremento en la mayoría
de comunidades autónomas, siendo la comunidad con más número de redes Cataluña, con un 34% de las redes. Cataluña ocupa
esta primera posición con una gran ventaja respecto a la segunda
comunidad autónoma, Castilla y León, con un 13% de las redes, la
cuota del resto de comunidades autónomas no llega en ningún
caso al 10%, si bien Navarra ocupa la tercer posición con un 9,42%
de las redes.
Analizando las redes por potencia instalada, las 247 redes censadas
suman una potencia próxima a 1.139 MW instalados. Por comuni-
Calderas en central térmica de Ecoenergies Barcelona, red urbana de calor y
frío del sur de Barcelona. Foto cortesía Ecoenergies Barcelona | Boilers in the
Ecoenergies Barcelona thermal plant, a DHC network south of Barcelona.
Photo courtesy of Ecoenergies Barcelona
www.futurenergyweb.es
The 247 surveyed networks cover an area of 7 million m2 or
93,000 homes, representing a total of 310 km of networks and
contributing to emissions savings of 156,000 t/year of CO2 and
an average saving of 81% in the consumption of fossil fuels.
This year’s study has also filtered out inactive networks. In
geographical terms, an increase can be seen in most of the
autonomous communities. The community with the largest
number of networks is Catalonia, with a share of 34% and a
long way ahead of second-placed Castilla y León that has 13% of
the networks. The remaining autonomous communities fail to
achieve even a 10% share however Navarra, with 9.42%, occupies
third place.
Analysing the networks by installed capacity: the 247 networks
surveyed amount to total installed capacity of almost 1,139
MW. By autonomous community,
Catalonia is once again at the head
of the ranking by installed capacity
with just over 424 MW (37.3% of the
total capacity surveyed); Madrid is in
second place with 301 MW installed
(26.4%) and Navarra third with an
installed capacity of 117 MW (10.3%).
In absolute terms, the number of
heating networks is higher with
220, representing 89% of the total
and only 3 cooling networks which
account for 1%, with heating and
cooling networks totalling 24 (10%).
However the heating and cooling
networks have the largest installed
capacity of the total 1,138.94 MW
with 37%. In other words, 418.59 MW
in absolute terms belong to heating
networks; 713.45 MW are installed
in DHC networks; and 6.9 MW, or
1%, in cooling networks. In short, the
installed capacity is mainly used for
FuturEnergy | Noviembre November 2015
Las 247 redes censadas equivalen a 7 millones de m2 o 93.000 viviendas, representan un total de 310 km de redes, y aportan ahorros
de emisiones de 156.000 t/año de CO2 y un ahorro medio del 81%
en consumo de combustibles fósiles.
Redes Urbanas de Frio y Calor | DHC Networks
REDES DE CALOR Y FRÍO
EN ESPAÑA. CATALUÑA VENCE
POR COMUNIDADES, EL SECTOR
TERCIARIO EN EL APARTADO
CLIENTES
51
Redes Urbanas de Frio y Calor | DHC Networks
dades vuelve a ser Cataluña la primera del ranking por potencia instalada,
algo más de 424 MW instalados (37,3%
de la potencia total censada), ocupando la segunda posición Madrid con
301 MW instalados (26,4%) y Navarra
la tercera, con una potencia instalada
de 117 MW (10,3%).
En términos absolutos, el número de
redes de calor es el mayor, con 220
redes que representan un 89% del
total, las redes de frío son las menos
numerosas, solo 3, representando un
1% y por último las redes de frío y calor localizadas totalizan 24 (10%). No
obstante, las redes de calor y frío son
las que tienen la mayor potencia instalada. De los 1.138,94 MW Instalados
en total, el 37%, es decir 418,59 MW en
términos absolutos pertenecen a redes de calor, 713,45 MW están instalados en redes de calor y Frío (62%) y 6,9 MW, lo que representa un 1%
en redes de frío. En definitiva, la potencia instalada tiene como fin
mayoritario el suministro de calor, puesto que de la potencia total
instalada un 72%, es decir 814,44 MW, se destinan al suministro de
calor y un 28%, osea 324,50 MW a la producción y suministro de frío.
Los clientes usuarios de las redes se reparten del siguiente modo:
www.futurenergyweb.es
•Terciario: 156 redes - 63,2%
•Viviendas: 48 redes - 19,4%
•Industria: 13 redes - 5,3%
•Viviendas+Terciario: 15 redes - 6,1%
•Industria+Terciario: 7 redes - 2,8%
•Viviendas+Industria: 4 redes - 1,6%
•Viviendas+Terciario+Industria: 4 redes - 1,6%
52
the supply of heating given that the total installed capacity
stands at 72%. In other words, 814.44 MW is destined to the
supply of heating and 28%, or 324.50 MW, to the production and
supply of cooling.
The networks’ clients are distributed as follows:
•Tertiary sector: 156 networks - 63.2%
•Households: 48 networks - 19.4%
•Industry: 13 networks - 5.3%
•Households+Tertiary: 15 networks - 6.1%
•Industry+Tertiary: 7 networks - 2.8%
•Households+Industry: 4 networks - 1.6%
•Households+Tertiary+Industry: 4 networks - 1.6%
Si consideramos la distribución terciario, viviendas, industria, los
respectivos porcentajes son 68,15%, 23,82% y 8,03%.
Looking at the distribution between the tertiary sector,
households and industry, the percentages are 68.15%, 23.82% and
8.03% respectively.
En cuanto a la titularidad de las redes, si nos referimos al número
de redes el 50,5% son de titularidad pública, el 42,8% de titularidad
privada y el 6,7% de titularidad mixta. Mientras que si analizamos
por potencia instalada, el 19,6% son de titularidad pública, el 32,1%
de titularidad privada y el 49,2% de titularidad mixta.
As regards the ownership of the networks by number of
networks, 50.5% are publicly owned; 42.8% under private
ownership; and 6.7% mixed ownership. An analysis of the
installed capacity shows that 19.6% is publicly owned; 32.1% is
privately owned; and 49.2% has mixed ownership.
De las 247 redes censadas, 174 consumen energías renovables, 34
gas natural, 25 son alimentadas por distintos tipos de combustibles,
11 con gasoil y 3 con electricidad. Como venimos haciendo hasta
ahora, si analizamos por potencia instalada, las redes que consumen gas natural suponen casi un 49% de la potencia instalada, las
redes alimentadas por renovables un 29%, las alimentadas por electricidad un 19% y las que consumen gasoil casi un 3%.
Of the 247 networks surveyed, 174 consume renewable energy; 34
consume natural gas; 25 are supplied by different types of fuels;
11 run off diesel and 3 consume electricity. As has been seen to
date, an analysis by installed capacity shows that the networks
that consume natural gas represent almost 49% of the installed
capacity, with networks supplied by renewables standing at 29%,
electricity accounting for 19% and diesel at some 3%.
En el mismo acto se presentó el estudio realizado por ADHAC sobre
los efectos económicos de la redes de climatización en la economía española. El estudio pone de manifiesto el importante papel
que juegan las redes y su transcendencia a la hora de llevar a cabo
proyectos de rehabilitación energética que supongan un impulso
dentro de la actividad de futuro.
At the same event, ADHAC also presented a study on the
economic effects of temperature control networks on the
Spanish economy. The study demonstrates the significant role
played by the networks and their importance when undertaking
energy refurbishment projects which represent a boost to future
activity.
El parque edificado español es especialmente apropiado para redes urbanas de calor y frío a gran escala, porque tiene un peso muy
importante de vivienda colectiva, frente a la media europea, y ésta
vivienda se sitúa mayoritariamente en municipios de carácter urbano. Sin embargo todavía seguimos alejados de las cifras de países
como Austria, Dinamarca, Finlandia o Alemania.
Spain’s building stock is particularly well-suited to utility-scale
DHC networks because the country has a significant weighting
of collective housing compared to the European average and this
type of housing is mainly located in urban municipalities. Spain
however is still a long way off achieving the figures of countries
such as Austria, Denmark, Finland and Germany.
FuturEnergy | Noviembre November 2015


© Copyright 2026