
latin america treads a narrow path to growth
Semiannual Report Office of the Regional Chief Economist LATIN AMERICA TREADS A NARROW PATH TO GROWTH THE SLOWDOWN AND ITS MACROECONOMIC CHALLENGES APRIL 2015 Latin America Treads a Narrow Path to Growth: The Economic Slowdown and its Macro Challenges |1 © 2015 International Bank for Reconstruction and Development / The World Bank 1818 H Street NW, Washington DC 20433 Telephone: 202-473-1000; Internet: www.worldbank.org Some rights reserved 1 2 3 4 17 16 15 14 This work is a product of the staff of The World Bank with external contributions. The findings, interpretations, and conclusions expressed in this work do not necessarily reflect the views of The World Bank, its Board of Executive Directors, or the governments they represent. The World Bank does not guarantee the accuracy of the data included in this work. The boundaries, colors, denominations, and other information shown on any map in this work do not imply any judgment on the part of The World Bank concerning the legal status of any territory or the endorsement or acceptance of such boundaries. Nothing herein shall constitute or be considered to be a limitation upon or waiver of the privileges and immunities of The World Bank, all of which are specifically reserved. Rights and Permissions This work is available under the Creative Commons Attribution 3.0 IGO license (CC BY 3.0 IGO) http://creativecommons.org/licenses/by/3.0/igo. Under the Creative Commons Attribution license, you are free to copy, distribute, transmit, and adapt this work, including for commercial purposes, under the following conditions: Attribution—Please cite the work as follows: Augusto de la Torre, Alain Ize, and Samuel Pienknagura. 2015. “Latin America Treads a Narrow Path to Growth: The Slowdown and its Macroeconomic Challenges” LAC Semiannual Report (April), World Bank, Washington, DC. Doi: 10.1596/978-1-4648-0609-4 License: Creative Commons Attribution CC BY 3.0 IGO Translations—If you create a translation of this work, please add the following disclaimer along with the attribution: This translation was not created by The World Bank and should not be considered an official World Bank translation. The World Bank shall not be liable for any content or error in this translation. Adaptations—If you create an adaptation of this work, please add the following disclaimer along with the attribution: This is an adaptation of an original work by The World Bank. Responsibility for the views and opinions expressed in the adaptation rests solely with the author or authors of the adaptation and are not endorsed by The World Bank. Third-party content—The World Bank does not necessarily own each component of the content contained within the work. The World Bank therefore does not warrant that the use of any third-party-owned individual component or part contained in the work will not infringe on the rights of those third parties. The risk of claims resulting from such infringement rests solely with you. If you wish to re-use a component of the work, it is your responsibility to determine whether permission is needed for that re-use and to obtain permission from the copyright owner. Examples of components can include, but are not limited to, tables, figures, or images. All queries on rights and licenses should be addressed to the Publishing and Knowledge Division, The World Bank, 1818 H Street NW, Washington, DC 20433, USA; fax: 202-522-2625; e-mail: [email protected]. ISBN (electronic): 978-1-4648-0609-4 DOI: 10.1596/978-1-4648-0609-4 Cover design: Kilka Diseño Gráfico. 2 | LAC Treads a Narrow Path to Growth: The Economic Slowdown and its Macro Challenges Foreword This semiannual report — a product of the Office of the Chief Economist for Latin America and the Caribbean Region of the World Bank — examines the macroeconomic challenges for Latin America and the Caribbean (LAC) as the global economy settles to an equilibrium with more modest growth and lower commodity prices. As is customary in this series, Chapter 1 starts by providing an overview of the global economy and its implications for the short and medium-term prospects of the LAC region. We argue that the region experienced an external shock that has shaped growth in recent years, and that this change in the global context is likely here to stay. Chapter 2 discusses the policy challenges faced by LAC countries as they try to accommodate to the “new normal” of the global economy. In particular, it discusses the rather limited fiscal and monetary space currently present in the region. It also argues that part of this limited policy space is associated with LAC’s relatively low savings rate. Moreover, it shows that in addition to the potential positive effects that higher savings could have on LAC’s ability to respond to shocks, it could also have a beneficial effect on long-term growth. The report was led by Augusto de la Torre, Regional Chief Economist, in close collaboration with Alain Ize, Senior Consultant, and Samuel Pienknagura, Research Economist. Substantive inputs were provided by Daniel Lederman and Marcela Sanchez-Bender, as well as members of the Regional Management Team from the Vice Presidency for Latin America and the Caribbean of The World Bank. Mauro Azeredo, Andrea Coppola, Mame Fatou, Julio Loayza, Antonio Nucifora, John Panzer, Cristina Savescu, Sergio Schmukler, Peter Siegenthaler and Julio Velasco, also provided useful comments. Martín Sasson, Magali Pinat and Rebecca Freeman provided outstanding research assistance. Last but not least, this report would not be possible without the unfailing administrative support of Ruth Delgado and Jacqueline Larrabure. April 2015 |3 4 | LAC Treads a Narrow Path to Growth: The Economic Slowdown and its Macro Challenges Executive Summary After almost a decade of strong performance in the 2000s, economic growth in Latin America and the Caribbean (LAC) decelerated in recent years. Since 2011, for four years in a row, average growth in the region has continuously slowed, from close to 4 percent to around 1 percent in 2014 and to about 0.8 percent forecasted for 2015. LAC’s sharp deceleration is at the tail-end of the big China cycle, which started when China joined the World Trade Organization in the early 2000’s. Under the pull of China’s unusually strong growth—itself the result of the combined effect of a gigantic shift toward the production frontier and a rapid expansion of such frontier driven by rising productivity and breakneck-speed factor accumulation—LAC experienced its best growth performance of the last 40 years and navigated rather successfully the largest global crisis since the Great Depression. As China’s growth finally bumped against inescapable ceilings, starting in 2011, LAC’s growth also hit the skids. Notably, economic activity decelerated most rapidly in LAC compared to all other emerging regions. This amplified slowdown reflects the key role played in the region by commodity prices. Investment in the region boomed as higher commodity prices raised the profitability of new oil, mining, and agricultural ventures, then collapsed, particularly in oil and minerals, as the decline of commodity prices lowered profitability or raised risk. The region’s high commodity dependence explains why the sharper growth slowdown in LAC was echoed by equally accentuated fluctuations in asset prices relative to other regions, including stock prices and exchange rates. Commodity dominance is also illustrated by the dramatically high correlation between commodity prices and the stock market price indices of many southern cone countries, notably Chile and Peru. Indeed, these countries experienced the investment amplifier effect with a vengeance. More generally, the countries that incurred terms of trade losses (mostly the commodity exporting countries from South America, who in the aftermath of the 2008 global financial crisis led the region in terms of growth) are now feeling the most the growth-impairing effects of the decline in commodity prices and weaker demand from China. It is these countries that have been driving the economic slowdown in the region. In contrast, the countries that benefitted from terms of trade gains (mostly the commodity importing countries in Central America and the Caribbean, which struggled in the aftermath of the 2008-2009 global financial crisis) are now facing a more benign external environment and experiencing steady or improving growth rates that are at present generally above the regional average. And so is Mexico, which is now benefitting from the pull of the consolidating recovery of the U.S. economy. Going forward, the evidence suggests that the external shocks emanating from China’s deceleration and terms of trade changes are permanent, firmly pointing in the direction of a permanent growth slowdown for the region taken as a whole. It seems quite unlikely that China could experience again a growth boom of the epic proportions seen in the first decade of the 21st century. Instead, China appears to be settling down around a lower and more sustainable growth trajectory where consumption will play a bigger role. While U.S. growth has been picking up, there are question marks on how long it can last, particularly in light of the sluggish European recovery, which remains uncertain, and the continued appreciation of the dollar against other currencies. It also seems unlikely that commodity prices might recover rapidly or that, by remaining depressed, they might by themselves boost world growth. Thus, more moderate growth for China and cautious growth projections for the G-7 signal an average growth rate for LAC of the order of two to two and a half percent, a “new normal” that is only marginally above the region’s growth rate prior to the start of the big China cycle. Remarkably, the permanence of the growth deceleration seems to be sinking in the minds of most LAC consumers and even LAC governments only now. Indeed, the region’s domestic saving rate started declining during the 2010-2011 recovery from the global financial crisis, suggesting that consumers perceived the recovery to be permanent. A silver lining |5 in that period was that the region’s increased use of foreign saving (the widening of the current account deficit) financed a pickup in investment (relative to GDP) back to the levels achieved during the 2003-2008 boom period. But the regional saving rate continued to fall during the 2012-2015 deceleration phase, suggesting that consumers thought the deceleration to be transitory. This time around, however, the region’s resort to foreign saving (a further widening of current account deficit) went to finance consumption, rather than investment. The fact that labor markets had until recently remained relatively buoyant and with significant wage inertia contributed to boosting consumption, despite the fall in output. Arguably, governments incurred similar misperceptions. Many fiscal authorities engaged in a second round of fiscal expansions as their economies started to decelerate. The vigor of such expansions in the face of the sustained declines in fiscal revenues, which resulted in a substantial worsening of fiscal positions (more on this below), suggests that the shock was not perceived as permanent. LAC’s policy response to the deceleration must now find a proper balance between short-term adjustment—the macroeconomic transition to a new equilibrium real exchange rate—and the rekindling of growth. However, the policy response will necessarily depend on the direction in which countries are being affected by the shock. Countries impacted positively—i.e., experiencing terms of trade gains and the benefits of higher external demand coming from the U.S.— are having a much better time than those impacted negatively—i.e., enduring the pains of terms of trade losses and weaker demand from China. The policy response must also reflect the availability of instruments. Commodity exporters without exchange rate flexibility and thin fiscal buffers are having in this respect the hardest time of all. And, last but not least, the policy response depends on the space available for countercyclical monetary or fiscal policies. However, whether reflecting misjudgment on the nature of the shock or deeper structural constraints, policy space appears to be a rather scarce commodity in LAC. Central banks in commodity exporting countries across the region, particularly those with full-fledged inflation targeting regimes, are being put to the test—inflationary pressures are building up, forcing monetary policy to remain tight, even as economic activity is trending down. This “lack of divine coincidence big time” (whereby the interest rate required to keep inflation under control is inconsistent with that might be needed to minimize the fall in economic activity) will probably be the first such episode LAC central banks as a group will be experiencing since the advent of inflation targeting. While the inflationary pressures clearly originate from the exchange rate depreciations caused by the strong dollar and the declines in the terms of trade, their vigor seems to have come as a surprise. The rising pass-through of exchange rates to prices may be because depreciations are now increasingly been perceived as permanent rather than transitory. Under full monetary credibility the price increases driven by exchange rate depreciation should take the form of a strictly one-time change in the price level. Hence, under such circumstances, an accommodating monetary policy would help cushion the downturn while rekindling investment and growth. Yet, the risk of second-round effects on prices and wages may be high enough to warrant monetary tightening (despite the weakening in domestic economic activity) in order to keep inflationary expectations anchored. The monetary space in the region is further constrained because most central banks are currently bumping against their inflation targets and labor markets continue to be rather tight. Moreover, sharp exchange rate depreciations could stress corporations in view of their recent increase in dollar-denominated indebtedness (which is largely the counterpart of the decline in domestic saving during the crisis recovery period) and this, again, may further reduce the room for central banks to lower interest rates. Absent space on the monetary side, fiscal expansions could in principle be used to avoid a downward overshooting of economic activity. Yet, space there also appears to be confined. Fiscal sustainability indices, which looked great before the global crisis, have deteriorated across the region, to the point of becoming problematic in some countries. At the same time, the bias of the fiscal stimulus packages in many countries has been toward consumption-oriented spending and transfers, rather than investment expenditures, casting a shadow on the growth-friendliness of these packages. A possible explanation of such biases could be related to the small average size, relative to international benchmarks, of LAC 6 | LAC Treads a Narrow Path to Growth: The Economic Slowdown and its Macro Challenges governments, in turn a reflection of under-sized average public revenues. Thus, the typical small LAC government could have been repressing much needed expenditures on social services, which came flooding through the gates once spending restrictions were lifted to allow for fiscal stimuli. However, the evidence points in the opposite direction, toward structural spending biases, for it was in fact the largest governments in the region that tended to engage the most in consumptionoriented spending. Indeed, only a very few countries in the region (notably Chile, but also Bolivia and Peru) can claim to have reasonable fiscal space at present, largely owing to high saving during the past years leading to lower government debt and/or net international reserve accumulation. The time seems therefore ripe for the region to work on broadening its macroeconomic policy space. On the monetary side, this means more flexibility to allow for temporary deviations of the inflation rate from its target at times of supply shocks. While a further build-up of credibility may be required, the question arises as to whether some broadening of the inflation target bands might also be appropriate. On the fiscal side, the policy space could be broadened through the introduction or strengthening of fiscal rules, automatic stabilizers, and the like. However, a key lesson of the recent experience is that for such arrangements to work effectively, the transitory or permanent nature of the shocks needs to be properly appraised. There is also a complementary need for a domestic saving mobilization in the region, a point of emphasis in which this report follows a novel path. The key is that higher saving rates would provide more breathing space for monetary and fiscal policy, including by helping to avoid becoming boxed into difficult macroeconomic predicaments such as those faced at present by some countries in the region. In addition, there is increasing evidence that saving also matters for growth, particularly in middle-income countries with persistent current account deficits. Domestic saving can promote growth by both depreciating the equilibrium real exchange rate, hence boosting external competitiveness, and reducing the dependency on foreign saving, hence reducing the cost of capital and enhancing the sustainability of growth. In this regard, the report argues that, provided suitable policies, China’s expenditure shift toward consumption could have a non-negligible impact on LAC’s growth by raising the region’s saving rates and, hence, depreciating its real exchange rates. A fiscal strengthening emphasizing an in-depth restructuring of public finances toward more efficient and growth-oriented public spending is clearly needed. The current juncture is of course not ideal for a major fiscal tightening. Yet, public and private saving mobilization should be a central part of the growth- and macro stabilization-oriented reform agenda going forward. Saving mobilization is, to be sure, a broad and ambitious agenda involving simultaneous action on many fronts, including in the fiscal, financial, and social protection areas. While saving skeptics do have a point (raising saving is certainly not an easy proposition), the proposition that saving is completely beyond the reach of policy and, hence, cannot realistically be placed on any policy agenda, is untenable. Of course, such saving mobilization effort cannot be done in one day and implementing it in the midst of a deceleration may not be advisable. Nonetheless, it should already color the policy agenda and priorities in the region, as it pivots towards a broader homegrown pro-growth agenda. |7 8 | LAC Treads a Narrow Path to Growth: The Economic Slowdown and its Macro Challenges Chapter 1: LAC’s Growth in the New Global Context Introduction After almost a decade of strong performance in the 2000s, growth in Latin America and the Caribbean (LAC) has decelerated in recent years. Since 2011 average growth in the region has continuously slowed, from close to 4 percent to about 1 percent in 2014. Moreover, the slowdown in LAC in 2014 was particularly large—the 1.6 percentage points decline in average growth observed from 2013 to 2014 was the sharpest since 2009. To a large extent LAC’s weak growth performance in the past 2-3 years, and particularly in 2014, was unexpected. According to data from the December 2013 Consensus Forecasts, growth in LAC in 2014 was expected to stand at 2.9 percent, close to 2 percentage points above the growth rate that actually materialized for the year. To be sure, there was heterogeneity in terms of the gap between expected and actual growth among LAC countries. The largest economies in the region lead the downward adjustment: Brazil, Chile, Peru and Venezuela reported the largest gaps between the beginning of year growth forecast1 for 2014 and the actual 2014 growth rate (Figure 1.1, Panel A). In contrast, Central American economies like the Dominican Republic and Guatemala, and also some South American economies like Bolivia and Colombia, grew in 2014 at rates that exceeded their beginning of year forecasts. Interestingly, the recent pattern of underwhelming growth in LAC relative to forecasts, especially in commodity exporting economies, stands at odds with what was observed prior to 2012.2 During the pre-crisis years (2003-2007) and the post-global crisis recovery years (2010-2011), observed average growth in both commodity importers and commodity exporters in the region systematically exceeded beginning of year expectations (Figure 1, Panel B and Panel C). In contrast, since 2012 performance relative to beginning of year expectations in commodity exporters and commodity importers has differed—the former have significantly underperformed while the latter have slightly over performed. Throughout this Chapter we take the beginning of year expected growth rate in year t to be the growth forecast for t reported in the December Consensus Forecasts of the previous year. In the case of the growth forecast for 2014 this means taking the December 2013 growth forecast for 2014. 1 Throughout this report we divide the region into two broad groups of countries: commodity exporting countries and commodity importing countries. The group of commodity exporting economies in LAC includes: Argentina, Belize, Brazil, Bolivia, Colombia, Chile, Ecuador, Mexico, Panama, Paraguay, Peru, Uruguay, Suriname, Trinidad and Tobago, and Venezuela. To be sure, most countries in the region are net exporters of some commodity. Yet, we decided to use the aggregate commodity balance to group countries. Most countries in the commodity exporters group have experienced sharp terms-of-trade losses in the 2011-2015 period while most commodity importing countries have experienced gains or mild losses in terms-of-trade over the same period. For more details on the methodology used to classify countries by commodity exporting status see Appendix 1. 2 |9 FIGURE 1.1. The Heterogeneity of LAC’s Deceleration PANEL A. Gap between Actual and Expected Growth in 2014 8% DOM 7% 6% BOL Real GDP Growth, Actual 2014 5% COL 4% GTM HND 3% 2% URY SLV ECU CRI PAN NIC PRY PER MEX CHL 1% BRA 0% -1% -2% -3% VEN -4% -4% -3% -2% -1% 0% 1% 2% 3% 4% 5% 6% 7% 8% 2014 Real GDP Growth, Forecast December 2013 PANEL B. Gap between Actual and Expected Growth - Commodity Exporters PANEL C. Gap between Actual and Expected Growth - Commodity Importers Simple Averages Simple Averages 8% 8% 7% 7% 6% 6% 5% 5% 4% 4% 3% 3% 2% 2% 1% 1% 0% 0% -1% -1% -2% -2% 2003 2004 2005 2006 Actual Growth 2007 2008 2009 2010 2011 2012 2013 2014 Growth Forecast, Beginning of Year 2003 2004 2005 2006 Actual Gowth 2007 2008 2009 2010 2011 2012 2013 2014 Growth Forecast, Beginning of Year Notes: Beginning of year forecasts for year t corresponds to the forecast from the December Consensus Forecast of year t-1. Commodity Exporters includes Argentina, Brazil, Chile, Mexico, Venezuela, Colombia, Peru, Bolivia, Ecuador, Panama, Paraguay, Uruguay. Commodity Importers includes Costa Rica, Dominican Republic, El Salvador, Guatemala, Honduras, and Nicaragua. Sources: Consensus Forescats and national sources. The marked contrast in growth performance in recent years between LAC-7 countries3 and those in Central America and the Caribbean hints at the importance of external factors in explaining the region’s current deceleration. The former, mainly commodity exporting economies with growing links to China, grew at a vigorous pace in the 2000s and are currently experiencing the most noticeable growth decelerations. The latter, mostly importers of commodities with tight links to the U.S., tend to exhibit a different trend; while they grew at par with commodity exporters in the 2000s they are currently growing above the LAC average. The rest of this chapter discusses in greater detail LAC’s recent growth performance and prospects in the context of the current global juncture. It first examines the main external forces affecting LAC’s economies, namely China’s and the G-7’s growth and commodity prices, and how these affect cyclical growth performance within the region heterogeneously. The chapter then analyzes the impact of the 3 Argentina, Brazil, Chile, Colombia, Mexico, Peru, and Venezuela. 10 | LAC Treads a Narrow Path to Growth: The Economic Slowdown and its Macro Challenges current external economic environment on LAC in comparison with other emerging regions. Finally, it provides a brief taste of the main external risks faced by the region going forward. The Global Economic Context and Its Impact on LAC Over the past two years, economic and financial news from the world have pointed to a global context marked by three main characteristics: i) the recovery of the U.S. economy and, as a consequence, the foreseeable normalization of monetary policy in the U.S.; ii) the soft landing of the Chinese economy towards a more sustainable growth between 6 and 7 percent; and, relatedly, iii) commodity prices that stand at more modest levels relative to their 2011 peak.4 The combination of these factors, together with unpromising growth in Europe, has been described as the new normal for the global economy.5 LAC is taking notice that the current global context, while not unsupportive of the rather modest growth rates observed in recent years, will not push the region to the heights we saw prior to the global financial crisis of 2008-2009. After all, it is undeniable that in the 2000s LAC benefited from powerful global tailwinds that lifted the region to unprecedented growth rates. Today the same factors that propelled the region in the 2000s are playing an opposite role as they shape LAC’s lackluster growth. Moreover, this new normal for the global conditions is not exempt of uncertainty and surprises, as reflected by the events in recent months. Since our October 2014 LAC Semiannual Report, the world economy saw two important developments: the rapid fall in the price of oil and renewed doubts about the economic fate of the Euro area. For LAC taken as a whole these events translated into a frankly magnified slowdown in economic activity, sharp declines in currencies, and increased volatility in stock markets. LAC’s Deceleration is Largely a Reflection of a Negative External Shock A simple plot of average growth in LAC against the growth rates of the U.S. and China and commodity prices (proxied by changes in the CRB index) highlights the strong link between the region’s performance and external factors, especially since 2003 (Figure 1.2, Panel A).6 Following a volatile period during the 1990s and early 2000s, LAC’s growth took off after 2002 in tandem with a strong surge in growth rates in China, the U.S. and commodity prices. This process remained strong even after the U.S. economy started to decelerate in 2004, on account of fast growth in China and booming commodity prices.7 This led to a brief period that has been referred as LAC’s real decoupling from Commodity prices have declined significantly since 2011. However, as will be discussed later in the chapter, there is still uncertainty regarding future levels and there may be upside risks. Nevertheless, everything points at commodity prices that will stand below peak levels. 4 This “new normal” state of the global economy has been described in previous editions of the LAC Semiannual Report. Specifically, the April 2013 Report “LAC as Tailwinds Recede: In Search of Higher Growth” highlighted that the world economy was no longer providing strong tailwinds for LAC region, even if the probability of downside tail risks relative to the years following the global financial crisis had declined. 5 The Thompson Reuters/Jefferies CRB Index (TR/J CRB) was originally designed to provide a dynamic representation of broad trends in overall commodity prices. In order to fulfill this role, its component and formula have been periodically adjusted to reflect changes in market structure and activity. 6 The growing importance of China’s economy on LAC is documented in the October 2011 LAC Semiannual Report “LAC Long-term Growth: Made in China?” and in de la Torre et al. (2015, forthcoming). In both these documents it is argued that the impact of China on LAC can be interpreted as a combination of two China-centered global shocks: i) a 7 | 11 developed economies. China’s growth and high commodity prices, and to a lesser extent the mild recovery of the G-7, also propelled a fast recovery in LAC during 2010-2011, following the global crisis. After 2011, however, these same external drivers steadily softened and, as result, LAC has joined what has been coined as the “great deceleration” of emerging markets.8 FIGURE 1.2. The Role of External Factors in LAC’s Deceleration PANEL A. Growth Rates of LAC, China, PANEL B. The Predictive Power of and the U.S. and Commodities 14% LAC's First Decoupling 12% LAC's Recoupling LAC's Second Decoupling External Factors on LAC’s Growth 160 8% 140 6% 10% 120 4% 80 2% 60 0% Real GDP Growth 100 6% Index Base 2010=100 8% 4% 2% 0% 40 20 -4% 0 2001q1 2001q3 2002q1 2002q3 2003q1 2003q3 2004q1 2004q3 2005q1 2005q3 2006q1 2006q3 2007q1 2007q3 2008q1 2008q3 2009q1 2009q3 2010q1 2010q3 2011q1 2011q3 2012q1 2012q3 2013q1 2013q3 2014q1 2014q3 -6% LAC YoY Growth US YoY Growth China YoY Growth Real CRB Commodity Index (rhs) -2% -4% 1995q1 1995q4 1996q3 1997q2 1998q1 1998q4 1999q3 2000q2 2001q1 2001q4 2002q3 2003q2 2004q1 2004q4 2005q3 2006q2 2007q1 2007q4 2008q3 2009q2 2010q1 2010q4 2011q3 2012q2 2013q1 2013q4 2014q3 -2% GDP YoY Predicted GDP YoY Notes: In Panels A and B averages are taken over a set of fifteen LAC countries with available quarterly data, namely: Argentina, Brazil, Bolivia, Chile, Colombia, Costa Rica, Dominican Republic, Ecuador, El Salvador, Guatemala, Jamaica, Mexico, Paraguay, Peru, and Uruguay. In panel A growth rates and the commodity price index are smotthed using a 4-quarter moving average. In panel B, average predicted growth is calculated by averaging the fitted values of country regressions of GDP growth on G-7 growth, China’s growth, the CRB commodity index, and the U.S. 10 year treasury rate. Sources: LCRCE Staff calculations based on Consensus Forecasts, Bloomberg, national sources and DECPG. To delve into the role of external factors that explain LAC’s cyclical performance over the past 20 years, we compare the de-trended growth rate of the countries in the region vis-à-vis the average predicted by an econometric model run for each country. In our model, growth rates are a function of four factors: G7 and Chinese growth (proxies of external demand); commodity terms of trade (proxied by the CRB index of commodity prices); and international liquidity (measured by the yield of the 10-year U.S. Treasury bill).9 This econometric model, labeled the Wind Index Model (WIM), has been repeatedly used in previous editions of the LAC Semiannual Report series and is useful for two reasons. First, contrary to the simple plot in Panel A of Figure 1.2, the WIM allows us to separate the individual effect that each of the four external factors described above has on LAC’s growth. Second, the WIM enables us to estimate the impact of external factors at the country level which allows us to separate countries according to their exposure to changes in each of the four external variables. The flexibility to demand shock that raised commodity prices and promoted world trade and output growth, and ii) a supply shock that inundated manufacturing markets, reducing the price of finished goods. For LAC as a whole these two effects translated into a positive and large terms-of-trade gains. The term “great deceleration was first used by the Economist to describe the marked slowdown in the biggest emerging countries, the so called BRICS. The October 2014 LAC Semiannual Report “Inequality in a Lower Growth LAC” discusses some of the features of the “great deceleration” from LAC’s point of view. 8 There is evidence that both the correlation of G7 and Chinese growth and their incidence on developing economies have differed significantly (Levy Yeyati and Williams, 2012); therefore we look at them separately. 9 12 | LAC Treads a Narrow Path to Growth: The Economic Slowdown and its Macro Challenges disentangle the effects of these four variables by country is especially important in the current juncture where Chinese growth is softening and commodity prices are decreasing whereas the U.S. economic growth is consolidating. The next few paragraphs describe the WIM’s results both for the region as a whole and for individual LAC countries. The WIM clearly reaffirms the importance of external factors in determining LAC’s growth fluctuations (Figure 1.2, Panel B). The average predicted values of the WIM, which maps global factors into regional growth, closely follow the growth dynamics observed in region. Moreover, close inspection in the time profile of the difference between the WIM’s predicted values and observed average growth in LAC gives additional information on the recent history of economic growth in the LAC region. First, the fit of the model in the earlier years—especially prior to 2002—is relatively worse than in later years. This highlights that, while partly being affected by external factors, growth in LAC in the 1990s and the early 2000s was mostly responsive to domestic factors. This was the period where macro-financial crises and stabilization efforts gave economic performance in LAC a life of its own. In contrast, since 2002, LAC’s growth process has been more tightly linked to external factors. There are four clearly marked phases during this latter period: i) boom (2003-2008), ii) crisis (2009), iii) recovery (2010-2011) and iv) deceleration (2012-2014). The WIM confirms the view that LAC’s current deceleration is to a large extent a negative, albeit magnified, external shock.10 Indeed, contrary to the boom, crisis and recovery phases, the observed growth rates in LAC during the 2012-2014 deceleration phase have been noticeably lower than those predicted by the WIM. This suggests that in many countries the role of domestic factors (or external factors not captured in the model) on growth has gained prominence relative to that of external factors included in the econometric exercise. Among domestic factors one could point at domestic demand and policies, and, as discussed in greater detail in the second chapter of this report, the ability of governments to smooth out (via exchange rate, monetary, and fiscal policies) the effects of the external shocks. To be sure, there are indirect channels through which external factors may be amplified by domestic factors, channels that are not fully captured in our simple econometric model.11 We will return to analyze in more detail the indirect effect of external factors later on in the report. But first, we put LAC’s deceleration in international perspective. LAC’s Response to the External Shock: An International Perspective As mentioned, the main force behind LAC’s deceleration was arguably a negative external shock, mainly stemming from a slowdown in China and a decline in commodity prices. Evidence to this includes the fact that the slowdown in growth rates observed in LAC in the last two years relative to those prior to 2012 occurred in tandem with the rest of the emerging world (Figure 1.3, Panel A). Indeed, LAC’s progressive slowdown is comparable in timing but not in magnitude (see below) to the Clearly many countries in the region are suffering from domestic problems that have hampered their growth prospects. For example countries like Argentina, Brazil, and Venezuela are facing problems related to strong pressures on their exchange rates and electoral uncertainty that have played an important role in their recent lackluster performance. 10 A challenge is identifying domestic responses that are driven by domestic factors and those that are shaped by external forces. This difference may be important in countries such as Brazil where the recent deceleration is in part a response to fiscal and monetary tightening, which could be both a response to external or domestic forces. Despite being an important distinction, disentangling between these two forces is beyond the scope of the report. 11 | 13 one observed in the Middle Income Countries (MICs) from South East Asia12 and in China as was documented in previous LAC Semiannual Reports.13 Furthermore, the growth dynamics in these MIC regions differ from those observed in the G-7 where growth rates picked up overall in 2014 due to the recovery in the U.S. FIGURE 1.3. A Comparative Look at LAC’s Recent Performace PANEL A. GDP Growth and Forescasts PANEL B. Stock Markets Returns by Across Regions Region Index Base Jan 2011=100 160 12% 150 10% 140 130 8% 120 6% 110 100 4% 90 80 2% 70 0% 2013 2014e 2015f LAC ITs PANEL C. Exchange Rates by Region ECA SEA Mar-15 Oct-14 May-14 Dec-13 Jul-13 Feb-13 Apr-12 China Nov-11 2003-2012 excl. 2009 LAC Jun-11 G-7 Jan-11 SEA MICs Sep-12 60 ECA PCE PANEL D. Correlation between Stock (LCU/$US) Market Returns and Commodity Prices Index Base Jan 2011=100 Jan 2010-Mar 2015 150 1 140 0.8 0.6 Correlation Coefficient 130 120 110 100 0.4 0.2 0 PCE Russia Peru Colombia Chile Brazil Croatia Hungary Poland Canada Malaysia Lithuania Mexico Thailand Indonesia Turkey Australia Philippines Sweden Mar-15 Oct-14 May-14 Norway LAC Countries Czech Rep. SEA Dec-13 Jul-13 Feb-13 ECA United States LAC ITs Sep-12 Apr-12 Nov-11 Jun-11 -0.6 Jan-11 -0.4 80 New Zealand -0.2 90 Other Countries Notes: In Panel A, e: eestimate, f: forecast. ECA: Croatia, Czech Republic, Hungary, Lithuania, Poland, and Turkey. SEA MICs: Indonesia, Malaysia, Philippines, and Thailand. PCE: Australia, Canada, New Zealand, Norway, and Sweden. In Panels B to D LAC ITs includes Brazil, Chile, Colombia, Mexico, and Peru. Sources: LCRCE Staff calculations based on the March 2015 Consensus Forecasts, Bloomberg and IMF’s WEO. A closer look at LAC’s relative growth performance shows that the region has been hit particularly hard, especially over the past year. Indeed, LAC’s growth in 2014 was among the lowest in emerging As is customary in the reports in this series, we compare LAC against three regions: Eastern European (ECA) MICs comprised by Croatia, Estonia, Hungary, Lithuania, Poland, Romania, Slovakia, and Turkey, East Asian MCs comprised by Indonesia, Malaysia, Philippines, and Thailand, and Peripheral Core Economies (PCE), comprised by Australia, Canada, New Zealand, Norway, and Sweden. 12 For instance, the October 2012 Semiannual Report, “The Labor Market Story Behind LAC’s Transformation,” shows that all emerging markets displayed a slowdown of about 3 percentage points from 2010 to 2012. 13 14 | LAC Treads a Narrow Path to Growth: The Economic Slowdown and its Macro Challenges regions and the slowdown from 2013 to 2014 was the sharpest. This highlights what was already evident from the results of the WIM—the impact of the external shocks experienced by the LAC region was amplified by a number of factors that will be discussed in the next section. Moreover, while most emerging regions are expected to bounce back in 2015, LAC’s growth is expected to remain below 1 percent. LAC’s relative underperformance is also evident when looking at financial variables. The average stock market returns in the LAC-5,14 which are the most financially globalized countries in the region, trended downwards since 2011, losing close to 20 percent on average in that period. This stands in contrast to the positive returns observed in Asia, ECA, and other high income commodity exporting countries (PCE) (Figure 1.3, Panel B). Similarly, after strong appreciations in 2010-2011, currencies in LAC-5 depreciated on average close to 35 percent vis-à-vis the US dollar over the past three years, as external factors deteriorated. To be sure, a strong dollar has caused most currencies in emerging and developing countries to depreciate. Yet, the fall in LAC’s currencies is almost twice as large as the one observed in the currencies of East Asian MIC’s and is only comparable to the one observed in ECA’s currencies, which have suffered the hit of recent instability in Russia and the political tensions between Russia and Ukraine. (Figure 1.3, Panel C). The dynamics observed for commodity prices have played an important role in explaining not only the continuous currency depreciations but also the deterioration of stock markets in LAC. Countries in the region with non-shallow stock markets tend to be commodity exporting countries. Hence, stock markets in LAC display a strong correlation between stock market returns and commodity prices (Figure 1.3, Panel D). The tight link between commodity prices and LAC financial variables is a reflection of three important factors. First, large commodity producing firms, such as Petrobras or Vale, represent a large share of the capitalization of stock markets in the region. Second, stock markets in the region are concentrated in few countries which, as noted, tend to be commodity exporters. Finally, the region’s growth is especially sensitive to commodity prices, suggesting that the growth prospects of firms are tightly linked to commodity prices, even in sectors that are not linked to commodity production per se. External Factors and Their Effects on LAC’s Domestic Demand and Saving Thus far, the chapter has documented the tight link between external factors and growth rates in the LAC region. However, little has been said about the channels that make LAC so sensitive to external shocks. In what follows we investigate some of the macroeconomic traits of the region that catalyze external shocks. In the 2000s, LAC experienced large positive external demand and terms-of-trade shocks. LAC’s response was a rapid growth of domestic demand—driven by investment (rather by consumption) in many LAC commodity exporting countries—at the expense of a deterioration of the region’s current account balance. This stands in sharp contrast with the East Asian MICs, where external demand— rather than domestic demand—was in the driver’s seat. Indeed, the April 2013 LAC Semiannual Report documented how during the 2000s LAC saw a rapid increase in investment rates, especially in such commodity exporters as Chile, Peru or Ecuador, which partly closed the investment gap relative to the East Asian MICs that has traditionally marked the region. This implies that the positive external 14 The LAC-5 comprise Brazil, Chile, Colombia, Mexico, and Peru. | 15 demand and terms of trade shocks were metabolized in the region in the form of an endogenous response of domestic demand. Now that it faces a negative external shock, LAC is once more reacting through endogenous domestic demand responses, such that the impact of the shock is actually being magnified beyond the expected impacts predicted by the WIM. Indeed, a comparison between the deceleration in the 2012-2014 period predicted by the WIM and the observed decelerations in the same period show that most LAC countries—and especially commodity exporting ones—have suffered slowdowns that are larger than those predicted by changes in external factors (Figure 1.4, Panel A). FIGURE 1.4. The Response of Domestic Demand to the External Shock PANEL A. Observed Growth and Growth PANEL B. Investment’s Contibution to Residuals Unexplained by External Factors Average 2013q4-2014q3 10% 7% 8 8% 6% 6 6% 4 4% 2 2% 0 0% -2 -2% -4 -4% -1% -6 -6% -2% 5% 4% 3% PER Average Real Investment Growth 2004-2008 16% URY CHL COL 12% 10% BRA ECU CRI BOL 8% MEX 6% PRY 4% 2% 0% -10% SLV GTM -5% 0% 5% 10% Average Real Investment Growth 2014q1-2014q3 15% 2013q2 2013q3 2013q4 2014q1 2014q2 2014q3 PANEL D. Change in Governemnt Consumption Growth vs. Change in GDP Growth, 2014-2013 Change in the Average Growth of Government Expenditure in percentage points 20% ARG 2013q1 YoY Growth (rhs) 2008 vs. 2014 14% 0% Contribution of Investment to Growth - Other LAC Contribution of Investment to growth - South America (excl. Venezuela) GDP Growth - Other LAC GDP Growth - South America (excl. Venezuela) PANEL C. Investment Growth Rates, 2004- 18% 1% Dom. Rep. Bolivia Paraguay Colombia Uruguay Guatemala El Salvador Peru Growth Residuals Ecuador Costa Rica Chile Brazil Mexico Jamaica 2% Argentina in percentage points 10 GDP Growth in 2013 and 2014 20% 2014 minus 2013 8 6 NIC 4 2 CHL 0 BRA ARG -2 PER URY MEX CRI GTM BOL COL -4 -6 ECU -8 HND -10 -3.5 -3 -2.5 -2 -1.5 -1 -0.5 0 Change in the Average Growth of GDP in percentage points 0.5 1 1.5 Notes: In panel A, observed growth represents the average YoY growth rates over the period between 2013Q1 and 2014Q3. Average growth residuals are the average difference for the period 2013Q1-2014Q3 between average observed YoY growth and the average fitted values of country regressions of GDP growth on G-7 growth, China’s growth, the CRB commodity index, and the U.S. 10 year treasury rate. In panel B Other LAC includes Costa Rica, Dominican Republic, El Salvador, Guatemala, Jamaica, and Mexico. In panel C average real investment growth rates are the average YoY growth rates of investment over the specified period. In panel D, average growth rates for a specific year are calculated as the average YoY growth rates over the specified year. Sources: LCRCE Staff calculations based on national sources. 16 | LAC Treads a Narrow Path to Growth: The Economic Slowdown and its Macro Challenges Countries that deserve special mention are Bolivia, Ecuador, and Colombia, three of the region’s six fuel exporters.15 Figure 1.3, Panel A, shows that, in contrast to agricultural and metal exporters, these three countries’ growth rates have exceeded those predicted by the WIM in recent quarters. This contrast is likely associated to differences in the timing of the fall in oil prices relative to those of other commodities, with the former falling only since the second half of 2014 (see Box 1.B.1). This, combined with the fact that investment plans take time to unwind, explains the high investment growth rates observed in the first nine months of 2014 in these fuels exporters. In fact, these three countries are among the few commodity exporters that were able to sustain relatively high investment growth rates, at least through 2014. We will return to the differences in prospects between metal exporters and commodity exporters later in the chapter. Hence, investment continues to be the crucial element channeling external shocks into the domestic economy. In the same way that it paved the way to fast growth in the boom and recovery phases of the commodity exporting economies, it is now pushing down their growth rates (Figure 1.4, Panel B). In contrast, commodity importing economies, which had struggled to sustain high rates of investment, have seen an acceleration in investment in 2014. Terms of trade changes have thus led to a regional reconfiguration in terms of investment growth—countries that led the region in terms of investment growth during the boom and recovery periods are now among the countries with the lowest GDP growth rates (Figure 1.4, Panel C).16 Box 1.B.1: China and the Prices of Different Commodities The rise of China over the past two decades reshaped the global economy. As argued in the main text, one of the implications of China’s ascend was to foster a big demand shock that raised commodity prices (de la Torre et al., 2015, and references therein).17 Indeed, Figure 1.2, Panel A shows the high degree of synchronization between China’s growth and the CRB commodity price index.18 However, a look at the time profile of the prices of different commodities points at important discrepancies in the evolution of certain commodity prices and the growth of the Chinese economy, especially in recent years. Prior to 2011 commodity prices move in tandem with the growth of the Chinese economy, especially oil and metals (Figure 1.A.1, Panel A). Agricultural commodities display similar patterns, albeit with more modest growth. In contrast, since 2011 the prices of these three commodities have followed different paths (Figure 1.A.1, Panel B). 15 See Appendix 1 for a discussion about the criteria used to categorize countries into commodity exporters and importers. While declining commodity prices appear to play an important role in explaining the sharp drop in investment growth rates, this may also reflect countries reaching the optimal productive capacity in extractive sectors which translates into a tapering of investments in these sectors. Disentangling between these two hypotheses goes beyond the scope of this report. 16 Frankel and Rose (2010) show that global demand explains the rapid increase in commodity prices in the 2003-2008 period, even after controlling for other macroeconomic and supply side variables. This is indirect evidence of the importance of China’s growth on commodities as this was a period of rapid growth in China. 17 Throughout Box 1.B.1. we look at real commodity prices. Real prices are calculated as the commodity price or price index over the unit values of manufacturing goods (MUV). 18 | 17 Metals peaked in 2011 and lost about 20 percent in one year in real terms and have stabilized since 2012.19 Similarly, agricultural prices peaked in 2011 and have gradually declined by a little over 10 percent since then in real terms, albeit experiencing a slight rebound in 2014. The decline of both metals and agricultural commodities coincided with the slowdown of the Chinese economy— growth in China went from close to 9.5 percent in 2011 to about 7.5 percent in 2014. In contrast, the price of oil remained close to peak levels in nominal terms (and increased slightly in real terms) until mid-2014, falling close to 50 percent since then (20 percent in real terms). The differences in the evolution commodity prices noted above suggests that the elasticity of each of these commodities to China’s growth may be different. Cereals and metals appear to respond more closely to Chinese growth; oil less so. Indeed, as argued in Arezki and Blanchard (2014) and the January 2015 World Bank Group’s Commodity Markets Outlook, historically oil prices have responded to global demand (especially G-7 demand), geopolitical forces and the pricing behavior of OPEC. The latter two factors where crucial in keeping the price of oil at a relative high level through mid-2014 as the events that resulted in the so-called Arab Spring and tensions in the Middle East caused the price of oil to rise. Since then, things changed—receding tensions in the Middle East, changes in the oil extraction technology in North America, and a more accommodative stance by Saudi Arabia in terms OPEC’s pricing behavior, have resulted in a rapid decline in oil prices. Going forward, while all commodities are expected to remain at rather low levels, further divergence in the path of prices may arise. Agricultural commodities display the lowest uncertainty in terms of their future prices while metals and, more evidently, oil, exhibit a larger degree of uncertainty. We return to the forces shaping uncertainty in these commodities later in the Chapter. FIGURE 1.B.1. China’s Growth and the Evolution of Commodity Prices PANEL A. A Look at the Whole Cycle PANEL B. Zooming in—2011-2014 12% 380 10% 120 340 10% 260 220 6% 180 4% 140 100 2% Index Base 2001q1=100 8% 100 8% 7% 80 Index Base 2011q2=100 9% 300 6% 60 China YoY Growth Oil Index (rhs) Real CRB Metals Index (rhs) Real CRB Foodstuffs Index (rhs) China YoY Growth Oil Index (rhs) 2014q4 2014q3 2014q2 2014q1 2013q4 2013q3 2013q2 2013q1 2012q4 2012q3 2012q2 2012q1 2011q4 60 2011q3 5% 2011q2 20 2001q1 2001q3 2002q1 2002q3 2003q1 2003q3 2004q1 2004q3 2005q1 2005q3 2006q1 2006q3 2007q1 2007q3 2008q1 2008q3 2009q1 2009q3 2010q1 2010q3 2011q1 2011q3 2012q1 2012q3 2013q1 2013q3 2014q1 2014q3 0% Real CRB Metals Index (rhs) Real CRB Foodstuffs Index (rhs) Notes: Commodity price indices are in real terms. In particular they are expressed relative to the unit value of manufacturing goods (MUV). Source: Bloomberg, national sources and DECPG. Metals have lost close to 30 percent in nominal terms since 2011, with the largest decline occurring between 2011 and 2012. 19 18 | LAC Treads a Narrow Path to Growth: The Economic Slowdown and its Macro Challenges The link between the external environment and investment is perhaps most clearly delineated in the cases of Chile and Peru, both large exporters of metals. Investment in both these countries responded dramatically to the early decline in the prices of copper and other metals, which mirrored the Chinese process of “soft landing” towards a lower growth rate. The data thus suggest that the deceleration of the Chinese economy led to a decline in the price of metals that subsequently decreased the profitability of mining projects and reduced the returns of investment in these projects. As investment is forward looking, the expectations of permanently lower commodity prices led to sharp adjustments in investment decisions. Thus, the magnified deceleration in LAC’s GDP growth reflects, to a significant extent, an investment multiplier effect. To be sure, fiscal policy has cushioned the contraction in investment in countries that have fiscal space. Clear examples of this are, again, Chile and Peru, where government spending accelerated in 2014 at the same time as GDP growth decelerated (Figure 1.4, Panel D). Not all LAC countries, however, have fiscal space, as will be discussed in greater detail in Chapter 2 of this report. 20 In fact, there are already signs of a deterioration in the countercyclical ability in some countries where government spending has not expanded despite the sharp economic slowdown. Perhaps more important in sustaining positive growth in the region in the most recent years has been private consumption. Indeed, even as economic activity in LAC has decelerated and investment growth rates fell in many countries, consumption growth has remained resilient with growth of consumption averaging close to 3.5 percent among commodity exporters (and 2.7 percent among commodity exporters with negative investment growth rates). The pattern observed in 2014 in terms of the balance between investment and consumption differs significantly from what was observed in 2010-2011—while in the former period most countries in the region had higher consumption growth rates relative to investment growth rates, in the latter period the opposite was true (Figure 1.5, Panel A and Panel B). Once again exporters of fuels stand as the outliers to this pattern—these countries were among the few in the region were investment outpaced consumption both in the 2010-2011 period as well as in 2014. The resilience of LAC’s consumption amid the current deceleration is a bit of a puzzle and deserves some reflection. While there are many possible explanations that range from the role of social protection programs to myopic behavior by households, one obvious force has been the region’s still tight labor market. Despite the GDP growth slowdown, many countries in the region are still experiencing unemployment rates that stand close to historic lows (Figure 1.5, Panel C) together with rising real wages (Figure 1.5, Panel D). All of this suggests that the first round effects of the adverse terms of trade shock hit mainly commodity related activities with low labor intensity and low employment shares, and did not spread immediately (or spread at a relatively slow pace) to the rest of economy. However, there are signs that this lag is coming to an end, as some LAC commodity exporting countries are already experiencing increases in unemployment rates and a moderation in the real wage growth. Hence, going forward there may be deteriorations in labor market outcomes and in consumption in the region that would further dampen growth. Fiscal space was in effect greater in the region at the time of the global financial crisis and it was deployed countercyclically then. See for instance Frankel, Vegh, and Vulletin (2013). 20 | 19 FIGURE 1.5. Consumption and the Labor Markets PANEL A. Consumption and Investment PANEL B. Consumption and Investment Growth, 2013-2014 Growth, 2010-2011 Average 2013q4-2014q3 Average 2010-2011 16% 36% 30% 12% BOL PRY PER NIC 4% CHL CRI BRA URY GTM HND MEX COL ECU DOM 0% Consumption Growth Consumption Growth 24% 8% ARG 18% PRY URY 12% CHL -4% MEX NIC COL BOL GTM 0% -8% ARG ECU 6% DOM HND PER BRA CRI -6% -8% -4% 0% 4% Investment Growth 8% 12% -6% 16% PANEL C. Unemployment Rates in 0% 6% 12% 18% Investment Growth 24% 30% 36% PANEL D. Real Wages in Brazil and Chile Selected LAC Countries YoY Growth 13% 8% 12% 11% 6% 10% 4% 9% 2% 8% 7% 0% 6% -2% 5% 4% Brazil Chile 2007q2 2007q3 2007q4 2008q1 2008q2 2008q3 2008q4 2009q1 2009q2 2009q3 2009q4 2010q1 2010q2 2010q3 2010q4 2011q1 2011q2 2011q3 2011q4 2012q1 2012q2 2012q3 2012q4 2013q1 2013q2 2013q3 2013q4 2014q1 2014q2 2014q3 Dec-14 Jun-14 Sep-14 Mar-14 Dec-13 Jun-13 Sep-13 Mar-13 Dec-12 Jun-12 Sep-12 Mar-12 Dec-11 Jun-11 Sep-11 Mar-11 Dec-10 Jun-10 Sep-10 Mar-10 Dec-09 Jun-09 Sep-09 Mar-09 -4% Brazil Chile Notes: In panels A and B average real investment and consumption growth rates are the average YoY growth rates over the specified period. In panel C Brazil’s unemployment rate is seasonally adjusted by IBGE, while Chile’s is a three month moving average. Sources: LCRCE Staff calculations based on national sources and Economist Intelligence Unit. The flipside of the patterns in investment and consumption described above is the changes in the balance between domestic savings and the current account. In this regard, the region navigated through three periods with very different macro dynamics. During the boom phase (2005-2007), the investment rate rose rapidly and this was more than financed through increases in the domestic saving rate, therefore moving the current account into surplus (Figure 1.6, Panel A). Thus, it appears that, during the boom period, economies in the region perceived the positive external shock as transitory and decided to save the windfall. As domestic saving was more than enough to finance investment, some of it was exported abroad. In contrast, the strong rebound of commodity prices and the Chinese economy following the global financial crisis led to different investment/saving dynamics in LAC during the recovery phase (2010-2011): the investment rate recovered vigorously, though this time it was mostly financed via foreign saving, moving the region into current account deficits. This suggests 20 | LAC Treads a Narrow Path to Growth: The Economic Slowdown and its Macro Challenges that as the recovery materialized, economic agents in the region perceived it to signal a change in the trend and, as a consequence, expanded consumption (lowered domestic saving). Finally, as commodity prices started to fall and China’s growth softened and the region entered into the deceleration phase (2012-present), the current account moved further into negative territory, implying an active resort to foreign saving. This time, however, as the investment rate dropped steeply, foreign saving was used mainly to finance consumption. Hence, in this final stage, households in the region are still responding as if the shock is transitory, while firms are responding as if the shock is permanent. Once again, this response may be linked to the tightness of LAC’s labor markets even in the face of the current negative shock. The three acts described above also had important differences on the financing side of LAC’s external accounts (the financial and capital accounts) (Figure 1.6, Panel B). In the first act, the boom (20052007), increases in LAC’s current account surpluses where matched by mild increases in portfolio investment while FDI flows were relatively stable, leading to significant increases in international reserves.21 In the second act, the recovery (2009-2011), the financing of investment occurred mainly through increases in portfolio flows. Indeed, during these period there was an important increase in corporate lending, especially in foreign currency. In the last act, the deceleration (2012-2014), the increase in consumption, which widened the current account deficit, was mainly financed through a reduction of international reserves. FIGURE 1.6. External Accounts, Domestic Savings and Invetment in LAC-6 PANEL A. Changes in Investment, Savings PANEL B. Changes in LAC’s Capital and the Current Account 5 Boom Recovery Account Deceleration 6 Recovery Deceleration 4 3 in percentage points of GDP in percentage points of GDP 4 Boom 2 1 0 2 0 -2 -4 -1 -2 2005q1-2007q4 Change in Domestic Saving 2009q2-2011q4 Change in External Saving 2012q1-2013q4 Change in Investment -6 2005q1-2007q4 2009q2-2011q4 2012q1-2013q4 Change in Portfolio Investment & Other Investment Change in Direct Investment, net Change in Reserve Accumulation Notes: Variables are expresed in terms of changes from the beginning to end of the period specified, and are calculated as the simple average of LAC-6 countries, namely, Argentina, Brazil, Chile, Colombia, Mexico, and Peru. Sources: LCRCE Staff calculations based on IMF’ IFS. The connection between saving, consumption, investment and external financing may have important implications for the policy space in the region. On the one hand, despite the short improvement in saving observed during the boom period, LAC continues to be a low saving region. This pattern may limit the region’s growth potential as well as its ability to boost its space for macroeconomic policy response, as discussed in Chapter 2. Moreover, the rise in foreign currency-denominated corporate To be sure, as was highlighted in the April 2013 LAC Semiannual Report, in terms of levels, the largest component in LAC’s financial account in the 2003-2014 period was FDI. Yet, since the FDI/GDP ratio is relatively stable, changes in financing needs were met mainly through changes in international reserves and portfolio flows. 21 | 21 bond issuance observed in the LAC-5 during recent years may conceal currency mismatches that could further constrain monetary policy.22 In particular, currency mismatches in the non-tradable corporate sector may limit the ability of central banks in the region to use depreciations as external shock absorbers for fear of damaging the balance sheets of debtors.23 The patterns described above fit well the dynamics of many countries in the region, especially the commodity exporters. However, closer inspection reveals important differences across individual LAC countries, especially in terms of the exposure to external factors and their effects on economic activity. The next section discusses in more detail LAC’s heterogeneity in this respect. The Heterogeneous Exposure to the Negative External Shocks Across LAC Naturally, the relation of the local economy to the global context varies from country to county. This implies that the impact on growth that external factors have and will have going forward will vary by country and will depend on the exposure of each country to each of these factors. In effect, a simple look at the distinction between net commodity exporting and net commodity importing countries, especially with respect to oil and metals, which are the commodities that have suffered the biggest price drops in recent years, points to the countries that are on the receiving end of the negative or positive effects, respectively, of the external shocks (commodity price declines, deceleration in China, economic recovery in the U.S.) (Figure 1.7, Panels A). On this basis, while exposure to external shocks does not map one-to-one to vulnerability to external shocks (on account of cross country differences in policy response capacity)24 it is not surprising to see mineral commodity exporting countries like Brazil, Chile, and Peru among the countries with largest gaps between expected (per the Consensus Forecasts) and actual growth in 2014, and commodity importing countries like the Dominican Republic, Guatemala and Honduras, growing above expectations. The results from the WIM provide an alternative way to analyze the heterogeneity within LAC. Indeed, the model suggest a clear typology of countries in the region. On the one hand, commodity importing countries, with negative/neutral elasticity to commodity prices and high growth elasticity with respect to economic activity in the U.S., are expected to experience stronger external tail winds. This group includes most Central America and Caribbean economies (Figure 1.7, Panel B)25. On the other hand, countries that have a large positive elasticity with respect to commodities and/or China’s growth are expected to experience a clear softening in the external tail winds. This group includes countries from 22 See IDB (2014) and (2015). The key factors leading to the so-called fear of floating are currency mismatches in debtor balance sheets and the passthrough from the exchange rate to prices (see Calvo and Reinhart, 2002). Fear of floating was arguably the main reason behind LAC’s tradition of pro-cyclical monetary policy prior to 2003. Yet, reductions of the pass-through and improvements in the currency composition of LAC’s corporate sector led many to believe that the fear of depreciations was largely dispelled, though the fear of appreciation was still present (see Levy Yeyati, Sturzenegger and Gluzmann (2013) and our October 2013 LAC Semiannual Report). However, recent trends in the measured pass-through and in corporate balance sheets have revived to some extent the fear of depreciation. 23 For a discussion on the differences between exposure and vulnerability across LAC countries see our previous semiannual reports, particularly the April 2012 LAC Semiannual Report “LAC Copes with Volatility, the Dark Side of Globalization.” 24 Figure 1.3, Panel B displays the elasticity to G7 growth (horizontal axis), the elasticity to China’s growth (vertical axis) and the elasticity to commodity price growth (bubbles). The sign of the elasticity to commodities is reflected by the color— blue means negative elasticity and red means positive elasticity—and the magnitude of the coefficient is captured by the size of the bubble. Finally, bubbles with a lighter color reflect a statically insignificant elasticity. 25 22 | LAC Treads a Narrow Path to Growth: The Economic Slowdown and its Macro Challenges the Southern cone such as Argentina, Paraguay Peru and Uruguay that have a very large elasticity with respect to China’s growth, as well as Chile which has a very large positive elasticity to changes in commodity prices.26 As was mentioned earlier, Ecuador, which has a positive and relatively large elasticity to commodity prices also falls into this latter category. However its exposure to the external shock is largely associated to the factors that govern oil prices. FIGURE 1.7. The Heterogeneous Response to External Factors across LAC PANEL A. Net Commodity Import PANEL B. Elasticity of LAC Countries to Balance across LAC Countries 2 Partial Elasticity to China YoY Growth 40% External Factors Net Imports/GDP in 2013 30% 20% 10% 0% -10% -20% -30% -40% ARG URY 1.5 PRY 1 PER BRA COL CRI DOM JAM 0.5 CHL GTM BOL ECU SLV 0 MEX Bolivia Paraguay Trin. & Tob. Chile Ecuador Venezuela Colombia Peru Belize Uruguay Argentina Brazil Suriname Panama Mexico Guatemala Honduras Guyana Costa Rica Ant. & Barb. Dom. Rep. St. Kit. & Nev. Nicaragua El Salvador Jamaica Bahamas Dominica Grenada Haiti St. Vinc. & Gren. St. Lucia -0.5 -0.5 0 0.5 1 1.5 2 Partial Elasticity to G-7 YoY Growth Significant Positive Elasticity to Commodity Prices Non-significant Positive Elasticity to Commodity Prices Significant Negative Elasticity to Commodity Prices Non-significant Positive Elasticity to Commodity Prices PANEL C. Growth Deceleration in LAC Countries, 2014 vs 2013-2011 12 10 8 in percentage points 6 4 2 0 -2 -4 -6 -8 Venezuela Argentina Panama Peru Chile LAC Ecuador Brazil Guyana Uruguay Paraguay Suriname Mexico Costa Rica Nicaragua Barbados Haiti Bolivia St. Lucia Colombia Honduras Belize Dominica El Salvador St. Vinc. & Gren. Guatemala Jamaica Ant. & Barb. Grenada Trin. & Tob. St. Kitts and Nev. Dom. Rep. -10 2014 Growth minus 2011-2013 Average Growth 2011-2013 Average Growth Notes: In panel A, net commodity balance is calculated as the difference between commodity imports and commodity exports as a share of GDP in 2013. For more information see Apenndix A. In Panel B elasticities are obtained from a regressions of GDP growth on G-7 growth, China’s growth, the CRB commodity index, and the U.S. 10 year treasury rate. The elasticity to G7 growth is on the horizontal axis, the elasticity to China’s growth is on the vertical axis and the elasticity to commodity price growth are represented by the size and colors of the bubbles. In particular, the sign of the elasticity to commodities is reflected by the color—blue means positive elasticity and green means negative elasticity—and the magnitude of the coefficient is captured by the size of the bubble. Finally, bubbles with a pattern reflect a non-statistically significant elasticity. In panel C, 2014 is an estimate based in the March 2015 Consensus Forecasts. Sources: LCRCE Staff calculations based on March 2015 Consensus Forecasts, natinal sources, and UN’s Comtrade.. To be sure, all South American countries also have a positive elasticity to growth in the U.S. This implies that the softening of China’s growth and the fall in commodity prices is expected to be partly offset by growth in the U.S. However, China matters now relatively more than the U.S. to these countries. The rising co-movement between economic activity in China and LAC countries has been discussed and documented in previous semiannual reports in this series. See, in particular, the October LAC Semiannual Report “LAC’s Long-term Growth: Made in China?” 26 | 23 In this sense, the current external environment has reversed growth dynamics in the region relative to what was observed during 2003-2012, and especially during the 2010-2011 recovery. Commodity exporting countries from South America, who in the aftermath of the 2008 global financial crisis led the region in terms of growth, are feeling the growth-impairing effects of the decline in price of commodities and the softer demand from China. In contrast, countries in Central America and the Caribbean, who struggled in the aftermath of the 2008-2009 global financial crisis, are now facing a more benign external environment and experiencing steady or improving growth rates (Figure 1.7, Panel C). While external factors may condition the region’s growth prospects, the soundness and effectiveness of domestic policies will ultimately determine the strength with which the current environment will affect countries in the region. Thus, in the short-run, countries with better shock absorption capacity and stronger domestic fundamentals will be more able to mitigate and smooth out the impact of external shocks on production and employment. In the long-run growth, all countries in the region should still aim at tackling important structural reforms to unclog the bottlenecks that have constrained LAC’s growth potential for a long time. The challenge that arises is that policies aimed at tackling short-term problems may be at odds with those aimed at tackling LAC’s low long-run growth potential. We will revisit and provide a more detailed discussion in this regard in Chapter 2 of this report. LAC and the Global Context Going Forward Many of the countries that had growth disappointments in 2014 are expected to rebound somewhat in 2015. Growth is expected to accelerate in Chile, Mexico and Peru, and to a lesser extent, Paraguay (Figure 1.8, Panel A). Indeed, an uptick in investment together with robust consumption growth are expected to lift GDP growth rates in these countries (Figure 1.8, Panel B and Panel C). Growth rates for these countries in 2015 are expected to be in the 3-4 percent range. In contrast, countries like Bolivia, Colombia, and most notably Ecuador, which were among the top growth performers in 2014, are suffering from the delayed effects of the negative external shock and are thus expected to decelerate in 2015. Growth forecasts for these countries in 2015 range significantly, however, from about 2.5 percent in Ecuador to close to 5 percent in Bolivia. Thus, Bolivia is expected to continue to be slightly behind Panama in delivering one of the strongest growth rates in the region in 2015. Commodity importing countries, mostly from Central America and the Caribbean, are expected to grow at rates above the regional average. Finally, three of the biggest countries in LAC, namely Argentina, Brazil and Venezuela are expected to experience GDP contractions in 2015 as the combination of domestic factors and less favorable global context takes its toll in consumption and investment rates. Given the relative importance of these three economies in the region, growth in 2015 in LAC taken as a whole is expected to fall slightly relative to the already low growth of 2014, from about 1 percent to about 0.8 percent. Going forward, a question remains: is LAC facing a permanent shift in external factors or a transitory deterioration soon to be reversed? The saving-investment dynamics described above suggest that economic agents, at least households, continue with their consumption patterns despite the drop in income possibly because they view the current external situation as transitory. But, is this view warranted? Arguably not. 24 | LAC Treads a Narrow Path to Growth: The Economic Slowdown and its Macro Challenges FIGURE 1.8. LAC’s Economic Outlook, 2014 vs. 2015 PANEL A. Real GDP Growth Estimations and Forecasts 8% 6% 4% 2% 0% -2% -4% 2014 e Dom. Rep. Bolivia Panama Colombia Paraguay Nicaragua Haiti Guatemala Ecuador St. Kit. and Nev. Guyana Costa Rica Uruguay Suriname Peru Honduras Mexico Trin. & Tob. Belize El Salvador Chile Ant. & Barb. St. Vinc. & Gren. Grenada Dominica LAC Jamaica Brazil Argentina* St. Lucia Barbados Venezuela -6% 2015 f PANEL B. Investment Growth PANEL C. Consumption Growth 15% 6% 10% 4% 5% 2% 0% 0% -5% -2% -10% -4% -15% -6% Argentina Brazil Chile Colombia 2014 e 2015 f Mexico Peru Venezuela Argentina Brazil Chile Colombia 2014 e Mexico Peru Venezuela 2015 f Notes: All numbers in Panel A come from the March 2015 Consensus Forecasts report. 2014 numbers are estimates and 2015 numbers are forecasts. *: The February 2015 Consensus Forecasts estimate for growth in Argentina in 2014 was minus 1.5 percent. In contrast, a recent release of official numbers puts growth in Argentina for 2014 at 0.5 percent. However, Argentina is going through methodological revisions of its inflation and GDP calculations in accordance to the agreements made with the IMF. The IMF Excecutive Board will review the aforementioned issue with the Argentinean statistics in May 2015. e: estimate, f: forecast. Sources: LCRCE Staff calculations based on the March 2015 Consensus Forecasts. Recent estimates suggest that growth in the world economy will continue, albeit at a moderate pace. The January 2015 World Bank’s Global Economics Prospects Report points to an annual growth rate of approximately 3 percent per annum for the global economy in the next few years, almost half a percentage point above the global growth in 2012. However, contrary to the past few years, the increase in growth in the global economy has been mainly driven by high-income economies, especially the U.S.27 Growth in the U.S. has been firming. Importantly, there seems to be now a more solid feedback loop between strong economic activity and improved labor market conditions which translates into higher levels of consumer confidence. Indeed, the latest Consensus Forecasts puts growth in the U.S. at The April 2015 World Economic Outlook argues that potential output in the emerging and advanced economies has fallen relative to pre-crisis trends. However, potential output is expected to increase from current rates, while it is expected to decline further in emerging economies (see also Balgrave et al., 2015). 27 | 25 above 3 percent for 2015, the highest in about ten years (Figure 1.9, Panel A), and the labor markets are already at pre-crisis levels (the latest unemployment and job openings numbers are the best since 2008, Figure 1.9, Panel B). As a result, consumer confidence peaked in the last months of 2014, although since then it has declined slightly (Figure 1.9, Panel C). FIGURE 1.9. The Performance of the U.S. Economy PANEL A. GDP Growth and Inflation PANEL B. Labor Market Outcomes 3.5% 12% 3.0% 16000 14000 10% Unemployment Rate 2.0% 1.5% 8% 10000 6% 8000 6000 4% 1.0% Total Job Openings 12000 2.5% 4000 2% 0.5% 0.0% 2000 Real GDP Growth Inflation Unemployment PANEL C. Consumer Confidence 2014q3 2014q1 2013q3 2013q1 2012q3 2012q1 2011q3 2011q1 2010q3 2010q1 0 2009q3 2015 f 2009q1 2014 2008q3 2013 2008q1 2012 2007q1 2011 2007q3 0% 2010 Total Job Openings (RHS) PANEL D. Yield Curves 120 In March of the Year in Reference 5.0% 4.5% Index Base 1985=100 100 4.0% 3.5% 80 3.0% 2.5% 60 2.0% 40 1.5% 1.0% 20 0.5% 0.0% Jan-15 Jul-14 Oct-14 Jan-14 Apr-14 Jul-13 Oct-13 Jan-13 Apr-13 Jul-12 Oct-12 Jan-12 Apr-12 Jul-11 Oct-11 Jan-11 Apr-11 Jul-10 Oct-10 Jan-10 Apr-10 0 1 mo 3 mo 6 mo 1 yr 2010 2 yr 2012 3 yr 5 yr 2014 7 yr 10 yr 20 yr 30 yr 2015 Notes: In Panel A, f: forecast. Sources: The Conference Board, Consensus Forecasts, Department of the Treasury, and WDI. Interestingly, the acceleration in U.S. growth has been accompanied by a decline in inflation, which is expected to be close to zero in 2015 (Figure 1.9, Panel A). Partly a result of the sharp decline in oil prices, the lack of inflationary pressures has played a role in the Federal Reserve Bank’s decision to delay the increase of monetary policy rates. Furthermore, the expectation of near zero inflation has resulted in a significant flattening of the U.S. yield curve relative to recent years (Figure 1.9, Panel D). A flatter yield curve signals a more gradual process of monetary policy normalization in the U.S. which may mitigate the expected financial volatility that it may create in emerging markets, including LAC. While low inflation expectations may delay the timing and extent of monetary normalization in the U.S., normalization is almost certainly bound to happen eventually. This will of course increase the 26 | LAC Treads a Narrow Path to Growth: The Economic Slowdown and its Macro Challenges cost of capital world-wide but it may, in the process, unleash a new bout of volatility in international capital flows. This is in fact what happened in the recent past when markets adjusted expectations regarding the actions of the U.S. Fed. For instance, the October 2013 LAC Semiannual Report showed how the so-called tapering talks of former Fed Chairman Ben Bernanke resulted in large depreciations of LAC currencies and swings in stock markets. Moreover, it is clear that the rise in borrowing costs and the volatility that this may create could have an adverse impact on economic activity in the region. For instance, based on the estimation of the WIM, an increase in the 10 year treasury yield has a negative and significant effect on growth in 10 of the 15 countries for which we estimate the model. Hence, while everything points to a more moderate and gradual normalization of monetary policy in the U.S. relative to what was expected a few months ago, policy makers in the region may still face challenges from this process. More than through monetary normalization in the U.S., however, the real challenges for LAC still come from the lackluster performance of other large emerging markets, especially China. The socalled BRICS, who grew at an average rate of 5.4 percent in 2012 and 2013 are now expected to grow at a more moderate 5.1 percent in 2015. Perhaps the most salient growth deceleration and the most important from LAC’s standpoint is the one observed for China. As mentioned above, China’s economy appears to be soft-landing to a growth rate of about 6-7 percent per year, that is, 3-4 point below the growth rates it delivered during the recent boom years. The growth deceleration in China is arguably a byproduct of the reconfiguration of its domestic demand. The contribution to GDP growth of investment, the main driver of growth during China’s ascent, is receding gradually (Figure 1.10, Panel A). In contrast, the growth rate of consumption has remained relatively stable and kept pace with that of GDP over the last five years. The supply-side response of China’s transformation is the gradual deindustrialization and the rise of the services sector (Figure 1.10, Panel B). The lower growth dynamics of large emerging economies, particularly China, has depressed demand for commodities, especially mineral commodities. This downward trend was first evident in non-oil commodities prices which began softening in 2012. As was argued in Box 1.1, Oil prices have followed a slightly different path, with most of its decline occurring since the second half of 2014. Going forward, the market expects commodity prices, especially oil, to increase relative to the levels observed at the beginning of 2015 (Figure 1.11, Panel A and Panel B). Yet, the new medium-term equilibrium prices are expected to settle at levels that are much lower than those observed prior to 2012.28 To be sure, the lower demand for oil associated with more moderate growth in China is only part of the story in international oil markets, where the decline in equilibrium oil prices is in large part the result of supply side forces. First, changes in the extraction process, including “fracking,” in the U.S. and Canada have increased the world supply of fuels and have put downward pressure on prices. The U.S. alone has doubled its contribution to world supply in just two years. Second, OPEC decided in November to maintain their collective production ceiling of 30 million barrels a day in spite of a perceived glut, instead of restraining production to keep prices high as was done in the past.29 The prices reflected by futures are consistent with projections and estimates from IDB (2015) and the January 2015 World Bank’s Commodity Markets Outlook. 28 For more detail regarding the supply and demand forces behind oil price dynamics see the January 2015 World Bank’s Commodity Markets Outlook and Arezki and Blanchard (2014). 29 | 27 FIGURE 1.10. Outlook of China’s Economy PANEL A. China’s Growth by Demand PANEL B. Industrial Production Component YoY Change 25% 16% 14% 20% 12% 10% 15% 8% 10% 6% 4% 5% 2% Jul-14 Jan-15 Jul-13 Jan-14 Jul-12 Jan-13 Jul-11 Jan-12 Jul-10 Jan-11 Jul-09 GDP 0% Jan-10 Exports 2015 f Jul-08 Investment 2014 Jan-09 Consumption 2013 Jan-08 2012 Jul-07 2007-2011 Jan-07 0% Notes: In Panel A, f: forecast. Sources: National sources and Economist Intelligence Unit data. Going forward, there is still a large degree of uncertainty regarding the path of commodity prices, especially oil. Indeed, despite the fact that oil and metal futures suggest a slight increase in prices in the next few years, the uncertainty regarding these prices, captured by the implied volatility in future’s contracts (the VIX of these commodities), has been on the rise, especially for oil (Figure 1.11, Panel C). Uncertainty emerges from the demand side, associated with possible surprises in China’s growth, but also from the supply side, including the uncertainty regarding OPEC’s future actions and investment decisions in the oil sector in North America. In addition to uncertainty in commodity markets, growth in the G-7 may be jeopardized by Europe’s inability to resolve its deep-rooted structural and macroeconomic challenges and from a deterioration of Japan’s already anemic growth performance. All this casts doubts on the world’s new normal going forward and on the smoothness with which it will settle into the new equilibrium. Overall, the evidence suggests that China’s prolonged growth spurt of the past decade, and its indirect effect on commodity prices and demand for imports, were part of the transitional dynamics of a gigantic economy that woke up and became integrated into the world economy. Hence, the large waves stemming from China’s integration into the global economy are now fading away and the world economy is accommodating into this new equilibrium. While the medium-term prospects for the global economy appear more favorable than in 2014, they are still weaker than in the first decade of the 2000s. This is especially so for commodity exporting economies that will have to adjust to lower commodity prices and weaker demand for commodities from the large emerging economies. Hence, these global changes are likely to be permanent and, thus, the region cannot count on financing them away but will have to adjust to them. For commodity exporters, this means a lowering of demand to match the new level of permanent income. This “new normal” expected for future years presents challenges for LAC countries. For the commodity exporters, it puts a premium on policies that smooth out the transition to the new equilibrium while promoting endogenous productivity growth. The commodity importers may find 28 | LAC Treads a Narrow Path to Growth: The Economic Slowdown and its Macro Challenges some relief from terms-of-trade improvements and steady growth in the U.S. In the next chapter we expand on the challenges faced by LAC countries as they navigate through the new global context. FIGURE 1.11. Commodity Prices Outlook PANEL A. Oil Spot Price and Futures PANEL B. Copper Spot Price and Futures West Texas Intermediate (WTI) 100 285 280 90 275 270 US$ per Pound US$ per Barrel 80 70 60 265 260 255 250 50 245 40 Spot Price Future Jan-16 Future Jan-17 Future Jan-18 Spot Price Future Jan-16 15-Mar-15 28-Feb-15 13-Feb-15 29-Jan-15 Mar-15 Feb-15 Jan-15 Dec-14 Nov-14 Oct-14 Sep-14 240 Future Jan-17 PANEL C. Implied Volatility in Commodity Price Futures VIX 70 60 Volatility 50 40 30 20 10 Oil Cereals Jan-15 Nov-14 Jul-14 Sep-14 Mar-14 May-14 Jan-14 Nov-13 Jul-13 Sep-13 Mar-13 May-13 Jan-13 Nov-12 Jul-12 Sep-12 0 Copper Notes: The volatility of each commodity is proxied by the VIX index for that commodity. The VIX of a commodity measures the market's expectation of 30-day volatility in the price of the commodity by applying the VIX methodology to options spanning a wide range of strike prices Sources: LCRCE Staff calculations based on Bloomberg and the Chicago Board Options Exchange (CBOE). | 29 30 | LAC Treads a Narrow Path to Growth: The Economic Slowdown and its Macro Challenges Chapter 2: The Policy Response and its Challenges Introduction This chapter elaborates on topics related to LAC’s current juncture and policy options, which connect with four important messages. First, the impact on LAC of the ongoing deceleration and the policy response to the deceleration varies greatly, depending not only on how the deceleration affects particular countries (through both demand and terms of trade effects) but also on the policy instruments that are available to the country. The nature of the monetary and exchange rate regime (fix or floating) is of course a key differential factor. The chapter points out that the dollarized countries hit by large negative terms of trade shocks will have the hardest time of all. However, even the floaters face unusually difficult policy tensions because of the conflicting objectives of trying to keep inflation expectations safely anchored and cushioning the economy during the downturn. Second, the chapter emphasizes that the policy map contains two distinct dimensions that policy makers need to deal with simultaneously: (i) a low growth problem; as the deceleration (i.e., a shift towards a lower trend growth) is here to stay, LAC must face again the growth demons of its past; and (iii) a short-run macro transition problem of how to limit and balance the inflation and output costs during the transition to the new equilibrium real exchange rate associated with the new terms of trade (also here to stay). Policy makers need to find policies that adequately balance the short-term pains with the longer-term gains. Third, the policy response is very much conditioned by the policy maneuvering space, of which there is not much available at present in LAC. On the monetary side, all inflation-targeting central banks are now bumping against the ceiling of their inflation target bands as the steady currency depreciations are percolating into prices through rising pass-through effects. Nor is there much fiscal space. The space that had been built through fiscal consolidations before the crisis has been for the most part utilized to cushion the economic downturn associated with the 2008-2009 global crisis and the initial phases of the deceleration that started in 2011. As the increases in public spending were seldom reversed, the fiscal position of most countries has deteriorated to the point where there is not much space for further fiscal stimulus. Fourth, looking ahead, the expansion (or further strengthening) of policy space would seem to be a key priority for most countries in the region. While acknowledging the importance of improving the policy space through specifically targeted instruments (such as stabilization funds, automatic stabilizers and the like), the chapter follows a somewhat novel path in emphasizing the importance of a general saving mobilization. It argues that higher saving could make a positive difference not only to the region’s growth, but also to providing more breathing space for both monetary and fiscal policy, thereby boosting the region’s margin of maneuver to deal with shocks such as the one it has just experienced. Indeed, higher saving would help countries avoid becoming boxed into difficult macroeconomic predicaments with very little room to maneuver such as those faced at present by | 31 some countries. Saving mobilization includes fiscal strengthening but goes beyond it. While raising saving is not easy, it is not completely beyond the reach of policy. The Policy Dimensions and the Constraints The policy response to the ongoing deceleration should of course depend first of all on the nature of the shock, especially on whether it is transitory or permanent. Our take is that the shock LAC is dealing with is mostly, if not entirely, of the latter nature. Second, the policy response should also depend on how the deceleration is affecting any particular country. As noted in the previous chapter, the key dividing line in this respect is whether the country’s terms of trade have been affected positively or negatively. While the overlap is not perfect, countries exposed to negative terms of trade shocks are broadly referred to below as “net commodity exporters”, the ones exposed to moderately negative or positive terms of trade shocks as “net commodity importers”. Third, the policy response is also shaped by the instruments that the country has at its disposal, particularly as determined by its monetary and exchange rate regime. Countries with low exchange rate flexibility are those that are formally dollarized or highly (de facto) dollarized, as well as those with hard-peg regimes. The full-fledged inflation targeters stand at the other extreme, with high exchange rate flexibility. In between are countries with a wide variety of intermediate regimes (exchange rate bands, dirty floats, monetary targeters, etc…). LAC countries may thus be classified as shown in Table 2.1. Amongst the low exchange rate flexibility group (i.e., the “fixers”), Ecuador and Bolivia, as commodity exporters, are highly negatively affected by the terms of trade shock.30 Panama, El Salvador and the OECS countries are affected positively (or, if negatively, only moderately so). The full-fledged inflation targeters (the “floaters”) are all negatively affected, but Uruguay only moderately so. In the intermediate group, Central American countries and some Caribbean countries (Haiti, the Dominican Republic) are affected positively, Argentina, Paraguay, Trinidad and Tobago and Venezuela are affected negatively. TABLE 2.1. LAC: Country Typology by Commodity Trade and Exchange Rate Regime Exchange Rate Flexibility Terms of Trade Shock since 2011 Large Negative Shock Moderate Negative Shock Positive Shock Low Belize, Ecuador, and Bolivia El Salvador, Guyana, and Panama OECS Countries Intermediate Argentina, Guatemala, Jamaica, Paraguay, Trinidad & Tobago and Venezuela Honduras and Nicaragua Costa Rica, Dominican Republic, and, Haiti High Brazil, Chile, Colombia, Mexico, and Peru Uruguay Notes: Exchange regimes flexibility is low for fully or very highly dollarized economies, hard peggers and countries with high levesl of exchange rate intervention; intermediate for soft peggers, countries with crawling pegs, and countries with recent inflation targeting (IT) regimes; and high for countries with full-fledged IT regimes and countries with monetary aggregate targets. A large negative terms of trade shock corresponds to a decline of more than ten percent between January 2011 and March 2015. A moderate negative terms of trade shock corresponds to a decline of less than ten percent over the same period. Finally, a positive terms of trade shock corresponds to an increase in such variable. See Appendix 1 for a description of commodity balances in LAC. Sources: LCRCE Staff elaboration. Although Bolivia is not formally dollarized and dollarization has declined significantly over the last decade, it arguably still faces rather similar constraints in view of the country’s limited historical flexibility of its exchange rate against the US dollar. 30 32 | LAC Treads a Narrow Path to Growth: The Economic Slowdown and its Macro Challenges Using this typology, the full range of policy issues faced by the region and the available policy responses can now be surveyed. The starting point is to recognize that all of these LAC country groupings are confronted, albeit in different ways and to different degrees, with the same three types of policy problems: a growth problem, a real exchange rate realignment problem, and a macro stabilization transition problem. Consider each one of them in turn. The growth problem. After seven years of high growth (the “boom” years), LAC’s average growth rate during the last four years (the “deceleration”) was back to nearly exactly what it was during the late 90’s-early 2000’s (the years of “stabilization”) (Figure 2.1). The fourth column in Figure 2.1 is a growth projection based on a streamlined “winds” model (WIM) presented in Chapter one with only two explanatory factors, China’s and the G7’s growth rates (i.e., it amounts to viewing the other two explanatory factors, commodity prices and the interest rate, as endogenous to the world’s growth).31 The projection assumes the following: The coefficients of the estimated WIM remain unchanged, which amounts to assuming that the region inherent growth potential (i.e., for a given state of the world) remains unchanged. China’s growth rate is the average expected by the World Economic Outlook (WEO) for the period 2015-2019. The projection takes this rate of growth of around 7 percent as firm because, as discussed in Chapter 1, China appears to have now settled around a more sustainable growth rate with its consumption, investment and exports all aligning around that path. The G-7’s growth rate is also the average expected by the WEO. However, again as discussed in Chapter 1, there is considerable uncertainty about this projection, with events in Europe still casting a substantial shadow on the future. Hence, a projection band is derived from the most pessimistic and optimistic growth forecasts. Based on these assumptions, LAC’s projected growth is only marginally higher than its average growth during the stabilization (1995-2002) or deceleration (2012-2015) periods. This supports the view that, unless offset by growth-boosting policies, the deceleration is here to stay. It also strongly suggests that LAC’s underlying growth rate (the mean) is very much domestically determined, while the fluctuations (the variance) around that base rate are very much externally determined, i.e., determined by world events. The exchange rate realignment problem. The changes in the terms of trade require the equilibrium real exchange rate to adjust, thereby giving rise to a relative price-induced reallocation problem. To visualize its macroeconomic impact, consider the simple Swan-Salter diagram of Figure 2.2, where e stands for the real exchange rate and Y for aggregate demand (or absorption). Along the internal balance (IB) schedule, aggregate demand is compatible with non-inflationary full employment. The IB is downward sloping because a reduction in absorption is required to avoid overheating when the real Reducing the underlying factors of the WIM l to China and G7 demand amounts to endogenizing the other two (commodities prices and interest rates). As discussed in Chapter one, the close correlation between the commodities price cycle and world output growth suggests that causality is mostly demand rather than supply-induced: it flows mainly from quantities to prices (higher world economic growth leading to higher commodities prices), rather than the other way around (higher commodities prices leading to lower world output growth). This therefore broadly supports projecting LAC’s growth based on a streamlined model where commodities play no independent role. Yet, supply-side effects might also impress some downward tilt on the growth projection. In particular, commodity prices might be pushed up as a result of the possible leveling off in oil extraction in the US once some of the current excess capacity at current oil prices wears off in the fracking industry. 31 | 33 exchange rate depreciates—i.e., a reduction in aggregate domestic demand is needed to offset the increase in demand for home (non-tradable) goods resulting from a real exchange rate depreciation. Along the external balance schedule (EB) the current account is in a sustainable equilibrium. The EB is upwards sloping because an increase in absorption tends to widen the current account deficit; hence a real exchange rate depreciation is needed to restore external equilibrium. A decline in the price of commodities creates a terms of trade shock that results in an upward shift of the EB schedule for the commodity exporters, a downward shift for the commodity importers. To the extent that this shift reflects a permanent shock, the initial location of the macro economy at point E becomes out of equilibrium and adjustment to a new, sustainable equilibrium becomes unavoidable. FIGURE 2.1. LAC’s Low Growth Problem: Actual and Projected Average yearly Growth by Period 5% 4% 3% 2% 1% 0% 1995-2002 2003-2010 excl. 2009 2012-2015 2015-2019 Notes: Averages are taken over a set of fifteen LAC countries with available quarterly data, namely: Argentina, Brazil, Bolivia, Chile, Colombia, Costa Rica, Dominican Republic, Ecuador, El Salvador, Guatemala, Jamaica, Mexico, Paraguay, Peru, and Uruguay. 2015-2019 growth is calculated using the estimated coefficients of a modified version of the Wind Index Model which regresses GDP growth on G-7 growth and China’s growth. The mean expected growth (the height of the bar) is computed by assuming that China’s growth stands at 7 percent over the period and that the G-7 grows at 1.8 percent per year. The diamonds represent the predicted values using a growth rate for China of 7 percent and an optimistic and pesimistic growth rate for thee G-7 of 2.3 percent and 1.3 percent, respectively. Sources: LCRCE Staff claculations based on Consensus Forecasts, World Bank Group 2015, and national sources. The transition problem. Figure 2.2 is also helpful to discuss the different transition problems faced by the different country groupings. The terms of trade shock gives rise to four possible equilibria, depending on the monetary and exchange rate regime of the country. Commodity importers have it relatively easy as they need to move towards a more appreciated equilibrium real exchange rate. The commodity importers with low or no nominal exchange rate flexibility move initially from E to E** and eventually, via inflation in non-tradable goods prices, to E”. By contrast, commodity importers with greater nominal exchange rate flexibility move more directly from E to E”. In both cases, policy makers need to watch for possible overheating pressures leading to inflation, as the gains in the terms of trade will give rise to expansionary income and wealth effects. This is clearly more of a problem for the fixers (e.g., Panama, El Salvador), because in their case the real exchange rate appreciation will occur through price increases rather than nominal appreciations. But there is not much these policy makers can really do about it, other than not adding unnecessarily to price and wage rigidities. Commodity exporters in contrast need to adjust to a more depreciated equilibrium real exchange rate. The commodity exporters with low nominal exchange rate flexibility will have it particularly hard. Those that have accumulated large international reserves (e.g., Bolivia) have the option of smoothing the shock by remaining temporarily at E and covering the external imbalance through reserve 34 | LAC Treads a Narrow Path to Growth: The Economic Slowdown and its Macro Challenges deccumulation. Given that the shock is assumed to be permanent, however, the low-exchange-rateflexibility commodity exporters would need eventually to move to E’, which would, unfortunately, likely entail a painful transition phase of economic contraction and unemployment to force prices and wages to adjust downward (relative to the prices of tradable goods), so that the real exchange rate can reach its new, more depreciated equilibrium at E’.32 FIGURE 2.2. LAC’s Macro-Policy Map: A Swan-Salter Perspective EB' EB E' E* E E** e Real Exchange Rate EB'' E'' IB Agregate Demand Y Source: LCRCE Staff elaboration. By contrast, the commodity exporters that are full-fledged inflation targeters can rely on their high degree of nominal exchange rate flexibility to transition more directly to E’ via nominal depreciation and, hence, with lower adjustment costs in terms of output and employment compared to the fixers. While the nominal depreciation will push the economy from E toward E’, through further investment contractions as well as a build-up of negative income and wealth effects on consumption, the decline in the terms of trade is likely to depress aggregate demand, putting contractionary pressures on output. The nominal exchange rate depreciation will restore external balance while dampening these contractionary pressures by shifting demand towards home (non-tradable) goods, discouraging imports, and boosting exports.33 The floaters will therefore have an easier time than the fixers among the commodity exporters. Yet, for reasons explained next, even for the floaters the transition from E to E’ may not be a smooth and easy one. The transition problem for the commodity exporters that have a high degree of exchange rate flexibility arises from two sources. On the one hand, the strong depreciations of the nominal exchange rates can generate inflationary pressures and unhinge inflation expectations. On the other hand, the declines in the terms of trade can depress economic activity. On the investment side, this reflects the fall in expected returns on capital in the primary sector and the second round effects from the growth slowdown. On the consumption side, it reflects income and wealth losses. The policy choices faced To mitigate the extent of economic contraction and unemployment, these countries could introduce heterodox measures, such as import taxes cum export subsidies (i.e., a fiscal-based real exchange depreciation) and exchange controls (i.e., the rationing of foreign exchange to make payments abroad). These measures might help speed up the move from E* to E’ while attenuating the contraction and its associated adjustment costs. However, given their distortionary impact and decaying effectiveness over time, such measures have important problems of their own. 32 Of course, the smoothness of the transition will generally depend on the state of world demand and on how responsive a country’s supply of tradables to the improvement in external competitiveness. 33 | 35 by the inflation targeting central banks will therefore be conditioned by their inflation and gaps relative to GDP trend. In the absence of inflationary pressures, central banks in countries with widening gaps relative to GDP trend could consider relaxing monetary policy as a way to limit the decline in economic activity. Yet, this option may not be available if they also need to control inflation. The Monetary Space This section focuses on the Latin America countries that have a significant degree of exchange rate flexibility, particularly the full-fledged inflation targeters (Brazil, Chile, Colombia, Mexico, Peru and Uruguay). The key question if whether, beyond exchange rate flexibility, these countries have space for monetary policy maneuvering (i.e., whether they have room to use the interest rate as a policy tool to stimulate domestic economic activity). The bottom line is that, in view of the build-up of inflationary pressures, there appears indeed to be limited room for using monetary policy to smooth the transition, even among countries with consolidated inflation targeting (IT) regimes. Moreover, the emerging conflict between using the interest rate for output vs. inflation stabilization (“lack of divine coincidence” in the IT jargon) is likely to become an important test of wills for LAC’s IT central banks, probably a big first in their life as formal ITers. As discussed in Chapter 1, the region’s nominal exchange rates have depreciated steadily since the price of commodities peaked in early 2011 and the rate of depreciation has accelerated since mid-2014, when the price of oil started to decline. Indeed, setting aside Argentina and Brazil (two countries with higher nominal depreciations because of their higher inflation rates), the nominal depreciations have been broadly proportional to the decline in the terms of trade (Figure 2.3). The additional factor driving all the region’s exchange rates downward has been of course the rise of the dollar against the rest of the world’s currencies. Adding the terms of trade effect to the rise of the dollar can therefore explain most of the region’s nominal depreciations. FIGURE 2.3. LAC: Terms-of-Trade and Nominal Exchange Rates Notes: The changes are the percentage changes between February 2015 and January 2011. Sources: World Bank’s GEM and Bloomberg. As the depreciations have accelerated, inflation has picked at an increasing pace, reflecting rising passthroughs, as measured by a simple rolling correlation between inflation and the rate of depreciation (Figure 2.4). Such rise in the pass-throughs probably reflects the persistency of the depreciations, which likely feeds the perception of a permanent shift, instead of purely random exchange rate fluctuations, as had been the case in LAC in the post-stabilization (2003-2008) and recovery (201036 | LAC Treads a Narrow Path to Growth: The Economic Slowdown and its Macro Challenges 2011) periods. Thus, price setters in the tradable good sector are now likely to pass on a currency depreciation to prices more rapidly than in the past. In a stable inflation environment, the passthroughs should decline again toward the low levels observed in recent years once the exchange rate realignment has concluded its course. But this will require, of course, that inflationary expectations remain well-anchored. FIGURE 2.4. Moving-Average Correlation of Depreciation and Inflation Rates for an Average of Full-Fledged Inflation Targeting Countries in LAC Correlation Inflation and Depreciation 0.6 0.4 Correlation Coefficient 0.2 0 -0.2 -0.4 -0.6 Dec-14 Apr-14 Aug-14 Dec-13 Apr-13 Aug-13 Dec-12 Apr-12 Aug-12 Dec-11 Apr-11 Aug-11 Dec-10 Apr-10 Aug-10 Dec-09 Apr-09 Aug-09 Dec-08 Apr-08 Aug-08 Dec-07 -0.8 Notes: The correlation coefficient at each point in time (month t) is calculated as the correlation between the YoY inflation rates in the interval (t-24, t) and the YoY depreciation rates in the interval (t-36, t-12). The 12 month lag takes into account the possibility that the exchange rate pass-through takes place with some lags. Sources: Bloomberg and national sources. The fact is, however, that the inflationary build up has brought inflation at or above its target in all LAC IT central banks (Figure 2.5, Panel A). Thus, the region as a whole faces very different conditions from those faced by other emerging economy central banks. Most noticeably, inflation relative to the target band in LAC has followed a symmetrically opposite path to that in the middleincome countries of the Eastern Europe and Central Asia (ECA) region (Figure 2.5, Panel B and C). Unless the rise in inflation feeds onto the rest of the economy through wage and non-tradables price increases and, as a result, inflation expectations become unanchored, the exchange rate depreciation should lead to a strictly one-time rise in the price level. In this case, there should be no need for central banks to intervene by tightening monetary policy. However, the risk of second-round price effects motivated by the desire to avoid permanent declines in wages or relative prices may be substantial enough to require central bank intervention. This is all the more so if economic agents realize that the price increase is permanent (as seems to be the case based on the rise in the measured pass-through mentioned earlier) and the economy is close to full-employment. Thus, the hard-won increases in credibility obtained by all LAC IT central banks during the last 15 years may not suffice to anchor expectations in circumstances of systematic currency depreciation unless reinforced through a monetary tightening. The large increase in dollar borrowing by firms during the recovery period, already noted in Chapter one, provides further reasons for a tightening of monetary policy. Monetary tightening would limit the extent of exchange rate depreciation, and hence would limit the adverse effects of the depreciation on the balance sheet of debtors with dollar-denominated debts but local currency-denominated | 37 incomes. These adverse balance sheet effects could otherwise exert an additional negative spillover effect on the economy by threatening firms’ liquidity and undermining their investment capacity. If any event, the current circumstances will arguably confront the LAC IT central banks as a group with their first major externally-induced test of lack of divine coincidence, that is, with a situation where the output stabilization objective conflicts head on with the inflation stabilization objective. This can be appreciated in Figure 2.6, which shows the gaps relative to GDP trend, inflation rates, and interest rates for the average of the five main LAC IT countries, all expressed as differences with respect to the US. As can be seen in that figure, the data for 2014 show a clearly rising trend for LAC inflation (relative to inflation in the US) contrasting with a steep decline for de-trended relative output growth, reflecting the mounting disparity between the current US and LAC cycles. FIGURE 2.5. Inflation and Inflation Targets for a Selected Group of Countries with Inflation Targeting Regimes PANEL A. Difference between Inflation and Inflation Target in Selected LAC Countries Annual Inflation minus Inflation Target 2.5 2 in percentage points 1.5 1 0.5 0 -0.5 Brazil Chile Colombia 2010 Mexico Peru 2014 PANEL B. Actual and Targeted Inflation for PANEL C. Actual and Targeted Inflation in LAC Full-Fledged Inflation Targeters ECA Full-Fledged Inflation Targeters 8% 7% 7% 6% 6% 5% 5% 4% 4% 3% 3% 2% 2% 1% 1% 0% 0% -1% 2005 2006 2007 2008 2009 Targeted Band 2010 2011 2012 Inflation 2013 2014 2005 2006 2007 2008 2009 Targeted Band 2010 2011 2012 2013 2014 Inflation Notes: Inflation is end-of-year inflation. In Panels B and C, inflation and the bands are calculated as simple averages across countries. Full-fledged ITs in LAC are Brazil, Chile, Colombia, Mexico and Peru. Full-fledged ITs in ECA include Czech Republic, Hungary, Poland, and Romania. Sources: National sources and IMF’s WEO. 38 | LAC Treads a Narrow Path to Growth: The Economic Slowdown and its Macro Challenges FIGURE 2.6. Inflation, Policy Rates, and Output: Average Differentials between LAC FullFledged Inflation Targeting Countries and the US, 2000-2014 Catching up Falling behind Falling behind Catching up 10 in percentage points 2014q2 2013q3 2012q4 2012q1 2011q2 2010q3 2009q4 2009q1 -2 2008q2 -0.3 2007q3 0 2006q4 -0.2 2006q1 2 2005q2 -0.1 2004q3 4 2003q4 0.0 2003q1 6 2002q2 0.1 2001q3 8 2000q4 0.2 2000q1 in percentage points 0.3 Difference in Gap relative to GDP Trend: LAC average minus US. Difference in Interest Rate: LAC average minus US (rhs) Difference in Inflation Rate: LAC average minus US (rhs) Notes: Gaps relative to trend are calculated using a Hodrick-Prescott filter. LAC average is the simple average among full-fledged inflation targeters, namely, Brazil, Chile, Colombia, Mexico, and Peru. The difference in interest rates is the difference in monetary policy rates between LAC full-fledged ITers and the U.S. Sources: LCRCE Staff calculations based on Bloomberg and national sources. While LAC central banks raised interest rates relative to the US on several occasions in the recent past to tame inflationary pressures, notably in 2007-2008, before the global crisis, and in 2010, during the post-crisis recovery, these were also times of booming economic activity, hence of divine coincidence obtained. Thus, while LAC’s IT central banks behaved independently in several occasions in the recent past (i.e., deviated from the US monetary policy stance), they did so when they were not exposed to a policy conflict between the objective of stabilizing inflation vs. the objective of stabilizing actual relative to potential output. Raising the interest rate was the clear, unequivocal thing to do in the past episodes. This time around, they will need both to deviate from the US monetary policy stance and face lack of divine coincidence in doing so. In other words, the IT central banks will need to make hard choices between controlling inflation at the expense of worsening the downturn, on the one hand, or cushioning the downturn at the risk of losing control of inflation, on the other. This will arguably be their hardest experience in monetary counter-cyclicality thus far. Indeed, as shown in Box 2.1, except for Chile, other IT central banks only seem to have actively engaged in counter-cyclical activity when in sync with the US. Box 2.B.1: When have LAC central banks been countercyclical? Reflecting much improved macroeconomic management and increased trade and financial integration with a global world, LAC’s main inflation targeting countries have experienced during the post-stabilization period economic cycles that were, as a group, closely aligned with the US (Figure 2.B.1, Panel A). At the same time, reflecting open and well-integrated capital markets, their policy rates have also closely tracked those of the US (Figure 2.B.1, Panel B). In this closely coupled environment, much, if not all, of the countercyclical monetary management can be done automatically, just by following the Fed’s lead in setting policy rates. Doing so does not stress monetary policy because by maintaining interest rate parity at all times it avoids putting pressure on the foreign exchange market and the nominal exchange rate. Indeed, as long as they just follow the Fed, the floating central banks emulate the behavior of the fixers and free ride on | 39 the dollar. Instead, deviating from (risk-adjusted) uncovered interest rate parity (i.e., behaving as an independent central bank) will induce exchange rate fluctuations and trigger capital flows. It is thus an action that central banks should naturally tend to resist unless there are sufficiently strong reasons to behave otherwise. Behaving counter-cyclically is of course even less attractive when it needs to be done in a context of lack of divine coincidence, because it puts the output objective in direct collision with the inflation objective, which is the mandated objective of most inflation targeting central banks. FIGURE 2.B.1. Nominal Interest Rates and Economic Activity in LAC’s Full-Fledged Inflation Targeting Countries and the U.S., 2000-2014 PANEL A. Average of Nominal Interest PANEL B. Economic Cycles in LAC and the Rates in LAC and IRP-based Rate in the U.S. U.S. 0.4 12% 0.3 10% 0.2 8% 0.1 Nominal Interest Rate LAC Federal Funds Rate plus Inflation Differential LAC-USA Gap relative to GDP Trend - LAC average 2014q2 2013q3 2012q4 2012q1 2011q2 2010q3 2009q4 2009q1 2008q2 2007q3 2006q4 2006q1 2005q2 2004q3 2003q4 2003q1 2014q2 2013q3 2012q4 2012q1 2011q2 2010q3 2009q4 2009q1 2008q2 2007q3 2006q4 2006q1 2005q2 2004q3 2003q4 -0.4 2003q1 -2% 2002q2 -0.3 2001q3 0% 2000q4 -0.2 2000q1 2% 2002q2 -0.1 2001q3 4% 0.0 2000q4 6% 2000q1 in percentage points 14% Gap relative to GDP Trend - US Notes: Gaps relative to trend are calculated using a Hodrick-Prescott filter. LAC average is the simple average of full-fledged inflation targeters, namely, Brazil, Chile, Colombia, Mexico, and Peru. Interest rates stands for monetary policy rates. The interest rate parity (IRP) rate is the policy rate in the U.S. minus the inflation differential between the U.S. and the average LAC IT countries. Sources: LCRCE Staff calculations based on Bloomberg and national sources. A simple way to test the extent of LAC central banks’ independence, hence commitment to follow their own counter-cyclical monetary policy, is to estimate a Taylor rule through a two-step procedure. In the first step, the country’s output gap is regressed against the US output gap; in the second step, the residual of this regression is substituted for the output gap in the Taylor rule estimation. In this way, the residual only contains output gap fluctuations that are strictly idiosyncratic (do not mirror the US output gap fluctuations). Amongst LAC’s main IT central banks, only Chile’s appears to have taken a strong countercyclical stance, as the coefficient of the output gap remains strongly significant even after having been regressed against the US output gap (Table 2.B.1). While the coefficient remains marginally significant in the case of Peru, it totally loses significance in the case of Colombia and Mexico. As shown in Figure 2.B.2, however, this seems to have been more a case of lack of need than lack of will. The Mexican and Colombian cycles appear indeed to be much more synchronized with the US than that of Peru. 40 | LAC Treads a Narrow Path to Growth: The Economic Slowdown and its Macro Challenges TABLE 2.B.1. Taylor Rules in Selected Full-Fledged Inflation Targeters in LAC Chile (1) (2) 0.405*** Output Gap (0.0681) Residual Output Gap Inflation minus Inflation Target Lagged Interest Rate (0.0707) (0.0654) Peru (7) (8) 0.271*** (0.0603) 0.324** -0.0373 -0.0331 0.156* (0.124) (0.0976) (0.130) (0.0809) 0.187** 0.243*** (0.0703) (0.0891) 0.492*** 0.569*** (0.0908) Constant Period: 2003Q1 - 2014Q4 Dependent Variable: Nominal Interest Rate Colombia Mexico (3) (4) (5) (6) 0.216*** 0.171** (0.113) 1.987*** 1.690*** 0.312*** 0.405*** (0.0949) (0.103) 0.758*** 0.776*** (0.0555) (0.0610) 1.287*** 1.153*** 0.207 0.0443 0.0109 0.0639 (0.176) (0.177) (0.0710) (0.0885) 0.830*** 0.875*** (0.0704) (0.0735) 0.645 0.563 0.712*** 0.751*** (0.0754) (0.0877) 1.083*** 0.906*** (0.367) (0.459) (0.317) (0.347) (0.409) (0.440) (0.268) (0.308) 46 0.863 46 0.782 46 0.943 46 0.931 47 0.816 47 0.787 47 0.848 47 0.794 Observations R-squared Notes: Standard errors reported in parenthesis. The output gap is calculated using a Hodrick-Prescott filter. The residual of the output gap is calculated as the residual of the regression of the output gap in country i against the output gap in the U.S. Sources: LCRCE Staff calculations based on Bloomberg and national sources. FIGURE 2.B.2 Correlation Coefficients between Gaps relative to trend GDP in Selected LAC Inflation Targeters and the U.S. 2003q1-2014q4 1.0 0.9 0.8 correlation index 0.7 0.6 0.5 0.4 0.3 0.2 0.1 0.0 Mexico Chile Colombia Peru Notes: Gaps relative to trend are calculated using a Hodrick-Prescott filter. Sources: LCRCE Staff calculations based on national sources. LAC’s Narrowing Fiscal Space There does not appear to be much maneuvering room in LAC to ease the transition on the fiscal side, either. Following the fiscal consolidation efforts of the 90s, the region had ample fiscal space prior to the global crisis, with an overall fiscal balance in equilibrium (Figure 2.7, Panel A). In addition, public sector debt was not only low, but its dollar component had also been noticeably reduced and most LAC countries had accumulated substantial international reserves cushions, at least part of which backed assets held by public treasuries at central banks. As a result, fiscal sustainability indices looked good, even more so of course in the high growth environment of the boom (Figure 2.7, Panel B). | 41 FIGURE 2.7. Fiscal Balance and Sustainability in LAC PANEL A. Fiscal Balances in LAC by PANEL B. Fiscal Sustainability in LAC- Period 2006-2008 Simple Average for LAC countries Average between 2006 and 2008 Revenue 0.3 Expenditure 9 Fiscal Balance (rhs) 10% 8 8% 7 0.2 6% 2% 0% -2% 3 2 -4% 1 -6% Panama Peru Trin. & Tob. Costa Rica Jamaica Argentina Brazil -10% 1996-1999 2000-2002 2003-2005 2006-2008 2009-2010 2011-2012 2013-2014 Ecuador Guatemala -0.3 Colombia 0 -8% Mexico -0.2 4 Dom. Rep. -0.1 5 Venezuela 0 in percentage points as a share of GDP as a share of GDP 6 4% 0.1 PANEL C. Fiscal Balances in Selected LAC countries – the Aftemath of the 2008 Crisis Central Government Revenue 50% Central Government Expenditure Overall Fiscal Balance (rhs) 20% 40% 15% 30% 10% 5% 10% 0% 0% -10% -5% as a share of GDP as a share of GDP 20% -20% -10% -30% -15% 2006-2008 2009-2010 2011-2012 2013-2014 2006-2008 2009-2010 2011-2012 2013-2014 2006-2008 2009-2010 2011-2012 2013-2014 2006-2008 2009-2010 2011-2012 2013-2014 2006-2008 2009-2010 2011-2012 2013-2014 2006-2008 2009-2010 2011-2012 2013-2014 2006-2008 2009-2010 2011-2012 2013-2014 2006-2008 2009-2010 2011-2012 2013-2014 2006-2008 2009-2010 2011-2012 2013-2014 2006-2008 2009-2010 2011-2012 2013-2014 2006-2008 2009-2010 2011-2012 2013-2014 2006-2008 2009-2010 2011-2012 2013-2014 2006-2008 2009-2010 2011-2012 2013-2014 -50% 2006-2008 2009-2010 2011-2012 2013-2014 -40% Ecuador Brazil Venezuela Bolivia Argentina Uruguay Honduras Colombia Mexico Haiti Chile Nicaragua Peru Dom. Rep. -20% PANEL D. Fiscal Balances in Selected Regions – the Aftemath of the 2008 Crisis 60% 20% 15% 40% 5% 0% 0% -5% -20% in percent of GDP in percent of GDP 10% 20% -10% -40% -15% LAC PCE G-7 SEA MICs 2013-2014 2011-2012 2009-2010 2006-2008 2013-2014 2011-2012 2009-2010 2006-2008 2013-2014 2011-2012 2009-2010 2006-2008 2013-2014 2011-2012 2009-2010 2006-2008 2013-2014 2011-2012 2009-2010 -20% 2006-2008 -60% ECA MICs Central Government Revenue Central Government Expenditure Overall Fiscal Balance (rhs) Primary Fiscal Balance Notes: In Panel A and C, LAC includes all South and Central American countries plus the Dominican Republic, Jamaica, Mexico, and Trinidad and Tobago. In Panel B, fiscal sustainability is calculated as described in Appendix 2. Sources: LCRCE staff calculations based on data from Bloomberg, IDB’s Macro Monitor and IMF’s WEO. 42 | LAC Treads a Narrow Path to Growth: The Economic Slowdown and its Macro Challenges The ample fiscal space at the time of the 2008-2009 global crisis enabled LAC countries to engage in vigorous countercyclical fiscal responses through large increases in public expenditures. As a result most LAC countries experienced an important deterioration of their fiscal accounts during the period 2009-2010 (Figure 2.7, Panel C). While the fiscal stimulus played its role in accelerating LAC’s recovery, the resulting deterioration of the fiscal balance was not reversed during the 2010-2011 recovery period, with the exception of a few countries (Chile, Peru). This contrasted sharply with the fiscal stances followed in other regions of the world (Figure 2.7, Panel D). Thereafter, during the post-2011 growth deceleration, the fiscal balances deteriorated further in nearly all LAC countries. As a result, the fiscal space largely evaporated. Fiscal sustainability has worsened in most countries, quite substantially in some cases (Venezuela, Argentina, Ecuador, Brazil, and Costa Rica) (Figure 2.8). The fiscal deteriorations not only limits the scope for further counter-cyclical fiscal stimulus, it also may reduce the size of the fiscal multipliers (see the January 2015 Global Economic Prospects). In addition, in view of the decline in commodity prices, the fiscal revenue projections throughout the region have been severely affected. Thus, except for the few countries with sizable stabilization funds (e.g., Chile), countries with conservative budgetary rules based on low commodity prices, or the countries that have hedged their commodity revenues through derivatives (e.g., Mexico), the current fiscal space tightly restrains countries’ capacity to engage in countercyclical public spending. FIGURE 2.8. Fiscal Sustainability in LAC: Now and Then Notes: For details on the methodology used to construct sutainability indexes see Appendix 2. Source: LCRCE Staff calculations based on data from Bloomberg, IDB’s Macro Monitor and IMF’s WEO. The above raises two obvious questions. First, why was it the case that the fiscal stimulus ended up being permanent rather than transitory? Second, why did countries engage in further spending at a time when they had already used a big chunk of their fiscal space? The data suggests that the basic shortcoming of the countercyclical programs was that the permanent nature of the deceleration was not factored in (Figure 2.9). While a first round of fiscal stimulus during the global crisis worked well and was largely unwound by mid-2010 (at least in terms of rates of growth), the second round that took place by end-2012 in response to the newly declining economic activity was not only ineffective but also resulted in a large worsening of the fiscal balance due to the permanent nature of the decline in output growth, and therefore in revenue. Clearly, the scope for engaging in countercyclical public spending should be a function of whether a downturn is transitory or permanent. Thus, the main | 43 reason for the exhaustion of the available fiscal space appears to be some misreading of the depth and permanence of the deceleration and its impact on public revenue.34 A possible additional reason explaining the spending inertia is the heavy bias of the increase in public expenditure during 2007-2014 towards operating expenditures and social transfers. Only a few governments spent more on investment than on consumption (Figure 2.10). The inability of most LAC countries to ensure that the post-crisis increase in spending was of a strictly transitory nature and as growth-oriented as possible could have reflected a “small government” syndrome. Indeed the region’s public expenditure, controlled by the region’s level of economic development and a number of structural characteristics (such as country size, demographics and natural resources abundance), is a low public spending region (Figure 2.11, Panel A). In turn, this is mostly the reflection of being a low revenue mobilization region, again after controlling for the same variety of factors (Figure 2.11, Panel B). FIGURE 2.9. Avearge Growth of GDP, Government Expenditure and Revenue in LAC YoY Growth 20% 15% 10% 5% 0% -5% -10% 2007 GDP 2008 2009 2010 Government Expenditure 2011 2012 2013 2014 Government Revenue Notes: Average growth rates in LAC are calculated as the simple average of growth rates in Argentina, Brazil, Chile, Colombia, Mexico, Peru, and Uruguay. Sources: IMF’s IFS and national sources. A seemingly reasonable hypothesis would thus be that the small governments have generated over the years a large amount of repressed spending in public services and social transfers. Thus, when the opportunity arose to spend more, the flood gates broke loose and spending was channeled to satisfy at least part of the unfulfilled consumption-oriented expenditure demands. Should this be the case, one would expect this problem to affect the smaller government countries in LAC more than the larger governments. But the evidence points in the opposite direction: bigger governments (measured on the basis of the size of their initial total public spending as a share of GDP) tended to spend more than the small governments (Figure 2.11, Panel C). That the largest spenders tended also spent more at the margin points, therefore, towards a “big government” syndrome, plagued by budgetary rigidities or ingrown structural spending biases, rather than a “small government” syndrome. The deceleration translated in the short run in falling rates of growth of revenue rather than declining levels. Thus, the fiscal accounts became unbalanced because expenditures continued to grow while revenues stagnated. 34 44 | LAC Treads a Narrow Path to Growth: The Economic Slowdown and its Macro Challenges FIGURE 2.10. Change in Public Investment and Other Public Spending in LAC, 2007-2014 change between 2014 and 2007 12 10 Public Investment in percentage points of GDP 8 6 PAN 4 MEX PER 2 BOL COL BRA SLV BLZ CHL PRY URY BHS SUR DOM NIC GTM TTO GUY HND 0 -2 CRI ARG VEN -4 -4 -2 0 2 4 6 Other Public Spending in percentage points of GDP 8 10 12 Sources: National Sources and IDB (2015). The Saving Space This section argues that there is link between the constrained space for monetary and fiscal policy maneuver in which LAC countries (even the full-fledge IT countries) find themselves currently caught in, on the one hand, and the traditionally low saving rates in the region. It argues that saving matters not just for longer-term growth but also for macroeconomic stabilization capacity. Being a low growth region, one would naturally expect LAC to be also a low saving region, with causality running in either direction. While low saving may cause low growth because it limits capital accumulation, low growth may also limit saving to the extent that saving responds endogenously to growth. However, even after controlling for the endogeneity of saving with respect to growth and a number of structural country characteristics, LAC remains a low saving region relative to international benchmark (Box 2.B.2 and Figure 2.12, Panel A). While there is substantial heterogeneity within LAC, the under-savers tend to dominate the over-savers (Figure 2.12, Panel B). In an idealized world of perfect substitution between domestic and foreign saving, low domestic saving would ultimately matter for a country’s wealth but not for its growth rate. A low saving country would grow equally as fast as a high saving country, the only difference being who (the country residents or the foreigners) reaps the benefits. This does not seem to be the real world we live in, however. Saving appears to matter for growth through two channels, competitiveness and sustainability. Low saving appreciates the equilibrium real exchange rate, which undermines external competitiveness, thereby slowing down growth (Box 2.B.3). At the same time, low saving worsens the balance of payments, which can undermine the sustainability of the country’s growth, thereby raising the cost of capital through the country’s sovereign premium and possible growth-damaging balance of payments crises. In countries affected by sustainability dynamics, low saving should therefore lead to more depreciated real exchange rates reflecting expectations of possible defaults. | 45 FIGURE 2.11. The Size of Governments in LAC PANEL A. Benchmarking Government PANEL B. Benchmarking Government Expenditure around the World 6 simple average by region 15 4 Observed Value minus Predicted Value in percentage points of GDP Observed Value minus Predicted Value in percentage points of GDP Revenue around the World simple average by region 2 0 -2 -4 -6 10 5 0 -5 -10 -15 G-7+Western Europe 1996-1998 ECA MICs 1999-2001 ESEA MICs 2002-2004 China 2005-2007 LAC 2008-2010 G-7+Western Europe 2011-2013 1996-1998 ECA MICs 1999-2001 ESEA MICs 2002-2004 2005-2007 China 2008-2010 LAC 2011-2013 PANEL C. Initial Government Size and the 2008 Fiscal Stimulus 16 14 ARG 2014 minus 2008 in percentage points 12 10 VEN ECU 8 HTI 6 PRY 4 BHS CRI SLV NIC CHL PER 2 0 -2 10% URY BOL BRA COL PAN HND MEX TTO DOM 15% 20% 25% 2008 as a share of GDP 30% 35% 40% Notes: In Panel A the country’s governement expenditure gap is calculated as the residual from a regression of governement expenditure as share of GDP against governement revenue as a share of GDP, log of GDP per capita, log of poulation, the growth rate of GDP per capita, and an index of governance. In Panel B, the country’s revenue gap is calculated as the residual from a regression of governement revenue as share of GDP against log of GDP per capita, log of poulation, the growth rate of GDP per capita, terms-of-trade growth, fuel exports as a share of GDP, and an index of governance. Sources: LCRCE staff calculations based on IMF’s WEO. Thus, lower saving countries (with negative saving gaps relative to benchmark) that are primarily affected by the competitiveness channel should grow slower and have less competitive (more appreciated) real exchange rates. Instead, lower saving countries under the grip of the sustainability channel should grow slower with more depreciated real exchange rates. The empirical evidence based on a world-wide sample of countries, as synthesized in Figure 2.13, appears to broadly support this construct. The negative correlation between the saving and real exchange rate gaps is consistent with the competitiveness channel: countries that are undervalued grow faster (as measured by the median growth rate of all observation points in the second quadrant of the chart); those that are overvalued grow slower (the fourth quadrant of the chart). At the same time, countries in the other two quadrants (lower-left and upper-right) of the chart fit the patterns associated with the sustainability channel: countries that under-save have, on average, sovereign ratings below benchmark and grow slow despite having undervalued real exchange rates; those that over-save are over-rated, overvalued, and grow 46 | LAC Treads a Narrow Path to Growth: The Economic Slowdown and its Macro Challenges below their benchmark. Although this analysis is subject to many caveats and should therefore be viewed with some caution35, it raises a substantive issue for LAC. In view of LAC’s saving deficit, to frontally address its growth gap, the region may need to deal with demand (i.e., raise its saving rate) as well as supply (i.e., improve the business regulatory environment, strengthen the rule of law, enhance the quality of infrastructure, etc.). Box 2.B.2: Benchmarking saving and real exchange rates The benchmarks for the domestic saving rate and the PPP-adjusted real exchange rate used in this report are borrowed from a comprehensive benchmarking exercise presented in De la Torre and Ize (2015). The benchmarks signal where a country is expected to be in terms of its main macroeconomic indicators, including its domestic saving rate and its PPP-adjusted real exchange rate given a number of country-specific characteristics. The latter include the country’s stage of economic development, structural (non-policy related) features (such as country size, demographics, natural resources), and the level of policy-related variables (such as its macroeconomic management, the quality of its institutions and the degree of openness to trade and capital flows) that is typical for countries at similar stages of economic development, thereby isolating the role of policy. To account for endogeneity, the benchmarks are derived from a five equations macroeconomic model linking a country’s saving rate, real exchange rate, growth rate, investment rate, and sovereign rating. Thus, the saving rate is a function of the growth rate as well as the real exchange rate. At the same time, the real exchange rate is a function, through the current account, of the saving rate. Investment and growth are both functions of the real exchange rate. Finally, the current account (hence saving) affects the country’s rating, which in turn affects the real exchange rate, investment and growth. Simple, equation-specific, benchmarks are first derived from each equation in the model, based on the observed values of the endogenous variables, the structural controls, and the estimated values of the policy-related variables after controlling for size and GDP per capita. Simple gaps are then computed as the average residual over the sample period, i.e., the difference between the observed values and the simple benchmarks. To ensure that benchmarks are immune to world shocks (i.e., shocks that affect all countries) the time fixed effects are left within the benchmarks (rather than the gaps). Equilibrium, model-wide, benchmarks and gaps are then construed as the linear combinations of the simple benchmarks and gaps that solve the system of equations, i.e., as the benchmarks and gaps that would be obtained by replacing on the right hand side of the regressions the observed values of the macro variables by their equilibrium values. This ensures full model consistency across variables, making the benchmarks and gaps interdependent. In this way benchmarks and gaps become a function of all exogenous controls introduced in the model, either directly (because these controls directly affect the underlying macroeconomic variable) or indirectly (through the endogenous interaction with the other macroeconomic variables in the model). In particular, as Figure 2.13 is based on simple OLS regressions (i.e., on correlations), the lines of causality remain open to interpretation. De la Torre and Ize (2015) report the results of instrumented estimates that support a line of causality going from lower savings to more appreciated exchange rates and faster growth. However, the estimates are yet partial and rather imprecise. More research is needed to confirm both the lines of causality and the magnitude of the effects. 35 | 47 FIGURE 2.12. Benchmarking Savings in LAC PANEL A. LAC Relative to Other Regions 4 PANEL B. Savings Across LAC Countries 14 12.6 12 10 3 Observed minus Predicted percentage points of GDP Observed minus Predicted percentage points of GDP 8 2 1 0 6 4 2 0 -2 -4 -6 -8 -10 -1 Panama Honduras Venezuela Peru Paraguay Chile TTO Mexico Bolivia Ecuador Uruguay Brazil Nicaragua SEA MICs Costa Rica G-7 Colombia PCEs El Salvador ECA Guatemala LAC Belize -2 Dom. Rep. -12 Notes: Savings gaps are calculated as the residuals from a regression of savings as a share of GDP against economic and demographic variables. For details on the specifics of the benchmarking exercise see de la Torre and Ize (2015). Source: Authors’calculations based on de la Torre and Ize (2015). Moreover, saving should matter not only because it may speed up growth but also because it should help open the policy space needed to smooth out growth (i.e., countercyclical capacity) and to avoid being boxed in a low growth, high current account deficit, rising inflation, declining country rating equilibrium where neither monetary policy nor fiscal policy can be used to pull the country from a downturn. Higher saving should provide monetary space by reducing interest rates and even perhaps inflation as well (the countries with positive saving gaps in Figure 2.13 do exhibit on average lower inflation rates than those with negative saving gaps). Higher underlying saving rates may also provide fiscal space for countercyclical policy by allowing governments to issue more debt at lower rates, as well as possibly raising the size of the fiscal multipliers.36 Box 2.B.3: Why can saving affect the real exchange rate and growth? Domestic and foreign saving are not perfect substitutes. There is strong empirical evidence showing that countries relying on foreign saving grow more slowly (Aizenman, Pinto and Radziwill, 2004; Prasad, Rajan and Subramanian, 2007). Furthermore, capital tends to flow from the countries with the highest productivity growth to the ones with the lowest productivity growth. As noted by Gourinchas and Jeanne (2013), this “allocation puzzle” stems from the domestic saving rate. Low saving countries need to import savings and have low productivity growth. Demand matters for the long run equilibrium real exchange rate. The empirical literature typically finds that demand affects long run equilibrium real exchange rates through wealth effects linked to net foreign asset holdings, or through public consumption effects that fall predominantly on non-tradables (Ricci et al, 2008). A related strand of literature (Banerjee and Duflo, 2005; Hsieh and Klenow, 2009) finds that factor returns do not equalize or take time to do so, which is a necessary condition for demand to have a lasting impact on the real exchange rate by durably affecting the price of nontradables relative to tradables. This could happen through two channels. Higher saving should limit crowding out, thereby allowing a debt-financed fiscal expansion to have more punch. But it might also help relax the constraints imposed by Ricardian equivalence, as it makes it easier to accommodate over time a bulge in public debt. 36 48 | LAC Treads a Narrow Path to Growth: The Economic Slowdown and its Macro Challenges FIGURE 2.13. Saving and Real Exchange Rate gaps Growth, Country Ratings and Inflation: Medians by Quadrant II Over-saving National Saving Gap 0.2 I 5.7 0.8 Undervalued -0.7 6.8 2.8 -0.6 Overvalued Under-saving 0.2 1.0 0.4 III 3.7 -0.7 IV Real Exchange Rate Gap ● Country Rating ● Growth ● Inflation Notes: The saving, exchange rate, growth and ratings gaps are calculated using a two-stage process. The first stage involves calculating simple gaps as the residuals of a regression of each macro variable against a battery of country structural characteristics and normalized policy variables. The second stage involves calculating equilibrium gaps as weighted sums of the simple gaps that solve the underlying system of equations that links all four macro variables plus the investment rate. For details see de la Torre and Ize (2015). The median values of the variables in each quadrant are calculated over the set of countries in each of the quadrants. Source: Authors’calculations based on de la Torre and Ize (2015). Of course, whether saving matters (for growth and macro stabilization capacity) and whether saving can be meaningfully affected by policy are two entirely different things. Skeptics abound who argue that there is little or no evidence of policies that have convincingly boosted saving rates, at least short of subjecting the economy to major macroeconomic upheavals or introducing massive regulatory restrictions. To such skepticism, one may propose a simple consideration. Namely, that in an entirely policy-immune saving world one would need to explain differences in saving rates across countries solely as the result of agents’ preferences. Yet, the macroeconomic outcomes are observably so distinct, indeed so direly different across countries with different saving rates that it seems difficult to conceive that rational agents would prefer not to save.37 To be sure, however, there are indeed very few cases of market economies that have forcibly and sustainably raised their saving rates from low levels. Be it as it may, a comprehensive saving-boosting reform agenda does not seem to be altogether out of reach. It could involve action most obviously on the fiscal fronts—not just in the form greater public sector saving but also via the judicious use of tax incentives to stimulate household and corporate saving. A saving-oriented policy agenda could also include financial sector regulation— aimed at facilitating asset building among households and firms and at avoiding credit-fueled consumption booms—and social protection policies—aimed at encouraging self-reliance, instead of excessive reliance on the state, at least for the higher income groups of society. A last potentially relevant issue for LAC, which is also saving-related, is whether and how China’s spending shift toward consumption, should it be as massive as some predict, might affect its own saving and growth. From a worldwide perspective, as long as global investment remains unaffected, the shift should simply lead to a reallocation of saving across countries, from China to every other country, in proportion to China’s participation in world GDP. Assuming that the weight of China in Alternatively, one may take the view that policy affects saving asymmetrically. While low saving rates largely reflect policy decisions taken over the years (not just agents’ preferences), these policies are hard to reverse. While hard to altogether deny, such view also seems too extreme. 37 | 49 world GDP reaches the 20 percent range during the next decade (up from its current 14 percent), a 10 percentage points of GDP reduction in Chinese saving should raise all other countries’ saving by 2 percentage points. If so, this would imply a non-trivial improvement in LAC’s current accounts, from an expected average deficit of 2.8 percent of GDP in 2015 to near equilibrium. In turn, the increase in LAC’s domestic saving, by contributing to depreciate the region’s real exchange rate should help accelerate its rate of growth. Based on the median increase in growth rate relative to the median depreciation when moving from quadrant 4 to quadrant 2 in Figure 2.13, this increase in output growth would be of the order of half a percentage point.38 While this alone would surely not resolve LAC’s growth problem, it would nonetheless help.39 Box 2.B.4: The main components of a saving mobilization agenda On the fiscal side, public sector saving can be directly increased by raising revenues or lowering public consumption, or both, while tax and subsidy policy can be used to foster private saving at the household and corporate levels. Actions on the financial services sector might involve financial sector reforms that facilitate savings oriented towards asset building (e.g., human capital, housing) and the channeling of savings into long-term finance, or regulations that promote saving and investment rather than consumption (for example, by expanding financial inclusion from the deposit-taking and payments side rather than from the lending side, and by preventing credit-fueled consumption booms). On the social protection side, fostering saving might require suitable redesigns to the health, pensions, and unemployment safety nets, so as to promote self-reliance (private saving) rather than excessive reliance on the state (public saving). These policies could not only raise saving directly but could also raise the elasticity of saving to growth. Concluding Thoughts LAC has historically been a region vulnerable to external shocks, whether caused by changes in world demand, international interest rates, or terms of trade. The importance of commodities in its trade makes the region particularly sensitive to fluctuations in commodity prices. Confronted with such exposures the region has progressively reduced its vulnerability. In a first stage, it has strengthened its macroeconomic management by working on the flows, through fiscal consolidation and independent central banks. In a second stage, it has built up protective buffers by working on the stocks, through debt consolidation, de-dollarization, and the build-up of foreign reserves. In a third stage, the region has strengthened its prudential policies to ensure the resiliency of its financial systems. De la Torre and Ize (2015) directly estimate the growth response elasticity to saving based on the full model estimation and the use of instrumental variables. The range they come up with is substantially higher in the case of countries with current account deficits than for countries with current account surpluses. Using this range of estimates for LAC as a whole would yield a growth impact of between 0.2 to 0.6 percentage points. 38 However, this estimate should be viewed as an upper bound, as world investment could also decline as China’s saving falls. 39 50 | LAC Treads a Narrow Path to Growth: The Economic Slowdown and its Macro Challenges It is now time for the region to work on broadening its macroeconomic policy space to ensure that it keeps at most times enough room for maneuver. On the monetary side, this means more flexibility to allow temporary deviations of the inflation rate from its target at times of supply shocks. While a further build-up of credibility may be required, the question arises as to whether some broadening of the inflation target bands might also be appropriate. On the fiscal side, a renewed effort at fiscal consolidation appears unavoidable for some countries. For most countries, the fiscal space could be broadened through the introduction or strengthening of cyclically-adjusted or structural balance rules, automatic stabilizers, stabilization funds, and medium-term expenditure frameworks. However, a key lesson of the recent deceleration experience is that for such arrangements to work effectively, the transitory or permanent nature of the shocks needs to be properly appraised and taken into account. Another lesson is that, to ensure that fiscal stimuli are as growth-oriented as possible, it might be desirable to maintain a portfolio of investment projects ready to go on short notice. At the same time, this report suggests that, for many LAC countries, building up their policy space may also require a systematic and persistent effort to raise their domestic saving rates. In addition to providing more fiscal and monetary room for maneuver and enhancing the effectiveness of countercyclical policies, this should help give the region a much needed boost to its growth potential by both raising competitiveness and improving sustainability. Of course, such a saving mobilization effort cannot be done in one day nor should it be implemented in the midst of a recession (see Box 2.B.4.). It will take time and persistence and needs to be carried out in a way that does not conflict with short-term macro stabilization objectives. It should nonetheless already color the region’s policy agenda and priorities. | 51 52 | LAC Treads a Narrow Path to Growth: The Economic Slowdown and its Macro Challenges Appendix 1. Net Commodity Positions Across LAC Throughout Chapter 1 we have analyzed the effect of China’s deceleration and the fall of commodity prices on two group of countries in the region: commodity exporting economies and commodity importing economies. To group countries into these two categories we calculate the net trade balance by commodity type as a share of GDP. This measure of net commodity position allows us to analyze whether countries experience positive or negative terms-of-trade (ToT) shocks as commodity prices change. For instance, a net commodity exporter of a particular commodity will have a positive ToT shock when the prices of that commodity rises relative to other commodity prices. Also, the fact that we are re-scaling trade balances with GDP implies that the magnitudes of the measure will be indicative of the impact of ToT shocks in the aggregate economy. In order to determine which traded goods are counted as commodities, we split goods according to the Standard International Trade Classification (SITC) Revision 3. Using this classification we identify an aggregate commodity category and three sub-categories of the aggregate commodity category. The aggregate category, labeled primary commodities, corresponds to goods in SITC categories 0-4 and 68. The three sub-categories are agricultural and animal products (SITC 0, 1, 22, and 4), metals (SITC 27, 28, 68) and fuels (SITC 3). When looking at primary commodities as a whole we have that roughly half the countries in the region are classified as commodity exporter and the other half are classified as commodity importers (Figure A.1, Panel A). All the net commodity importer are countries located in Central America and the Caribbean, while net commodity exporters includes all South American countries but also Belize, Mexico, Panama, Suriname, and Trinidad and Tobago. The geographical divide is less marked when looking at agricultural and animal commodities and metals (Figure A.1, Panel B and Panel C). In the former, among the fifteen net exporters, seven are from Central America and the Caribbean. In the latter, six of the seventeen net commodity exporters are from South America. In contrast to other commodities, only a handful of countries in the region emerge as commodity exporters of fuels (Figure A.1, Panel D). Moreover, among the six net fuel exporters in the region four are South American countries (Bolivia, Colombia, Ecuador, and Venezuela). This implies that shocks to fuel prices have very uneven effects in the region as whole. Interestingly, a glance at Figure A.1 shows that close to 80 percent of the countries in the region are net exporters of at least one of the three subcategories defined above. The exceptions to this pattern are mainly small Caribbean (Antigua and Barbuda, Haiti, St. Kitts and Nevis, and St. Vincent and the Grenadines). | 53 40% 30% 20% 10% 0% -10% -20% -30% -40% 2% 0% -4% -6% -10% -12% -16% -18% Paraguay Belize Uruguay Honduras Argentina Ecuador Guyana Bolivia Guatemala Panama Chile Brazil St. Lucia Costa Rica Peru Nicaragua Mexico Colombia Dom. Rep. Suriname El Salvador Venezuela Bahamas Trin. & Tob. Ant. & Barb. Jamaica St. Kit. & Nev. Dominica Grenada St. Vinc. & Gren. Haiti Bolivia Paraguay Trin. & Tob. Chile Ecuador Venezuela Colombia Peru Belize Uruguay Argentina Brazil Suriname Panama Mexico Guatemala Honduras Guyana Costa Rica Ant. & Barb. Dom. Rep. St. Kit. & Nev. Nicaragua El Salvador Jamaica Bahamas Dominica Grenada Haiti St. Vinc. & Gren. St. Lucia Aggregate Net Imports/GDP in 2013 PANEL C. Metals Net Imports/GDP in 2013 Trin. & Tob. Bolivia Venezuela Colombia Ecuador Mexico Peru Paraguay Argentina St. Kit. & Nev. Brazil Panama Haiti Ant. & Barb. Uruguay Suriname Costa Rica Guatemala Chile Dominica El Salvador Belize Dom. Rep. Grenada Nicaragua Honduras St. Vinc. & Gren. Bahamas Jamaica Guyana St. Lucia Chile Suriname Peru Bolivia Jamaica Guyana Brazil Honduras Panama Venezuela Dominica Guatemala Dom. Rep. Mexico St. Lucia Grenada Bahamas Argentina Haiti Paraguay Nicaragua Colombia Ant. & Barb. St. Vinc. & Gren. El Salvador Uruguay Ecuador St. Kit. & Nev. Belize Costa Rica Trin. & Tob. FIGURE A.1. Net Commodity Positions Across LAC PANEL A. Primary Commodities, PANEL B. Agricultural and Animal Commodities 25% Net Imports/GDP in 2013 20% 15% 10% 5% -5% 0% -10% -15% -20% -25% PANEL D. Fuels 40% Net Imports/GDP in 2013 -2% 30% 20% -8% 10% 0% -14% -10% -20% -30% Notes: The aggregate category in Panel A corresponds to goods in SITC categories 0-4 and 68. The three sub-categories in Panels B to D are agricultural and animal products (SITC 0, 1, 22, and 4), metals (SITC 27, 28, 68) and fuels (SITC 3). Source: LCRCE Staff calculations based on UNCTAD and WDI. 54 | LAC Treads a Narrow Path to Growth: The Economic Slowdown and its Macro Challenges Appendix 2. Primary Fiscal Balance Sustainability Index The primary fiscal sustainability index is an adaptation of the primary balance sustainable gap presented in Ley (2009). It captures the gap between the observed primary fiscal balance and the primary balance needed to sustain the current level of net public debt (which is a function of the interest rate paid on debt, GDP growth, and inflation) The index is given by: 𝑖𝑙𝑐𝑢 − 𝜋𝑙𝑐𝑢 − 𝑔 𝑖𝑢𝑠 − 𝜋𝑢𝑠 − 𝑔 𝑃𝑟𝑖𝑚𝑎𝑟𝑦 𝐵𝑎𝑙𝑎𝑛𝑐𝑒 𝑆𝑢𝑠𝑡𝑎𝑖𝑛𝑎𝑏𝑖𝑙𝑖𝑡𝑦 𝐼𝑛𝑑𝑒𝑥 = 𝑝 − ( ) 𝑑𝑙𝑐𝑢 − ( ) 𝑑𝑢𝑠 1+𝑔 1+𝑔 where 𝑔 represents the nominal GDP growth rate, 𝑝 the primary fiscal balance (as a share of GDP), 𝑑𝑙𝑐𝑢 the net debt (as a share of GDP) denominated in local currency, 𝑖𝑙𝑐𝑢 the nominal long term interest rate that applies to the public debt denominated in local currency, 𝜋𝑙𝑐𝑢 the home inflation rate, 𝑑𝑢𝑠 the net public debt (as a share of GDP) denominated in US dollars, 𝑖𝑢𝑠 the interest rate on the debt denominated in US dollars, and 𝜋𝑢𝑠 the US inflation rate. Table A.2.1 describes the data sources and periods used for the sustainability index in 2006-2008 (top row in each box) and in 2015 (bottom row in each box). TABLE A.2.1. Definition and source of the variables Variable Source Primary Fiscal Balance (𝑝) WEO GDP growth (𝑔) WEO Period 2006-2008 2011-2014 2006-2008 2015-2019 2006-2008 Net Debt as a share of GDP (𝑑𝑙𝑐𝑢 +𝑑𝑢𝑠 ) WEO, WDI 2013 2006-2008 Share of debt in US dollars Inflation rate (𝜋𝑙𝑐𝑢 , 𝜋𝑢𝑠 ) IDB Macro Monitor 2013 2006-2008 WEO 2015 Comments Simple average over the period Annual projected GDP growth, simple average over the period. For 2006-2008, simple average over the period. For Argentina, Ecuador, Guatemala, Jamaica, El Salvador, and Venezuela: Gross Debt as a share of GDP (WEO) minus International Reserves as a share of GDP (WDI) For Bolivia: data for the latest period is from 2012. For Jamaica and El Salvador: the net debt is assumed to be only denominated in US dollars. For Mexico: Secretaria de Hacienda y Crédito Publico. For 2006-2008, simple average over the period. | 55 Interest rate on the local debt (𝑖𝑙𝑐𝑢 ) Interest rate on the debt denominated in US dollars(𝑖𝑢𝑠 ) For the 2006-2008 we take the average for the period. For Brazil, Chile, Colombia, Costa Rica, El 2006-2008 Salvador, Jamaica, Mexico, Peru, and Venezuela: Interest rate on 10-year government bonds Bloomberg, For Argentina, Dominican Republic, Institutional Ecuador, Guatemala, and Panama: Sum of Investor U.S. dollar Libor plus the predicted spreads database from a fixed-effect OLS regression of J. P. Beginning of Morgan’s EMBI on the Institutional March 2015 Investor Rating (see World Bank Group January 2015 Global Economic Prospects for more details on the predicted local currency rate.) 2006-2008 For 2006-2008, simple average over the period. Bloomberg Beginning of EMBIs spread plus 10-year US Treasury March 2015 Bond rate 56 | LAC Treads a Narrow Path to Growth: The Economic Slowdown and its Macro Challenges References Aizenman, J., B. Pinto and A. Radziwill, 2004. “Sources for Financing Domestic Capital: Is Foreign Saving a Viable Option for Emerging Countries?” NBER Working Paper No. 10624. Arezki, R. and O. Blanchard, 2014. “Seven Questions about the Recent Oil Price Slump,” IMF Direct Blog: http://blog-imfdirect.imf.org/2014/12/22/seven-questions-about-the-recent-oil-priceslump/. Banerjee, A. and E. Duflo, 2005. “Growth Theory through the Lens of Development Economics”, Massachusetts Institute of Technology Blagrave, P., R. García-Saltos, D. Laxton, and F. Zhang, 2015. “A Simple Multivariate Filter to Calculate Potential Output,” IMF Working Paper WP/15/79. Calvo, G. and C. Reinhart, 2002. “Fear of Floating,” The Quarterly Journal of Economics, MIT Press, Vol. 117(2), pp. 379-408, May. De la Torre, A., T. Didier, C. Calderón, T. Cordella, and S. Pienknagura, 2011. Latin America and the Caribbean’s Long-term Growth: Made in China? LAC Semiannual Report (October), World Bank, Washington, D.C. De la Torre, A., T. Didier, A. Ize, D. Lederman, and S. Schmukler, 2015. Latin America and the Rising South: Changing World, Changing Priorities. Washington, DC: World Bank. (forthcoming). De la Torre, A., T. Didier, and S. Pienknagura, 2012. Latin America and the Caribbean Copes with Volatility, the Dark Side of Globalization. LAC Semiannual Report (April), World Bank, Washington, D.C. De la Torre, A. and A. Ize, 2015. “Saving for Growth”, Mimeo, World Bank De la Torre, A., E. Levy Yeyati, G. Beylis, T. Didier, C. Rodríguez Castelán, and S. Schmukler, 2014. Inequality in a Lower Growth LAC. LAC Semiannual Report (October), World Bank, Washington, D.C. De la Torre, A., E. Levy Yeyati and S. Pienknagura, 2013. Latin America and the Caribbean as Tailwinds Recede: In Search of Higher Growth. LAC Semiannual Report (April), World Bank, Washington, D.C. De la Torre, A., E. Levy Yeyati and S. Pienknagura, 2013. Latin America’s Deceleration and the Exchange Rate Buffer. LAC Semiannual Report (October), World Bank, Washington, D.C. De la Torre, A., J. Messina and S. Pienknagura, 2012. The Labor Market Story Behind Latin America's Transformation. LAC Semiannual Report (October), World Bank, Washington, D.C. Frankel, J. and A. Rose, 2010. "Determination of Agricultural and Mineral Commodity Prices", Chapter 1 in Inflation in an Era of Relative Price Shocks, Reserve Bank of Australia: Sydney) pp. 951. Frankel, J., C. Vegh, and G. Vulletin, 2013. “On Graduation from Fiscal Procyclicality,” Journal of Development Economics, Vol. 100 (1): 32-47. Gourinchas, P. O., and O. Jeanne, 2013. “Capital Flows to Developing Countries: The Allocation Puzzle.” Review of Economic Studies, Oxford University Press, 80(4): 1484-1515. Hsieh, C.T., and P. Klenow, 2009. “Misallocation and Manufacturing TFP in China and India”, Quarterly Journal of Economics, 124(4), 1403-1448. IMF (International Monetary Fund), 2015. World Economic Outlook: Uneven Growth: Short and Longterm Factors. April. Washington, DC: IMF. Ilzetzki, E., E. Mendoza, and C. Vegh, 2013. “How Big (Small) Are Fiscal Multpliers?” Journal of Monetary Economics, Vol. 60 (2): 239-254. Levy Yeyati, E., F. Sturzenegger, and P. Gluzmann, 2013. "Fear of Appreciation," Journal of Development Economics, Elsevier, vol. 101(C), pages 233-247. | 57 Levy Yeyati, E. and T. Williams, 2012. “Emerging Economies in the 2000s: Real Decoupling and Financial Recoupling,” Journal of International Money and Finance, Vol. 31 (8): pp. 2102-2126. Ley, E., 2009. “Fiscal Policy for Growth.” PREM Note 131, World Bank, Washington, DC. Prasad, E., R. Rajan and A. Subramanian, 2007. “Foreign Capital and Economic Growth”, Cornell University. Powell, A. coord., 2014. Global Recovery and Monetary Normalization: Escaping a Chronicle Foretold? 2014 Latin America and the Caribbean Macroeconomic Report. Washington, DC: Inter-American Development Bank. Powell, A. coord., 2015. The Labyrinth: How Can Latin America and the Caribbean Navigate the Global Economy? 2015 Latin America and the Caribbean Macroeconomic Report. Washington, DC: Inter-American Development Bank. Ricci, L.A., G.M. Milesi-Ferreti and J. Lee, 2008. “Real Exchange Rates and Fundamentals: A CrossCountry Perspective”, IMF Working Paper WP/08/13. World Bank Group, 2015. Global Economic Prospects, January 2015: Having Fiscal Space and Using It. Washington, DC: World Bank. World Bank Group, 2015. Commodity Markets Outlook, January 2015. Washington, DC: World 58 | LAC Treads a Narrow Path to Growth: The Economic Slowdown and its Macro Challenges The World Bank 1818 H Street, NW, Washington, DC 20433, USA. www.worldbank.org/laceconomist


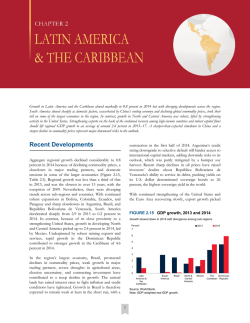


© Copyright 2026