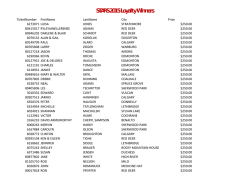
ECEAP Disability Enrollment.xlsx
ECEAP Disability Enrollment
(As of March 2015)
Inscripciones de ninos con incapacitades en ECEAP (marzo 2015)
Site
# of Children on IEP
Funded Enrollment Bates Campus ECEAP Downtown
1
31
3%
Bates Eastside ECEAP
1
40
3%
Bethel Clover Creek Elementary ECEAP
1
18
6%
Bethel Pioneer Valley Elementary ECEAP
1
17
6%
Bethel Shining Mountain Elementary ECEAP
1
44
2%
Bethel Spanaway Elementary ECEAP
1
28
4%
Bethel Thompson Elementary ECEAP
1
54
2%
Clover Park Oakwood Elementary ECEAP
1
72
1%
Federal Way Brigadoon Elementary ECEAP
1
20
5%
Federal Way Star Lake Elementary
1
36
3%
Kent ‐ Sunrise Elementary
1
72
1%
Kent Valley ‐ ECEAP
1
36
3%
Lake Hills Elementary ECEAP
1
20
5%
PCCC Eatonville ECEAP
1
18
6%
PCCC Sumner ECEAP @ Daffodil Valley
1
54
2%
Peninsula Vaughn Elementary ECEAP
1
18
6%
Tacoma Boze Early Childhood Center ECEAP
1
38
3%
Tacoma Whittier Elementary ECEAP
1
31
3%
Tacoma Willard ECEAP
1
29
3%
TCC Early Learning Center
1
20
5%
Tukwila Cascade View Elementary ECEAP
1
36
3%
Vashon Island ECEAP @ Chautauqua Elem
1
20
5%
Wellspring Family Services Early Learning Center
1
10
10%
Auburn Alpac Elementary
2
18
11%
Bates Campus ECEAP South
2
40
5%
Bethel Nelson ECEAP
2
35
6%
Clover Park Custer Elementary ECEAP
2
36
6%
Clover Park Dower Elementary ECEAP
2
18
11%
Clover Park Lakeview ECEAP
2
108
2%
Federal Way Norman Center
2
40
5%
Federal Way Thomas Jefferson High School ECEAP
2
36
6%
Federal Way Woodmont Elementary ECEAP
2
36
6%
Kent Youth @ HSP (Holy Spirit Parish)
2
36
6%
Multicultural Child & Family Hope Center
2
118
2%
PCCC South Hill ECEAP @ Zieger Elem.
2
54
4%
PETITE DAY CARE
2
23
9%
Tacoma Sheridan Elementary ECEAP
2
38
5%
Clover Park Hillside Elementary ECEAP
3
36
8%
Clover Park Rainier ECEAP
3
36
8%
Daybreak Star Indian Cultural Center
3
20
15%
Federal Way Decatur High School ECEAP
3
36
8%
Bates Puyallup ECEAP@First Presbyterian Church
4
70
6%
Clover Park Evergreen Elementary ECEAP
4
36
11%
Highline Valley View Early Learning Cent
5
162
3%
Kent Family Center ‐ ECEAP
5
36
14%
Lake Wilderness Elementary ECEAP
5
18
28%
PCCC Orting ECEAP
5
36
14%
PCCC Buckley ECEAP @ White River Middle School
6
36
17%
Franklin Pierce Spanaway Elementary ECEAP
8
72
11%
Total
105
2,640
Department of Early Learning
Early Childhood Education and Assistance Program
% of IEP/IFSP Note: Total # of children on on IEP at any time during this school year is 151 (6%). Enrollment report only captures children who had an IEP at enrollment.
Nota: El numero total de niños en planes de educacion individualizados (IEP) es 151 (6%) durante el año escolar. El reporte de inscripcion solo captura los ninos que tuvieron un IEP cuando se inscribieron. 4%
Generated on March 20, 2015
Page 1 of 1
© Copyright 2026

