
Visual Grouping in Menu Interfaces
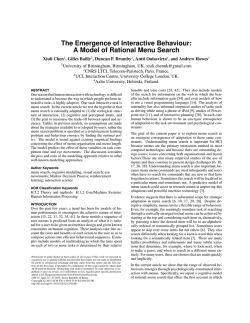
Visual Grouping in Menu Interfaces
Duncan P. Brumby and Susan Zhuang
UCL Interaction Centre
University College London
London WC1E 6BT UK
[email protected]
ABSTRACT
Menu interfaces often arrange options into semantic groups.
This semantic structure is then usually conveyed to the user
by supplementary visual grouping cues. We investigate
whether these visual grouping cues actually help users
locate items in menus faster, and whether there is potential
for these powerful grouping cues to impede search when
used inappropriately. Thirty-six participants performed
known-item searches of word menus. These menus differed
along three dimensions: (1) whether visual grouping cues
were used, (2) whether items were semantically organized,
and (3) the number of items belonging to each semantic
group. Results show that the usefulness of visual grouping
entirely depends on the underlying semantic structure of the
menu. When menus were semantically organized, having
visual grouping cues delineate the boundaries between large
semantic groups resulted in the fastest search times. But
when semantically unrelated items were visually grouped
together, participants took far longer to locate targets. Menu
designers should therefore take great care to avoid visually
grouping semantically unrelated items as this has the
potential to hinder menu interactions.
Author Keywords
Visual search; menus; eye-tracking; interaction science.
ACM Classification Keywords
H.5.2 User Interfaces: evaluation/methodology, screen
design, theory and methods.
INTRODUCTION
Menu interfaces appeared in the earliest personal computers
and are still in widespread use today. They are used in all
desktop applications, on most websites, on smartphones and
tablets, and even on home heating control panels and
medical devices. Regardless of the application domain,
menu interfaces should allow the user to locate and select
the desired item as quickly and easily as possible.
Permission to make digital or hard copies of all or part of this work for
personal or classroom use is granted without fee provided that copies are
not made or distributed for profit or commercial advantage and that
copies bear this notice and the full citation on the first page. Copyrights
for components of this work owned by others than ACM must be honored.
Abstracting with credit is permitted. To copy otherwise, or republish, to
post on servers or to redistribute to lists, requires prior specific
permission and/or a fee. Request permissions from [email protected].
CHI 2015, April 18 - 23, 2015, Seoul, Republic of Korea Copyright 2015
ACM 978-1-4503-3145-6/15/04...$15.00
http://dx.doi.org/10.1145/2702123.2702177
(a)
(b)
Figure 1.(a) Settings menu from Apple iPad iOS7 and
(b) File menu from Microsoft Word Mac 2011. Both menus
group semantically related content together and use visual
grouping cues (either spatial proximity or common region) to
communicate the intended structure.
An extensive literature has sought to understand the factors
that influence search time during menu interactions
[2,3,4,6,7]. One important finding is that organizing the
content of menus into semantically related groups helps
users locate items faster [4]. This semantic grouping effect
has been replicated numerous times [2,6], and examples of
semantically arranged menus abound. For instance,
Figure 1 shows two common menu interfaces (the Settings
menu from Apple iPad and the File menu from Microsoft
Word). Both group functionally related items together (e.g.,
Airplane Mode, WiFi, and Bluetooth are all concerned with
managing radios of the iPad, whereas the next group of
items is concerned with managing notifications).
The menus shown in Figure 1 also use visual grouping cues
to make the intended semantic organization of the menu
pop out. The Settings menu of the iPad uses spatial
proximity (i.e., spacing) to group items, while the desktop
application menu bar of Microsoft Word uses common
region (i.e., dividing lines). Despite the apparent
widespread use of visual grouping cues in menu interfaces,
we wonder whether these cues actually help users locate
items faster. An early study by Parkinson, Sisson, and
Snowberry [7] found that visual grouping can facilitate
menu search performance. Participants searched menus that
organized content into semantically related groups. Visual
No grouping
grouping cues were then used to reinforce this coherent
structure, helping participants locate items faster.
A menu search experiment was designed to unpick the
influence of visual grouping effects from the influence of
semantic ordering effects. Participants performed knownitem searches in menus that differed in terms of:
(1) whether visual grouping cues were present, (2) whether
items were semantically organized, and (3) the number of
items belonging to each semantic group. This last factor
was included to reflect the variability that is usually seen in
how items are grouped in menus (e.g., Fig. 1 shows group
sizes of between one and five items).
Following Parkinson et al. [7], we would expect visual
grouping cues to help participants locate targets faster when
menu items are arranged into cohesive semantic groups.
But when semantically unrelated items are visually grouped
together we might expect search times to increase because
these cues will give the impression that there is a
meaningful structure to the menu (even though there is
none).
In designing the experiment we sought to replicate and
extend Halverson and Hornof [6]. But unlike in this
previous study, we choose to use line boxes to group items
(as shown in Fig. 2). Using boxes is this way is known to be
a particularly effective visual grouping cue for
communicating informational structure [1]. A further
benefit of using boxes is that the presence/absence of visual
grouping can be varied without impacting other aspects of
the display. In contrast, using spatial proximity to group
items would increase the physical distance between groups
of items, and this is known to affect search behavior [3].
METHOD
Participants
Thirty-six participants (nine male) aged between 19 and 23
years were recruited through the UCL Psychology Subject
Pool. All were native English speakers, with normal or
corrected-to-normal vision, and experienced computer
users.
Random order
Semantic order
In practice though it is often quite challenging for designers
to get the semantic structure of a menu interface right [5].
Examples of menus that group semantically unrelated items
together are surprisingly common. For instance, the final
group of items in the Apple iPad Settings menu (i.e.,
General, Wallpaper, Sounds, Passcode, Privacy) might best
be described as the 'everything else' group. Previous
research has used unordered (randomized) menu layouts to
capture the situation in which menu items have weak
semantic congruence [2,4,6], finding that users are slower
at locating targets in unordered menus. Is there a danger
that inappropriate visual grouping cues might compound
the problems of poor semantic grouping and slow search
time yet further?
small groups
large groups
Visual grouping
small groups
large groups
earthquake
parrot
earthquake
parrot
thunder
actress
thunder
actress
skirt
lion
skirt
lion
eyeliner
fireman
eyeliner
fireman
pants
carpenter
pants
carpenter
jacket
dog
jacket
dog
lipstick
nurse
lipstick
nurse
powder
eagle
powder
eagle
toffee
secretary
toffee
secretary
jellybeans
elephant
jellybeans
elephant
caramel
wolf
caramel
wolf
hurricane
lawyer
hurricane
lawyer
pants
parrot
pants
parrot
skirt
dog
skirt
dog
jacket
elephant
jacket
elephant
lipstick
eagle
lipstick
eagle
eyeliner
wolf
eyeliner
wolf
powder
lion
powder
lion
toffee
secretary
toffee
secretary
caramel
lawyer
caramel
lawyer
jellybeans
actress
jellybeans
actress
thunder
fireman
thunder
fireman
earthquake
nurse
earthquake
nurse
hurricane
carpenter
hurricane
carpenter
Figure 2. Illustration of each experimental condition
(semantic order × semantic group size × visual grouping).
Actual menus contained 3 columns of 12 menu items each, all
conforming to one of the conditions depicted above.
Materials
All menus contained 36 single-word items. We generated
these menus from the same database of words as used in
previous studies [2,3,6]. This database is useful because it
contains 560 unique words (with character length M = 6.2,
SD = 2.0, range: 2 – 12), organized into natural categories.
There are 14 top-level categories (e.g., animal, building,
entertainment), with each of these separated into four midlevel categories (e.g., bird, farm animal, tropical fish, and
wild animal are all members of the animal category).
Finally, for each mid-level category there are 10 instances
(e.g., bluebird, canary, starling, eagle, hawk are all
members of the bird sub-category). Human ratings have
previously been gathered for these materials and confirm
that items from the same semantic groups are judged as
being more closely related than items from a different
semantic group (see [2] for details).
Each menu contained 36 items that were arranged as three
columns of 12 items each. The horizontal separation
between items in each column was 30 pixels (0.70° of
visual angle), with the first item being 80 pixels from the
top of the screen. The vertical separation between each
column was 250 pixels (6° of visual angle). All text was
presented in an Arial font, size 10. Items had to be arranged
across multiple columns (giving a 2D menu); had we
presented all 36 items as a single 1D list the font would
have been far smaller and items much closer together.
Stimuli were presented on a 17-inch monitor (1024 x 768
resolution). Eye movements were recorded using a Tobii
1750 eye tracker. The sampling rate of the eye tracker was
50 Hz, with gaze point accuracy of less than 0.5° of visual
Design
A 2×2×2 (semantic order × semantic group size × visual
grouping) mixed design was used. Semantic order and
group size were both manipulated as within-subjects
factors. In the semantic order condition, items belonging to
the same group were listed together, whereas in the random
condition, items were jumbled and presented in no order.
Menus differed in terms of the number of items that came
from the same top-level category (i.e., semantic group).
Menus contained either six groups of six related items
(large groups), or were made up of 12 groups of three
related items (small groups). Visual grouping was
manipulated as a between-subjects factor. This meant that
half of the participants searched menus that always had
boxes grouping sets of items, while the other half of
participants searched menus that did not have boxes.
Procedure
Participants were informed that they would be required to
search menus to locate a given target. At the start of each
trial, participants were told what word they were looking
for, as well as a top-level category description of that word
(e.g., “Find a type of animal, wolf”). After reading this,
participants started a trial by clicking a button on the
screen. This made the target description disappear, and the
menu appeared beneath it. Participants were told that there
was only a single target item in each menu and that they
had to locate it as quickly as possible. Participants selected
an item by clicking on it with the mouse. If an incorrect
selection was made, participants were instructed to make
another selection from the same menu after being shown
the target information again. The trial ended when the
participant had successfully selected the target. Before
proceeding to the next trial, participants were given
feedback on the time taken to locate the target. The purpose
of this feedback was to reinforce the instruction to locate
the target quickly.
Each participant completed 100 search trials, divided into
two blocks of 50 trials each (grouped by semantic order
condition). The sequence in which each semantic order
condition was experienced was counter-balanced between
participants: half of the participants did all of the semantic
order searches before the random order searchers, and vice
versa. The presentation order of different semantic group
size conditions was randomized within a given semantic
order condition. The eye tracker was calibrated before the
start of each block to ensure accurate gaze tracking.
Participants were seated approximately 60-70 cm from the
monitor throughout the experiment, and were given the
opportunity for a short break in between blocks. The entire
experiment took approximately 30 minutes to complete.
*
5
Search time, in seconds
angle. The experimental software ran on Microsoft
Windows XP. An optical mouse was used, set at the
‘medium’ speed via the system control panel.
Small groups
Large groups
**
ns
ns
4
ns
ns
**
3
2
1
0
No grouping Visual grouping
Random order
No grouping Visual grouping
Semantic order
Figure 3. Mean search time across conditions.
Error bars depict standard errors. *p < .05 **p < .001
RESULTS
A mixed ANOVA was used, with a significance level of .05
for judging the significance of effects. We excluded trials
from the analysis in which the participant did not correctly
select the target on the first attempt. Accuracy was
generally very high: mean accuracy for each condition was
between 98–100%, and data from only 44 trials were
excluded (from a total of 3,600).
The primary measure of interest was search time (i.e., how
long it took participants to correctly locate and select the
target item). Figure 3 shows mean search time data for each
condition. It can be seen in the figure that participants were
significantly faster at locating targets in menus that were
semantically organized (M = 3.34, SD = 0.56) than menus
that were randomly organized (M = 4.23, SD = 0.80),
F(1, 34) = 79.52, p < .001, ηp2 = .70. While there was not a
significant main effect of either semantic group size or of
visual grouping, F’s < 2, there was a significant three-way
interaction, F(1, 34) = 3.94, p = .05, ηp2 = .10.
The significant three-way interaction suggests that the
effects of semantic group size and visual grouping are
dependent on whether or not the menu is semantically
organized. We therefore separate the analysis of
semantically organized menus from the randomly organized
ones, and for each, consider the effect of semantic group
size and visual grouping. For semantically organized
menus, there was a significant two-way interaction between
group size and visual grouping, F(1, 34) = 4.23, p = .05,
ηp2 = .11. Follow-up tests of this interaction show that when
there was visual grouping in the menu, participants were
significantly faster at searching menus with larger semantic
groups (M = 3.04, SD = 0.41) than menus with smaller
semantic groups (M = 3.62, SD = 0.60), F(1, 34) = 13.78, p
< .001, ηp2 = .28. However, there was no effect of group
size when there was no visual grouping, F < 1. For
randomly organized menus, there was a different pattern of
effects. Participants were now significantly slower at
searching menus that had visual grouping cues (M = 4.51,
SD = 0.73) than those that did not show grouping cues
(M = 3.95, SD = 0.78), F(1, 34) = 5.00, p = .03, ηp2 = .13.
Finally, eye movement data are considered to understand
the effects of semantic and visual grouping. In general,
fixation count data revealed the same pattern of statistical
effects as the search time data. This is because there is a
simple linear relationship between fixation counts and
search time, R2 = .45, t(34) = 5.41, p < .001. A more
interesting finding from the eye movement data is that the
mean distance (in pixels) between contiguous fixations was
greater when participants searched semantically organized
menus (M = 6.66, SD = 1.58) than when they searched
randomly organized menus (M = 5.94, SD = 1.41), F(1,34)
= 18.83, p < .001, ηp2 = .36. This suggests that participants
were adapting their search strategy to the semantic structure
of the menu. This makes sense: encountering a semantically
unrelated item during search informs the searcher that the
target is unlikely to be in that part of the menu, and that
attention should be directed elsewhere, allowing the target
to be located faster. There was however no effect of either
grouping or semantic group size on mean distance between
fixations, F’s < 1.
DISCUSSION
Consistent with previous research [2,4,6], we found that
organizing the content of menus into semantically related
groups helped participants locate items faster. Consistent
with [7], adding visual grouping cues to semantically
organized menus helped further speedup search times, but
only when menus contained fewer, larger groups. Being
able to easily see the boundaries between semantically
distinct groups presumably helped participants to
systematically assess each group in turn. This meant that
groups containing an irrelevant item could be dismissed, so
helping participants quickly hone in on the target group.
The results of this study also highlight the potential for
visual grouping cues to hinder menu interactions when used
inappropriately. In particular, we found that when
semantically unrelated items were grouped together,
participants took far longer to locate targets. This is an
important finding because in practice it is often difficult to
get the semantic structure of a menu interface right [5].
Adding visual grouping cues to an already poorly organized
menu can make matters worse and should be avoided.
Limitations
Menus are used in a variety of settings, by a variety of
users, to achieve a variety of goals. We end by considering
how some of the decisions made in designing this
experiment might warrant further investigation.
First, the study reported here used line-drawn boxes to
group items. There are of course other visual cues that can
be used. In Figure 1a, for instance, spatial proximity is
used. Color can also be used (as in [6]). It is presently not
clear how the choice of visual grouping cue might influence
the pattern of results reported here, although we suspect it
will make little difference.
Second, participants were given a precise description of the
item that had to be located in the menu (known-item
search). But often the user only has a vague idea of how the
target will be specified (semantic search). This distinction is
interesting because users adopt different eye gaze strategies
depending on the kind of activity they are engaged in [3].
We might expect visual grouping cues, which highlight the
fine-grained semantic structure of the menu, to offer even
greater benefit to users engaged in a semantic search
(because they cannot adopt simple letter-matching
strategies that would be otherwise insensitive to visual
grouping effects).
Finally, we had participants interact with each menu only
once. While this is representative of many infrequent or
first time menu interactions, there are many occasions in
which users frequently interact with the same menu.
Previous research has shown that some menu layout effects
are diminished when users repeatedly interact with the same
menu [2]. Usually this is explained by assuming that users
learn over time the spatial location of targets in the menu
[2]. Would we find a similar reduction in effect size here?
All of these avenues require further empirical work.
ACKNOWLEDGEMENTS
This work was supported by the UK Engineering and
Physical Sciences Research Council grant EP/G059063. We
thank Gilles Bailly, Antti Oulasvirta, and Andrew Howes
for encouraging us to publish this work, as well as our
reviewers for their constructive feedback.
REFERENCES
1. Bae, J. & Watson, B. Reinforcing visual grouping cues
to communicate complex informational structure. IEEE
Transactions on Visualization and Computer Graphics,
20, (2014), 1973-1982.
2. Bailly, G., Oulasvirta, A., Brumby, D.P., & Howes, A.
Model of visual search and selection time in linear
menus. Proc. CHI '14, ACM (2014), 3865-3874.
3. Brumby, D.P., Cox, A.L., Chung, J., & Fernandes, B.
How does knowing what you are looking for change
visual search behavior? Proc. CHI '14, ACM (2014),
3895-3898.
4. Card, S.K. User perceptual mechanisms in the search of
computer command menus. Proc CHI '82, ACM (1982),
190-196.
5. Chi, E.H., Rosien, A., Supattanasiri, G., et al. The
bloodhound project: Automating discovery of web
usability issues using the infoscent simulator. Proc CHI
'03, ACM (2003), 505-512.
6. Halverson, T. & Hornof, A.J. The effects of semantic
grouping on visual search. Proc CHI EA ’08, ACM
(2008), 3471-3476.
7. Parkinson, S.R., Sisson, N., & Snowberry, K.
Organization of broad computer menu displays.
International Journal of Man-Machine Studies, 23,
(1985), 689-697.


© Copyright 2026