
Price Report - January 30, 2015
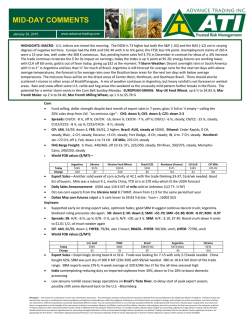
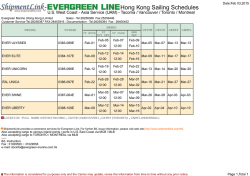
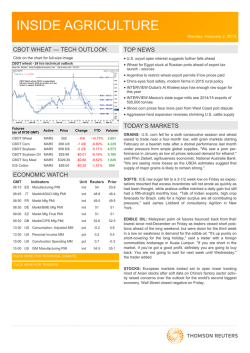
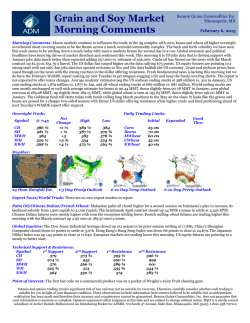
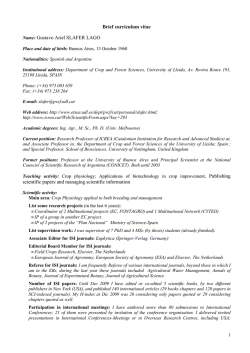
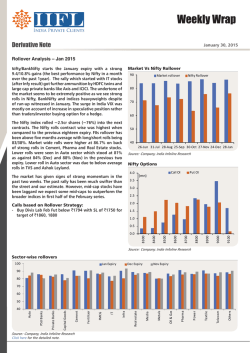
U.S. Wheat Associates
Weekly Price Report
January 30, 2015
Export
Region
Great
Lakes
Gulf of
Mexico
Pacific
N. West
JAN (H15)
(nearbys)
FOB $/bu
Percent Protein
12% (Dry) Moisture Basis
NS/DNS 13.0 (14.8)
NS/DNS 13.5 (15.3)
NS/DNS 14.0 (15.9)
NS/DNS 13.0 (14.8)
NS/DNS 13.5 (15.3)
NS/DNS 14.0 (15.9)
HRW Ord
HRW 11.0 (12.5)
HRW 11.5 (13.1)
HRW 12.0 (13.6)
HRW 12.5 (14.2)
SRW
NS/DNS 13.0 (14.8)
NS/DNS 13.5 (15.3)
NS/DNS 14.0 (15.9)
HRW Ord
HRW 11.5 ((13.1))
HRW 12.0 (13.6)
HRW 13.0 (14.8)
SW Unspecified
SW 10.5 (11.9) Max
SW 9.5 (10.8) Max
WW with 10% Club
WW with 20% Club
M
M
M
M
M
M
K
K
K
K
K
C
M
M
M
K
K
K
K
$
$
$
$
$
closed
closed
closed
7.57
7.87
8.17
6.60
6.65
6.70
6.75
6.80
6.38
7.02
7.12
7.32
6.55
6.60
6.65
6.90
6.50
7.25
7.75
7.45
7.70
JAN (H15)
FEB (H15)
MAR (H15)
APR (K15)
MAY (K15)
JUN (N15)
JUL (N15)
$/bu
$/MT
$/MT
¢/bu
$/MT
¢/bu
$/MT
¢/bu
$/MT
¢/bu
$/MT
¢/bu
$/MT
¢/bu
$/MT
¢/bu
Year Ago
(nearbys)
$/MT
N/A
N/A
N/A
-0.04
-0.04
-0.04
-0.24
-0.24
-0.24
-0.24
-0.24
-0.32
-0.64
-0.64
-0.54
-0.04
-0.04
-0.04
-0.04
-0.45
-0.70
-0.95
-0.45
-0.45
N/A
N/A
N/A
-2
-2
-2
-9
-9
-9
-9
-9
-12
-24
-24
-20
-1
-1
-1
-1
-17
-26
-35
-17
-17
closed
closed
closed
278
289
300
243
244
246
248
250
234
258
262
269
241
243
244
254
239
266
285
274
283
N/A
N/A
N/A
200
230
260
120
125
130
135
140
135
145
155
175
115
120
125
150
6.50
7.25
7.75
7.45
7.70
closed
closed
closed
278
289
300
243
244
246
248
250
232
258
262
269
241
243
244
254
239
266
285
274
283
N/A
N/A
N/A
200
230
260
120
125
130
135
140
130
145
155
175
115
120
125
150
6.50
7.25
7.75
7.45
7.70
closed
closed
closed
278
289
300
243
244
246
248
250
231
258
262
269
241
243
244
254
246
274
292
281
290
N/A
N/A
N/A
200
230
260
120
125
130
135
140
125
145
155
175
115
120
125
150
6.70
7.45
7.95
7.65
7.90
239
252
265
280
291
302
244
245
247
249
251
230
259
263
271
242
244
245
255
250
277
296
285
294
90
125
160
200
230
260
120
125
130
135
140
120
145
155
175
115
120
125
150
6.80
7.55
8.05
7.75
8.00
239
252
265
280
291
302
244
245
247
249
251
230
259
263
271
242
244
245
255
250
277
296
285
294
90
125
160
200
230
260
120
125
130
135
140
120
145
155
175
115
120
125
150
6.80
7.55
8.05
7.75
8.00
242
255
268
283
294
305
245
247
248
250
252
227
262
266
273
243
245
247
256
250
277
296
285
294
90
125
160
200
230
260
120
125
130
135
140
105
145
155
175
115
120
125
150
6.80
7.55
8.05
7.75
8.00
242
255
268
283
294
305
245
247
248
250
252
227
262
266
273
243
245
247
256
250
277
296
285
294
90
125
160
200
230
260
120
125
130
135
140
105
145
155
175
115
120
125
150
6.80
7.55
8.05
7.75
8.00
N/A
N/A
N/A
327
352
363
279
281
283
285
290
256
314
321
332
305
307
309
325
281
285
292
287
301
week change
FOB
Basis
FOB
Basis
FOB
Basis
FOB
Basis
FOB
Basis
FOB
Basis
FOB
Basis
Durum: a range of prices are available depending upon various quality attributes.
Futures Settlements as of
January 30, 2015
Chicago BOT SRW
Kansas City BOT HRW
Minneapolis MGE NS/DNS
Chicago BOT Corn
Chicago BOT Soybeans
Legend:
Cash:
Convert:
Grey positions not quoted on specific exchange
MAR (H15)
$/MT
186.20
199.42
206.22
149.03
353.10
MAR (H15)
$/bu
5.0275
5.4025
5.5675
3.7000
9.6100
week
change MAY (K15)
$/bu
$/bu
(0.2725)
5.0675
(0.2375)
5.4275
(0.1925)
5.6125
(0.1675)
3.7850
(0.1175)
9.6775
week
change JUL (N15)
$/bu
$/bu
(0.2600)
5.1150
(0.2625)
5.4625
(0.2125)
5.6900
(0.1675)
3.8600
(0.1175)
9.7275
week
change JUL (N15)
$/bu
$/bu
(0.2500)
5.1150
(0.2600)
5.4625
(0.2175)
5.6900
(0.1675)
3.8600
(0.1250)
9.7275
week
change SEP (U15)
$/bu
$/bu
(0.2500)
5.1975
(0.2600)
5.5775
(0.2175)
5.7700
(0.1675)
3.9300
(0.1250)
9.5675
week
week
change NOV (X15) change DEC (Z15)
$/bu
$/bu
$/bu
$/bu
(0.2450)
5.3225
(0.2600)
5.7225
(0.2150)
5.8775
(0.1625)
4.0075
(0.1425)
9.4575
(0.1400)
M = Minneapolis Grain Exchange; K = Kansas City Board of Trade; C = Chicago Board of Trade;
$ = cash price quote; N/A = quote not available; closed = Great Lakes are closed to vessels for winter; ¢/bu = cents per bushel;
Futures Contract Month: H = March; K = May; N = July; U = September; Z = December
NS/DNS=Northern Spring/Dark Northern Spring (subclasses of Hard Red Spring); HRW=Hard Red Winter; SRW=Soft Red Winter; SW=Soft White; WW=Western White (White Club & Soft White)
F.O.B.= "Free on board" - Seller is responsible for placing grain at the end of the loading spout. Buyer is responsible for providing the ocean vessel and for all other costs after the grain is delivered on board.
Basis: The difference between the cash price and futures month for specific quality, shipping period and geographical location.
Durum, SW and WW are quoted in dollars per bushel ($/bu.) rather than basis for each contract month.
To compute cash price, add basis level and current futures to get price per bushel. Multiply by 36.743 to get price per metric ton.
Example: Basis = 70 and Future Price = $9.00, the price per bushel is $9.00 + .70 = $9.70/bu. Price per metric ton is $9.70 * 36.743 = $356/MT.
All prices are based upon U.S. number two grade or better as certified by the Federal Grain Inspection Service (FGIS).
week
change JAN (F16)
$/bu
$/bu
(0.2350)
(0.2575)
(0.2025)
(0.1650)
9.5150
week
change
$/bu
(0.1400)
U.S. Wheat Associates
Weekly Price Report (page 2)
U.S. dollars/metric ton
Handymax
40-46 TMT
15
40
Panamax
54+ TMT
31
38
35
50
40
39
30
31
70
65
60
65
39
42
25
32
52
36
30
29
30
35
28
28
28
Freight Index**
Week Ending
1/23/2015
1/16/2015
1/9/2015
1/2/2015
12/26/2014
12/19/2014
12/12/2014
12/5/2014
11/28/2014
11/21/2014
11/14/2014
11/7/2014
10/31/2014
10/24/2014
10/16/2014
10/10/2014
10/3/2014
9/26/2014
9/19/2014
9/12/2014
9/5/2014
8/29/2014
8/22/2014
8/15/2014
8/8/2014
8/1/2014
7/25/2014
7/18/2014
7/11/2014
41705
Note: Rates for freight leaving the Great Lakes are quoted for 18,000 MT "Salties."
General
Index
358.2
363.0
372.8
382.1
381 9
381.9
384.3
409.3
416.8
422.6
415.5
431.0
436.1
433.4
422.5
415.5
422.7
425.3
425.5
428.8
425 3
425.3
433.0
430.6
427.6
420.1
418.9
415.9
415.2
418.0
426.0
451.1
Grain Freight
Index
441.9
445.8
458.4
468.4
468 4
468.4
471.2
501.4
505.9
509.2
493.6
512.6
516.1
514.8
511.0
502.9
511.7
514.7
511.5
514.8
508 5
508.5
517.9
517.1
513.3
507.9
506.8
505.3
505.1
508.1
511.4
Number of
Fixtures
552
571
507
204
250
453
555
476
453
634
484
534
613
585
608
523
517
469
530
480
474
424
487
499
503
470
556
543
543
540.4
Ocean Freight Rate Indices
600
550
500
450
400
350
300
Jan-14
Canada
1.255
1.236
1.195
1.182
1.115
1.067
12.58%
17.68%
Egypt
7.556
7.397
7.173
7.174
6.980
5.505
8.25%
37.27%
EU
0.885
0.866
0.854
0.847
0.732
0.718
20.90%
23.36%
Japan
117.925
117.975
117.189
119.637
102.826
90.172
14.68%
30.78%
Russia
Sep-14
Nov-14
General
50
40
30
20
10
0
Jan-14
Mar-14
May-14
Jul-14
Sep-14
Gulf origin
Nov-14
Jan-15
PNW origin
Selected Exchange Rates
480
68.964
65.004
65.069
61.834
34.907
30.370
97.56%
127.08%
Jul-14
Egyptian Freight Estimates
60
euro/US dollar xx
Brazil
2.592
6.591
2.641
2.684
2.434
1.873
6.49%
38.39%
May-14
Grain
Sources: *Trade representatives and recent shipments, **Maritime Research, Inc., ***Nominal Major Currencies, Federal Reserve Board
Summary of Foreign Currency Exchange Rates (versus $1 U.S. dollar)
Week Ending
Index***
Argentina
Australia
1/30/15
N/A
8.636
1.277
1/23/15
113.37
8.619
1.236
1/16/15
112.27
8.600
1.219
1/9/15
112.08
8.583
1.234
1/30/14
103.49
8.018
1.140
1/30/10
102.79
3.825
1.122
1 year change
9.88
7.70%
12.10%
5 year change
10.58
125.75%
13.88%
Mar-14
0.85
1.30
0.80
1.25
1.20
0.75
1.15
0.70
1.10
0 65
0.65
1.05
0.60
1.00
0.55
0.95
0.50
Jan-14 Mar-14 May-14
euro
0.90
Jul-14
Sep-14
Nov-14
Canadian dollar
The weekly prices as reported by U.S. Wheat Associates are compiled through research from numerous market sources, including U.S. wheat exporters of all classes from various U.S. ports. The prices reported are representative of the value
of number two grade and the proteins indicated. They are not intended to represent offers nor should importers of U.S. wheat rely upon them as such. Additional factors may alter these prices significantly. These factors may include:
(1) payment terms (differing from cash against documents which are the terms used in the U.S. Wheat Associates price report); (2) various quality factors, and method of quality certification; (3) loading terms (USW prices represent
Free on Board and do not include loading rate guarantees, stevedoring costs or other elevator tariff charges); (4) different delivery periods than indicated in monthly prices reported by U. S. Wheat Associates.
U.S. Wheat Associates recommends regular contact with exporters of U.S. wheat in order to receive offers representative of your requirements. These contracts would allow importers to review contract terms and better understand the
U.S. grading system, role and function of the Federal Grain Inspection Service (FGIS).
Contact: For questions, please contact Casey Chumrau at (703) 650-0241 or [email protected].
dian/US dollar
Canad
Handy
25-30 TMT
16
37
40
16
30
49
34
33
$/m
metric ton
January 30, 2015
Ocean Freight Rate Estimates by Origin*
Export
Import
Region
Region
US Gulf
Mexico (Veracruz)
W. South America (Peru/Ecu)
S. South America (Chile)
N. South America (Colombia)
E South America (Brazil)
E.
West Africa (Nigeria)
East Mediterranean (Italy)
West Mediterranean (Morocco)
Middle East (Egypt)
Japan
Mid Atlantic
N. South America (Venezuela)
West Africa (Nigeria)
Middle East (Egypt)
St. Lawrence N. South America (Venezuela)
Europe/Rotterdam
Middle East (Egypt)
Great Lakes
East Mediterranean (Italy)
West Mediterranean (Spain)
Rotterdam
West Africa (Morocco/Algeria)
PNW
W. South America (Peru/Ecu)
S. South America (Chile)
N. South America (Colombia)
Middle East (Egypt)
East Africa (Djibouti/Mombasa)
South Asia (Mal/Indon/Phil/Sing)
Taiwan
South Korea
Japan
Nearby Futures Contract Prices
HRW Basis at PNW and Gulf Ports
(ordinary protein)
10
240
220
9
200
cents/bushel XXl
$/bushel
8
7
180
160
140
120
100
6
80
60
5
40
20
0
Jan-14
4
Jan-14
Mar-14
May-14
KBOT
Jul-14
Sep-14
MGE
Nov-14
Jan-15
Mar-14
May-14
Jul-14
Sep-14
PNW
CBOT
Nov-14
Jan-15
Gulf
HRW Protein Premiums - PNW
HRS Basis at Various Ports
260
500
240
220
400
200
350
180
cents/bushe
el XX
cents/bushel XX
X
450
300
250
200
160
140
120
100
80
150
60
100
40
50
0
Jan-14
20
Mar-14
May-14
PNW HRS 14
Nov-14
0
Jan-14
Jan-15
Mar-14
May-14
Jul-14
ords
G.L. HRS 14
Sep-14
Nov-14
Jan-15
Nov-14
Jan-15
12% protein
HRW Cash Prices at the Gulf
370
12
350
10
330
8
310
$/bushel
$/metric ton
Weekly Price Report (page 3)
Sep-14
SW and SRW Nearby Cash Prices
January 30, 2015
U.S. Wh
heat Associate
es
Gulf HRS 14
Jul-14
290
270
6
4
250
50
2
230
210
Dec-13
0
Feb-14
Apr-14
PNW SW
Jun-14
Aug-14
Oct-14
Dec-14
Gulf SRW
Custom graphs of historic nearby cash prices may be accessed at:
http://www.uswheat.org/priceReports/nearbyCash
http://www uswheat org/priceReports/nearbyCash
Jan-14
Mar-14
May-14
Jul-14
KCBOT Futures
Sep-14
Gulf HRW basis
Basis and cash prices for different delivery months are also available at:
http://www.uswheat.org/priceReports/deliverymonth
http://www
uswheat org/priceReports/deliverymonth
U.S. Wheat Associates
Weekly Price Report
Highlights:
January 30, 2015
Daily Settlement Prices (MAR15)
* Wheat futures were pushed down early this week to a three month low due to continued news about plentiful global supplies, beneficial rains across the US Plains and Midwestern wheat belts, and continued strenghtening of the US Dollar versus competitors currencies. However, the market did find strength in the latter half of the week with stronger than expected exports and technical buying rallying the market from Wednesday lows. Overall the market closed down. Chicago dropped 27 cents to $5.03 per bushel, Kansas City dropped 24 cents to 5.40 per bushel, and Minneapolis dropped 19 cents to $5.57 per bushel. Chicago corn futures dropped 17 cents to $3.87 on large global supplies and weak exports. Soybeans followed suit, dropping 12 cents to $9.73, the market weakening as China shifts to cheaper South American supplies. 6.4
$/bu
6
5.6
5.2
* Current HRS price indications are for Northern Spring only. Premiums for Dark Northern Spring will 4.8
1/26/15
1/27/15
CBOT
1/28/15
KCBT
1/29/15
1/30/15
MGEX
*
vary. SRW indications are for a minimum falling number of 250. Higher minimum specifications will carry a premium.
The HRS market continues to be plagued by low DHV levels. Trade sources indicate that a minimum DHV level of 65% can carry a premium of around $1.25 per bushel over normal NS/DNS prices. * Officials in both India and Pakistan announced plans to export wheat I order to clear government storage capacity before the upcoming harvests. Both countries hope to capitalize on the recent export curbs in both Russia and Ukraine. Wheat Futures Forward Curve
6.00
* Ocean freight rates continue to plunge downward on weak demand for ocean freight, especially out of China, and an oversupply of ships on the market. The Baltic Dry Index hit its lowest level since 1986 this week. 5.60
$/bu
* According to the USDA's Export Sales Report, weekly sales of 544.4 TMT for delivery in the 2014/2015 marketing year were above trade expectations of 250 to 450 TMT. Total known outstanding sales and accumulated exports of all classes of wheat, through January 22, 2015 were 19.9 MMT, 24% lower than last year's year‐to‐date total of 26.1 MMT. HRW export sales were down 37%, SRW export sales down 53%, HRS export sales up 22%, SW export sales down 4%, and durum export sales up 21%. 5.20
* The Baltic Panamax Index closed this week at 508, down sharply from last week at 685. 4.80
DEC 14
MAR 15
CBOT
KCBT
MAY 15
MGEX
JUL 15
* The US Dollar Index closed this week at 94.84, down slightly from last week at 94.99.

© Copyright 2026