
Spectral Characterisation of Spinel
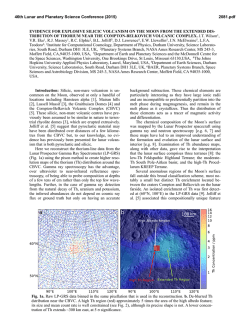
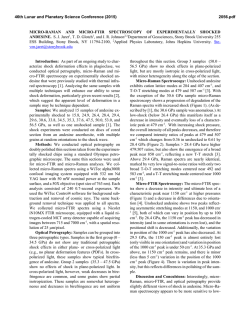
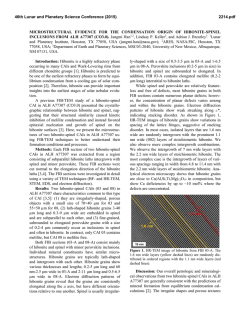
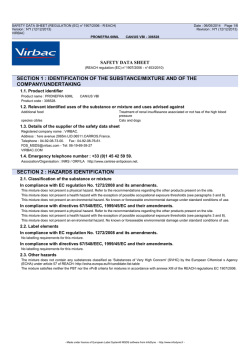
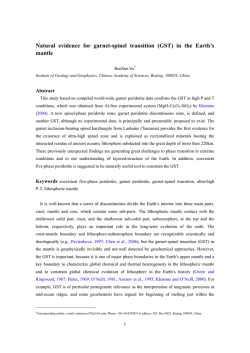
46th Lunar and Planetary Science Conference (2015) 1750.pdf SPECTRAL CHARACTERISATION OF SPINEL-ANORTHITE MIXTURES IN THE THERMAL INFRARED C. M. Marriner1, K. L. Donaldson Hanna1, N. E, Bowles1, B. T. Greenhagen2, C. R. M. Jackson3, L. Cheek4, S. W. Parman5, C. M. Pieters5. 1Atmospheric, Oceanic & Planetary Physics, University of Oxford, Clarendon Laboratory, Oxford, UK ([email protected]), 2Johns Hopkins University Applied Physics Laboratory, Laurel, MD, USA, 3Geophysical Laboratory, Carnegie Institute of Science, Washington DC, USA, 4Dept. of Earth and Environment, Boston University, Boston, MA, USA , 5Dept. of Earth, Environmental, and Planetary Sciences, Brown University, Providence, RI, USA. . Introduction: The Moon Mineralogy Mapper (M3), onboard the Chandrayaan-1 spacecraft, identified a new lunar rock type in small exposures across the lunar surface [e.g. 1-5] termed a “pink spinel anorthosite” (PSA) [1,4]. The PSA exposures are identified with feldspathic material, including identifications of pure crystalline plagioclase units nearby, with no observable mafic silicate signature in their spectra [4]. This is a distinguishing feature, as spinel-bearing samples recovered from the Moon (during the Apollo missions [e.g. 6], and by lunar meteorite samples found on Earth [e.g. 7]) are associated with significant (>20 vol%) proportions of olivine ± pyroxene. Due to the non-linear nature of spectral mixing in the NIR [8], it is difficult to determine the modes of minerals in the lunar PSA exposures. Unlike the NIR, the more linear nature of mixing across thermal infrared (TIR) wavelengths may allow for a more robust estimation of mineral modes and compositions [e.g. 8]. However, little is known about the spectroscopic behaviour of spinel, or the resultant mixture with plagioclase in these regions at TIR wavelengths for fine particle size fractions (e.g <25 m), more typical of particle sizes in the lunar regolith. Therefore, new laboratory measurements, especially acquired under simulated lunar environment (SLE) conditions, are needed before being compared to remote sensing data. One source of remote sensing data in the TIR is the Diviner Lunar Radiometer Experiment (Diviner) onboard NASA’s Lunar Reconnaissance Orbiter (LRO). Diviner is a 9 channel infrared mapping radiometer that includes three channels designed to measure composition by mapping the position of a diagnostic spectral feature, the Christiansen Feature (CF) [e.g. 9] near ~8 m. The CF is an emissivity maximum that is indicative of mineralogy and composition [e.g. 10]. Combining laboratory and remote sensing observations will help us to understand the petrogenesis of PSA. In this study, we analyse the spectral effects of varying spinel and plagioclase abundances by producing mixtures of the two end members with the emphasis on the behaviour of particle size fractions <25 m. These will then be measured in the Simulated Lunar Environment Chamber (SLEC) [11] in the University of Oxford’s Planetary Spectroscopy Facility (PSF). Laboratory spectra will be re-sampled to Diviner’s three ‘8 µm’ channels, and compared against remote sensing observations of PSA locations. Methodology: Following the work by [12] showing synthetic spinels with <5 wt% iron have a prominent 2 µm absorption band and lack a 1 µm absorption band as observed in the M3 spectra [e.g. 4], Sri Lankan spinel gemstones were chosen as an analogue material. The powdered samples were then prepared as in [13]. For the plagioclase end member, Miyake-jima anorthite megacrysts were selected because they are crystalline in nature and their highly calcic (>An90 [14]) composition is similar to plagioclase found in lunar anorthosites [15]. The samples were crushed and sieved to particle sizes <25 µm because in the NIR the spectral signature of lunar soils are dominated by the finest particle size fractions [16]. The fine particulate end members were each weighed out before being combined by weight percent (wt%) using a microbalance and assuming a 5 g SLEC sample cup capacity. Hence, for this initial study the 50/50 wt% mixture contains 2.50 ± 0.05 g of each end member. The end members were combined in a 16 mL glass vial and homogenized by tumbling and rotating for 15 minutes per sample. The end members and mixture were placed into aluminium sample cups, and measured from 400-2000 cm-1 (5-25 µm) in a Bruker IFS 66v Fourier Transform Infrared (FTIR) spectrometer using a Specac™ Diffuse Reflectance FTIR Accessory, a KBr beamsplitter and a deuterated triglycine sulfate (DTGS) detector, at the University of Oxford’s PSF. A coarse grained KBr powder was used as a spectrally ‘flat’ (to ~1% [17]) reference, and thus the diffuse reflectance data presented here are not absolute. The spectra were measured at 4 cm-1 resolution, with 2 cm-1 spectral sampling. The approximate position of the CF was located by finding the reflectance minimum between 1200 and 1300 cm-1 for anorthite and 900 and 1100 cm-1 for spinel, and assuming an uncertainty at the spectral resolution of 4 cm-1 in the CF position. Due to the non-linear sampling in wavelength space, for indication this gives an approximate error of ±0.03 µm at 8 µm. Results: For easier comparison to spectra measured in thermal emission, the spectra of the two end members and the 50/50 wt% physical mixture are presented as 1-Reflectance (Figure 1). The CF position of the 46th Lunar and Planetary Science Conference (2015) pure anorthite sample is 1242 ± 4 cm-1 (~8.05 µm) whereas the spinel has a CF position at a much lower wavenumber (longer wavelength), 999 ± 4 cm-1 (10.01 µm). As an intitial test, a forward modelled linear mixture was calculated (Figure 2) from the two end member spectra (red and green in Figure 1) by multiplying each by 0.5 and summing. Figure 1: 1-Reflectance of laboratory measured <25 µm Mg-spinel (red), anorthite (green), and 50/50 wt% spinel and anorthite (SpAn) physical mixture (black). CF = Christiansen Feature. Figure 2: (A) 1-Reflectance of a physical mixture of spinel and anorthite (SpAn) (same as Figure 1 black spectrum) compared to the 50/50 wt% spinel and anorthite linear model. (B) Spectrum of the residual error (physical mixture spectrum minus modelled spectrum). Discussion: Comparing the physical mixture spectrum (Figure 1) with the two end member spectra reveals regions of the spectrum which are: 1) anorthitedominated; 1000-1400 cm-1 (7.14-10 µm), 2) have a broad band, combining both end members, centered on ~868 cm-1 (11.52 µm), and 3) spinel-dominated; 400800 cm-1 (25-12.5 µm). Differences between the physical mixture spectrum and the modelled spectrum as seen in the residual error spectrum (Figure 2) is ≤ 2% across the spectral range, except at ~858 ± 4 cm-1 and 1323 ± 4 cm-1 where the error approaches ~6% and ~4%, respectively. These deviations require further investigation but could be attributed to: 1) at fine 1750.pdf particle sizes, the transparent regions of the spectrum are increasingly dominated by volume scattering [18]. This alters the scattering efficiency making the mixing behaviour less linear [8]. 2) volume mixing effects due to the different densities of the two end members. In wt% the ratio of spinel:anorthite is 1.32:1, so calculated for volume, based on 2.5 g of each sample the spinel (3.64 g cm-3) will only occupy 43% of the mixture volume because it has a higher density than the anorthite (2.76 g cm-3). This volume/mass mixing effect will be investigated further. Future Work: The mixtures outlined here, as well as further mixtures of varying spinel-anorthite abundances and spinel composition, will be prepared and measured across TIR wavelengths (400-2000 cm-1 or 5-25 µm) in the SLEC at the University of Oxford’s PSF. Measuring under SLE conditions is essential because measurements made under ambient conditions (and those converted from diffuse reflectance) do not take into account the thermal gradient present at the near-surface environment on the Moon. This thermal gradient has been shown to have significant effects on the TIR spectra of minerals and lunar soils [e.g. 19,20], including shifting the CF position to higher wavenumbers and increasing the spectral contrast of the CF. The TIR mixture and end member spectra will then be compared to Diviner observations of PSA exposures, which will help in providing initial estimates of the abundance of anorthite as well as the spinel composition in these spinel-rich regions. References: [1] Pieters C. M. et al. (2011) JGR, doi:10.1029/2010JE003727. [2] Dhingra D. et al. (2011) GRL, doi:10.1029/2011GL047314 [3] Lal D. et al. (2012) JESS, 847-853 [4] Pieters C. M. et al. (2013) LPS XXXXIII, Abstract #2545. [5] Pieters C. M. et al. (2014) Am. Min., 1893-1910. [6] Prinz M., et al. (1973) Science, 74-76. [7] Gross J. and Treiman A. H (2011) JGR, doi:10.1029/2011JE003858 [8] Hapke B. (2012) ISBN: 9780521883498 [9] Greenhagen B. T. et al. (2010) Science, 329, doi:10.1126/science.1192196. [10] Logan L. M., et al. (1973) JGR, 78, 4983-5003 [11] Thomas I. R. et al. (2012) Rev. Sci. Instrum., 83(12), 124502. [12] Jackson C. R. M., et al. (2014) Am. Min., 99, 1821-1833. [13] Marriner C. M., et al. (2014) LPS XXXXIV, 1806. [14] Amma-Miyasaka, M., and Nakagawa M. (2002) JVGR, 117, 263-283. [15] Brydges T. F. V., et al. (2015) LPS XXXXVI, Abstract #1251. [16] Pieters, C. M., et al. (1993) JGR, 98, 20,817-20,824. [17] http://www.crystran.co.uk/opticalmaterials/potassium-bromide-kbr [18] Salisbury J. W. and Walter L. S. (1989) JGR, 94, 9192-9202. [19] Henderson B. G. and Jakosky B. M. (1994) JGR, 99, 19,063-19,073. [20] Donaldson Hanna K. H., et al. (2014) LPS XXXXV, Abstract #1777.
© Copyright 2026