
The Quest for a Diurnal Effect in Lunar Hydrogen Abundance
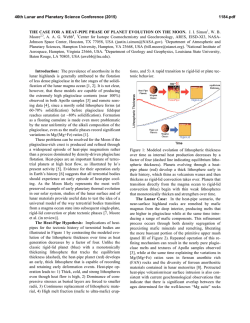
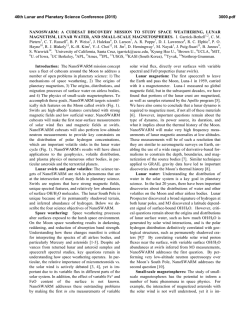
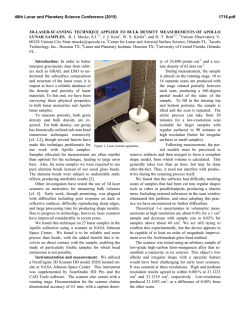
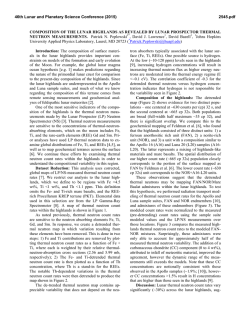
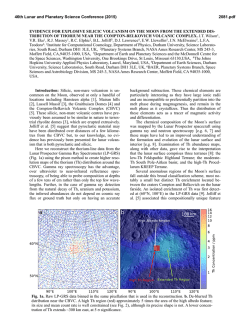
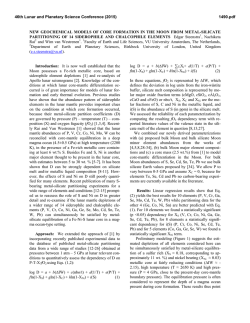
46th Lunar and Planetary Science Conference (2015)
1786.pdf
Lu´ıs F.A. Teodoro1 ,
David J. Lawrence , Richard C. Elphic , Vincent R. Eke , William C. Feldman , Sylvestre Maurice6 ,
Matthew Siegler5 and David Paige8 1 BAER, NASA Ames Research Center, Moffett Field, CA 94035-1000
([email protected]); 3 Planetary Systems Branch, Space Sciences and Astrobiology Division, MS
245-3, NASA Ames Research Center, Moffett Field, CA 94035-1000, USA; 4 Institute for Computational Cosmology, Department of Physics, Durham University, Science Laboratories, South Road, Durham DH1 3LE,
UK; 5 Planetary Science Institute, 1700 E. Fort Lowell, Suite 106, Tucson, AZ, 85719, USA; 6 Universit´e Paul
Sabatier, Centre d’Etude Spatiale des Rayonnements, 9 avenue Colonel Roche, B.P. 44346 Toulouse, France;
7
Department of Earth, Planetary, and Space Sciences, University of California, Los Angeles, CA 90095, USA
THE QUEST FOR A DIURNAL EFFECT IN LUNAR HYDROGEN ABUNDANCE
2
3
Introduction: The mapping of hydrogen in
the near surface of the Moon has been one of
the focal points of the human exploration of the
Moon. Neutron spectroscopy has been central to
this endeavor and allows one to probe the top few
decimeters [1].
Here, we present an updated study of the
daily variations of the Lunar Prospector epithermal neutron spectrometer count rates to inquire
if such potential variations are sensitive to daily
variations in H concentrations. This study is
prompted, in part, by a report of time variable
concentrations of (top tens of microns) H2 O/OH
that have been observed with spectral reflectance
data [2]. If such time variable H concentrations
extend to macroscopic depths of multiple mm to
cm then such variations could in principle be observed with orbital neutron data. Preliminary
analysis of data from the Lunar Exploration Neutron Detector has shown a diurnal count rate variation, which has been interpreted as daily variations in H concentrations [3]. Such extraordinary findings, if confirmed, could lead to deep
consequences on our understanding of the hydrogen distribution at the lunar surface. Here, we
show that the Lunar Prospector Neutron Spectrometer (LP-NS) epithermal neutron count rates
also exhibit diurnal variations, but these variations are correlated with variations in instrumental and sub-surface lunar temperatures.
In this work we use the epithermal neutron
dataset gathered by the LP-NS, which is in
the public domain at the Planetary Data System
(PDS).1 We also use temperature measurements
of the lunar surface collected by the Diviner
Lunar Radiometer on Lunar Reconnaissance
Orbiter. These measurements are also available
at PDS.2 We will also use thermal models that
have been constrained by the above thermal
measurements [4].
1 http://pds-geosciences.wustl.edu/missions/
lunarp/
2 http://pds-geosciences.wustl.edu/missions/
lro/diviner.htm
4
5
Figure 1: Count rate versus LPNS sensor temperature scatter diagram. Red line shows the linear
fit to the data.
To quantify the variability of the epithermal
count rate, cr(x, t), we introduce the random over
count rate variable, δcr(x, t)/cr:
δcr(x, t)/cr = cr(x, t)/crf (x, t) − 1
(1)
where crf (x, t) is the fiducial count rate maps at
6pm (local time), x is the location on the lunar
surface and t denotes local time. To quantify
cr(x, t) we use the time-series defined as follows:
all the instants of the overall LP-NS time-series
within the latitude range |latitude| < 55◦ and low
altitude (average ∼ 30 km) portion of the mission.
In Figure 1 we show the LP-NS count rate versus sensor temperature. The top panel of Figure 2
shows the count rate averaged over the latitude
domain for uncorrected (green) and sensor temperature corrected (violet) data. The sensor temperature corrections alone reduce the over count
variations from ∼ 2.73% down to ∼ 1.60%.
Little et al (2003) [5] and Lawrence et al (2006)
[6] used a Monte Carlo approach to study neutron
transport in typical lunar soils and showed that
both thermal and epithermal neutron count rates
are dependent on temperature.
In this work we consider a variety of subsurface temperatures as a function of both lati-
46th Lunar and Planetary Science Conference (2015)
tude and local time, as constrained by the Diviner
measurements.
To take into account the effects of the lunar subsurface temperature we consider an “averagesoil” made up of equal fractions of Luna 16, 20,
24, Apollo 11 and FAN (see [6] for further details
regarding the lunar soils). In the upper panel of
Figure 2 we show the averaged over count rate corrected for sensor temperature and surface temperature effects (black). In the lower panel of the
same figure we present the over count rate as corrected for sub-surface temperatures at different
depths. In Table 1 we present the peak-to-peak
variation of the over count rate for different subsurface temperature corrections. The minimum
variation occurs for a sub-surface depth of 20 cm.
Conclusions: LP-NS epithermal neutron
count rates also show diurnal variations,
however, these variations are correlated with
variations in instrumental temperature and with
the sub-surface temperatures as constrained by
the Diviner measurements. These findings suggest that rather than reflecting diurnal changes in
hydrogen, the temporal fluctuations in the count
rates are due to residual systematic effects in the
data reduction which have not been taken into
account in previous studies [7].
After corrections for instrumental and subsurface temperature, the remaining diurnal count
rate variations are ∼ 0.5%.
An additional result is that we have made the
first measurement of the effective leakage depth
for epithermal neutrons of 10 - 20 cm. When these
depths are used for sub-surface temperature correction, they lead to the lowest diurnal variations
in the epithermal neutron data.
References:
[1] W. C. Feldman, et al. (1998)
Science 281:1496
doi:10.1126/science.281.5382.1496. [2] J. M.
Sunshine, et al. (2009) Science 326:565
doi:10.1126/science.1179788.
[3] T. A.
Livengood, et al. (2014) in Lunar and Planetary Science
Conference vol. 45 of Lunar and Planetary Science
Conference 1507. [4] M. A. Siegler, et al. (2011) Journal of
Geophysical Research (Planets) 116:E03010
doi:10.1029/2010JE003652. [5] R. C. Little, et al.
(2003) Journal of Geophysical Research (Planets) 108:5046
doi:10.1029/2001JE001497. [6] D. J. Lawrence,
et al. (2006) Journal of Geophysical Research (Planets)
111(E10):8001 doi:10.1029/2005JE002637.
[7] S. Maurice, et al. (2004) Journal of Geophysical
Research (Planets) 109:E07S04
doi:10.1029/2003JE002208.
1786.pdf
Figure 2: Upper panel Count rate versus local time. Sensor and Surface Temperature corrected (black), Sensor Temperature corrected (violet) and Uncorrected Low altitude 2 data (green)
Lower panel Subsurface temperature corrected
count rate vs local time for different depths. The
color scheme is shown in the panel.
LPNS
sub-dataset
hδcrimax − hδcrimin
×10−2
Low altitude
2.73
Temperature
Sensor corrected
1.60
Depth 0 cm
Depth 1 cm
Depth 2 cm
Depth 3 cm
Depth 4 cm
Depth 5 cm
Depth 10 cm
Depth 20 cm
Depth 30 cm
0.92
0.92
0.98
1.08
1.08
0.98
0.57
0.49
0.92
Table 1: Peak-to-peak variation of the average
count rate in two hour local time bins for the different time series considered in this work.
© Copyright 2026