
OPPENHEIMER CRATER FLOOR DEPOSITS: COMPOSITIONAL
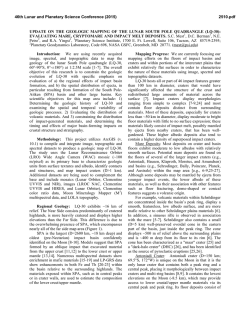
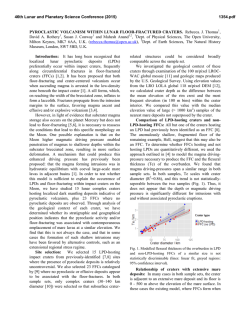
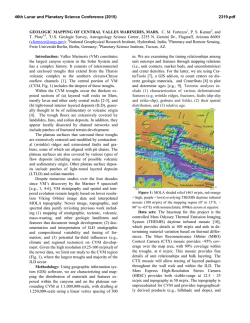
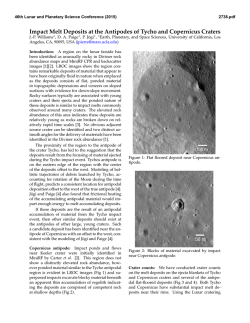
46th Lunar and Planetary Science Conference (2015)
2059.pdf
OPPENHEIMER CRATER FLOOR DEPOSITS: COMPOSITIONAL ANALYSES WITH KAGUYA
SPECTRAL PROFILER DATA. L.R. Gaddis1, J. Laura1,2, B. Horgan3, B.R. Hawke4, and T. Giguere5.
1
Astrogeology Science Center, U.S. Geological Survey, Flagstaff, AZ; 2Department of Geography, Arizona State
University, Tempe, AZ; 3Dept of Earth, Atmospheric, and Planetary Sciences, Purdue University, West Lafayette,
IN; 4Univ. Hawaii, Honolulu, HI; 5Intergraph Corp., P.O. Box 75330, Kapolei, HI. ([email protected]).
Introduction: Calibrated SELENE “Kaguya”
Spectral Profiler (SP) data are now available for the
full spectral range of ~0.5-2.5 μm [1-3]. The SP was a
visible-near infrared (VIS-NIR) spectrometer with an
observational footprint of ~500 m that acquired data
for the Moon from 2007 to 2009. Using these data, we
analyzed the compositions of pyroclastic units in Oppenheimer crater (35.2°S, 166.3°W, 208 km dia., Figure 1). The goal is to compare and extend compositional data for low-albedo pyroclastic deposits in the
western and southern floor deposits to those of the
southern floor studied [4] with data from Moon Mineralogy Mapper (M3, 0.4-3 μm, 86 bands, [5]). M3 coverage does not extend to the western edge of Oppenheimer; this analysis adds data for the deposits of
Oppenheimer U crater (northwest floor) and in the
southwest (SW). Previous studies [6] were unable to
address the important 2.0 μm spectral absorption bands
(diagnostic of the presence or absence of minerals such
as pyroxene and olivine, and volcanic glass) because
data such as those from SP were not yet calibrated.
Small pyroclastic deposits (<2000 km2) such as
those at Pre-Nectarian-aged Oppenheimer crater are
associated with vents resembling shallow, non-impact
craters or irregular depressions [e.g., 7]. More than 100
lunar pyroclastic deposits have been identified and
they are of interest partly because they are volatile- and
metallic-element (e.g., S, Fe, Ti) enriched remnants of
ancient lunar volcanic eruptions [8, 9]. Their compositions and distributions provide information on the early
lunar interior [10, 11] and the distribution of possible
resources [12]. Previously unrecognized small pyroclastic deposits continue to be discovered [13, 14] and
studied [15, 16] with new data such as those from M3
and the Lunar Reconnaissance Orbiter Cameras (Narrow Angle Cameras, 0.5 to 1.0 m/pixel [17]).
Oppenheimer Pyroclastics: Fifteen pyroclastic
deposits were identified in the floor of Oppenheimer
crater (4.04 Ga; [14, 18, 19]), and these deposits are
associated with vents located along fractures (Figure
1) and in three Imbrian-aged craters in the floor. The
deposits are ~200-1500 km2 in size [6], and were likely
emplaced by explosive, Vulcanian-style eruptions [20].
Analyses of Clementine data for Oppenheimer pyroclastics suggested that their compositions were dominated by mafic minerals (e.g., pyroxene) in fragmented
basalts [21].
Figure 1. LRO Wide Angle Camera mosaic [17] of Oppenheimer
crater (208 km diam.). Up to 15 pyroclastic deposits have been identified in the crater [14]. Green box (inset) shows M3 data coverage
with gap between west and east areas.
Previous Work: Previous results with M3 data [4]
used band center and asymmetry of the 1- and 2micron bands to map lithology at Oppenheimer, focusing on identifying pyroxenes, glass, and mixtures. Results indicated that crater floor spectra have band centers of 0.91-0.94 and 2.05-2.10 μm, consistent with
low-calcium pyroxene (LCP, orthopyroxene) mixed
with minor high-calcium pyroxene (HCP, clinopyroxene). Pyroclastic deposit spectra for the southern floor
units [including the south-central (S), south-southeast
(SSE), and southeast (SE) units] have band centers of
0.95-1.1 and 1.95-2.10 μm, consistent with an LCPglass mixture. The larger S deposit had higher glass
concentrations than the SSE and SE deposits. Bennett
et al. [4] suggested that olivine (which does not have a
2 μm band and has a broad, highly asymmetric 1 μm
band) is not present in any of the pyroclastics because
of the shift to shorter wavelengths of the 2 μm band
(without a decrease in band depth) and the low asymmetries of the 1 μm band in these deposits. More recent analysis using Multiband Imager [22] and SP data
[14] for the 1 μm region only indicated that the asymmetric shape and band center near 0.9 µm indicates a
likely mixture of LCP+glass, with proportions varying
from site to site.
Results: Calibrated SP spectra now address both 1
and 2 μm bands (Figure 2) and show that crater floor
46th Lunar and Planetary Science Conference (2015)
spectra have a ~symmetric band centered at ~0.95 μm
and broader, long-wavelength band centered beyond 2
μm, consistent with LCP mixed with HCP. This composition of the floor of Oppenheimer crater is consistent with the general iron enhancement observed
throughout the basin, likely due to the existence of
LCP-bearing materials (i.e., norite) across the South
Pole–Aitken basin interior [23]. Pyroclastic units
(mantles of Oppenheimer U, SW, S and N) have
broader, asymmetrical bands centered at ~1.0 μm or
longer, indicating the presence of iron-rich volcanic
glass. The SW mantle has the deepest 1 μm band, suggesting that it has a relatively large fraction of this
glass component. The other deposits (Oppenheimer U,
N, S) have shallower, broad 1-μm bands and these may
be mixtures of glass and LCP. The presence of 2-μm
bands in all spectra indicates an absence of olivine in
Oppenheimer pyroclastic deposits. The broad, asymmetrical 2-μm bands centered beyond 2 μm in N and S
mantles suggests a mixture of HCP, LCP and glass
which may be consistent with the relative thinness of
these deposits and the possibility that crater floor material is contributing to the spectra. The more symmetrical 2-μm bands centered at 2 μm are indicative of a
dominant mixture of LCP and volcanic glass for the
Oppenheimer U and SW mantles.
Summary: Calibrated SP spectra for Oppenheimer
volcanic deposits indicate that they are composed of a
2059.pdf
mixture of low-calcium pyroxene and volcanic glass.
No olivine is observed in these deposits. These results
are consistent with our earlier work [6] and with more
recent results by Jawin et al. using M3 data [16].
Acknowledgements: We thank the JAXA SELENE/Kaguya MI instrument team and the mission data
archive for providing the data used here.
References: [1] Haruyama et al., 2008, Adv. Sp.
Res. 42, 310-316. [2] Yamamoto et al., 2011, IEEE
Trans. Geosci. Rem. Sensing 49, 4660-4676. [3]
Yamamoto et al., 2014, IEEE Trans. Geosci. Rem.
Sensing 52, 6882-6898. [4] Bennett et al., 2013, NLSF.
[5] Pieters et al., 2011, JGR, 116, 1-31. [6] Gaddis et
al., 2014, 45th LPSC, abs. #. [7] Gaddis et al., 2003,
Icarus 161, 262. [8] Heiken et al. 1974, GCA 38, 1703.
[9] Delano, 1986, JGR 91, D201. [10] Shearer et al.,
2006, RMG 60, 365. [11] Duke et al., 2006, RMG 60,
597. [12] Hawke et al., 1989, PLPSC 19th, 255. [13]
Gustafson et al., 2012, JGR 117, E00H25, 1-21. [14]
Gaddis et al., 2013, LPS, #2262. [15] Besse et al., JGR
119, #2, 355-372. [16] Jawin et al., this meeting. [17]
Robinson et al., 2010, Space Sci. Rev. 150, 81-124.
[18] Rosanova et al., 1998, LPS XXIX, #1710. [19]
Hiesinger et al., 2012, GSA #30953-212430. [20] Head
et al., 2000, LPS XXXI, #1280. [21] Petro et al., 2001,
LPS XXXII, #1953. [22] Ohtake et al., 2010, Space
Sci. Rev. 154, 57-77. [23] Pieters et al., 2001, JGRP,
106, 28001-28022.
Figure 2. SP spectra (continuum-removed, offset) of Oppenheimer crater units, with MI base image at left showing sites of spectrum extraction
(dots): (a) N mantle and fresh crater, (b) Southwest (SW) mantle, (c) Oppenheimer U mantled floor, and (d) the Southern (S) pyroclastic mantle.


© Copyright 2026