
MONETARY POLICY STATEMENT
MONETARY POLICY STATEMENT Chief Economist’s Unit and Monetary Policy Department Monetary Policy Statement January-June 2015 Chief Economist’s Unit and Monetary Policy Department Bangladesh Bank www.bb.org.bd 1 Abbreviations BBS BM CAB CAR CPI DMB DSE FAO FCB FCR FDI FY GDP IMF MOF MPS NBR NDA NFA NPL REER RM SME ROA SB SOCB VAT Bangladesh Bureau of Statistics Broad Money (M2) Current Account Balance Capital Adequacy Ratio Consumer Price Index Deposit Money Bank Dhaka Stock Exchange Food and Agriculture Organization Foreign Commercial Banks Foreign Currency Reserves Foreign Direct Investment Fiscal Year (FY2015 = Jul 2014-Jun 2015) Gross Domestic Product International Monetary Fund Ministry of Finance Monetary Policy Statement National Board of Revenue Net Domestic Asset Net Foreign Asset Nonperforming Loan Real Effective Exchange Rate Reserve Money (High Powered Money) Small and Medium Enterprise Return on Assets Specialized Bank State Owned Commercial Bank Value Added Tax 2 Table of Contents PART I: SPEECH & POINTS ...................................................................................................................... 4 Governor’s Speech ........................................................................................................................................ 5 Bangladesh Bank Governor’s Speech (English Version) ............................................................................. 8 Highlights of Monetary Policy:................................................................................................................... 11 Monetary Policy Objectives and Strategies ................................................................................................ 12 PART II: PERSPECTIVE & STANCE ...................................................................................................... 13 Background and Economic Brief ................................................................................................................ 14 The Stance of Monetary Policy for January-June 2015 .............................................................................. 16 PART III: ECONOMIC ANALYSIS ......................................................................................................... 21 Recent Developments ................................................................................................................................. 22 A: Global and Regional Outlook ............................................................................................................ 22 B: The Domestic Sector .......................................................................................................................... 24 C: The External Sector ............................................................................................................................ 33 D: The Monetary and Financial Sector ................................................................................................... 40 PART IV: APPENDIX ............................................................................................................................... 48 Annexure A: Pay Scale and Inflation: No Strong Pattern is Visible....................................................... 49 Annexure B: Point to Point vs. Average Inflation .................................................................................. 51 Annexure C: Bangladesh’s Growth Forecasting ..................................................................................... 53 Annexure D: Growth-Inflation Correlation and the Inflation Heat Map ................................................ 56 3 PART I: SPEECH & POINTS GOVERNOR’S SPEECH HIGHLIGHTS STRATEGIES 4 Governor’s Speech 5 6 7 Bangladesh Bank Governor’s Speech (English Version) Monetary Policy Statement for the Second Half of the Fiscal Year 2015 My warmest greetings and welcome for the invited media representatives and my Bangladesh Bank colleagues in this presentation event of Bangladesh Bank’s Monetary Policy Statement (MPS) for the second half of FY2015. It is now customary for Bangladesh Bank to announce ex-ante the monetary stance it will pursue for containing and stabilizing CPI inflation at desired moderate levels; to anchor inflation expectations among the general population. As in earlier cases, the MPS for the second half of FY2015 has been drafted after eliciting views and suggestions of expert economists, business entrepreneurs and other stakeholder groups, both online and in pre-consultation sessions. A general overview of the unfolding trends in the economic scene and the outcomes of the first half of FY2015 monetary stance will be in order before outlining the stance for the second half of FY2015. You all know that for some years now Bangladesh Bank has got the country’s financial sector engaged in promotion of inclusive, environmentally sustainable financing of output activities, within the monetary growth envelop of cautious, restrained monetary programs consistent with price and macroeconomic stability. This has helped Bangladesh economy to maintain six plus percent annual average real GDP growth for well over a decade now amid prolonged global growth slowdown. Growth has averaged 6.2 percent over the last five years. Single digit CPI inflation has stabilized in a steadily downward edging trend. Declining lending interest rates coupled with rising foreign exchange reserves and Taka exchange rate stability is enhancing the investor friendliness of the domestic economic scene. Progress in bringing annual average CPI inflation down from 7.35 percent at the beginning of FY2015 to 6.5 percent by June 2015 is broadly satisfactory, with 6.99 percent level by close of the first half of FY2015. The CPI inflation decline is however mainly from the food component of the consumption basket; core (non-food, nonfuel) CPI inflation has been on somewhat upward edging trend in November and December 2014. Rise in government’s nonbank financing and subsidy cost savings from declining petroleum prices have kept government’s bank borrowing substantially below earlier projections. Credit growth to private sector though still somewhat below levels projected earlier, has however picked up substantially by the second quarter of FY2015 and remains upward edging. Imports have recovered from growth sluggishness of the past couple of years; current account balance of BOP has turned around from surplus to deficit, from pick up in imports mainly of capital machinery and production inputs. The welcome trend of recovery in momentum of investment and output activities in the first half of FY2015 strengthened optimism of FY2015 GDP growth significantly exceeding the earlier projections (6.5-6.8 percent) based on time series trend analyses. Unfortunately, disruptions from political unrest have reemerged, casting shadow on such expectations. Even as Bangladesh economy’s resilience against debacles is well known, overcoming from the now prevailing disruptive situation is of extreme urgency for protecting the momentum of growth and poverty decline. I earnestly hope that peace and calm will return soon, enabling realization of the growth prospects projected earlier. Given that annual average CPI inflation is still above the targeted ceiling, that core inflation remains upward edging, and the looming uncertainties from the political turbulence; the cautiously restrained monetary policy stance of the first half of FY2015 will be continued unchanged in the second half of FY2015, without any new loosening or tightening. The second half of FY2015 monetary program drawn up on this basis will seek to limit FY2015 broad money (M2) growth at 16.5 percent, using controls on Bangladesh Bank’s reserve money growth as the main tool. Private sector credit will have space for 15.5 percent growth, a level substantially higher than the 12.7 percent November 2014 level. Besides 8 access to external term financing and input import financing will remain open for industrial manufacturers. It may be noted that the programmed broad money and domestic credit growth levels have ample room of supporting output activities leading to higher GDP growth if the enabling environment turns out to be better than expected. Besides maintaining continuity in monetary policy stance, Bangladesh Bank will also maintain continuity and further strengthen the momentum of investment friendly reforms in the credit and financial policies accompanying the monetary policies in the second half of FY2015; towards enhancing effectiveness of the financial markets as transmission channels for monetary policies. Bangladesh Bank’s supervisory oversight on credit disbursement and loan recovery disciplines in banks and financial institutions will intensify; with particular emphasis on risk management, internal audit and internal controls, accountability and transparency. Besides firmly discouraging the abetting of habitual, willful repayment default; creating room for helping out recovery of genuine businesses distressed by circumstances beyond their control with realistic debt restructuring in line with international best practices is under Bangladesh Bank’s careful consideration. Deposit and lending interest rates of banks and financial institutions have been coming down in line with decline in CPI inflation; intermediation spreads between weighted average deposit and lending interest rates of banks and financial institutions have come down to five percentage points or lower in the state owned banks and the majority of private sector banks. The spreads are higher in the foreign banks and in some private sector banks with high engagement in riskier small enterprise lending. Bangladesh Bank’s attention towards rationalization of these higher spreads will continue. Competitive lending interest setting behavior not having yet fostered well in the local financial market, Bangladesh Bank resorted to setting ceilings on lending interest rates in two priority areas, viz., pre-shipment export credit and agricultural credit. In the context of general declining trend in interest rates, in the first half of FY2015 Bangladesh Bank has revised the lending rate ceiling for agriculture downward from 13 to 11 percent. Competitive rate setting behavior in the market would have rendered prescription of such ceilings unnecessary. Bangladesh Bank will therefore pursue ways of fostering of competitive price setting, rate setting attitudes and practices in our financial markets. Besides attention to financial markets stability, Bangladesh Bank’s attention in support of capital market stability will also continue in the second half of FY2015. Bangladesh Bank has the statutory responsibility of enforcing compliance of banks with the legal limits on their capital market exposures; but further to this, Bangladesh Bank has continued liquidity support for capital market transactions in volumes permissible within Bangladesh Bank’s monetary programs. Bangladesh Bank played instrumental role in structuring the refinancing program supporting capital market activities; and will continue to play supportive role in capital market development to the feasible within laws and regulations. Additionally, Bangladesh Bank is engaging regularly with capital market and other financial system regulators in quarterly policy coordination meetings. In the first half of FY2015 Bangladesh Bank has introduced a number of new investor friendly regulatory reforms facilitating external transactions of foreign and local businesses including investors in the capital market. Consequent to one such major reform, foreign equity investments in unlisted local companies can now be sold to local investors at market based prices rather than at net asset value. Diverse fund flows in the financial markets act as transmission channels for monetary policy. Insufficient financial market development in Bangladesh significantly constrains the availability of adequate transmission channels. Absence of old age financial security nets in the form of pension and retirement savings schemes for the general population is one such serious inadequacy, not only for monetary policy transmission but also for access to long term savings options that fund infrastructure and other long term investments. Apart from pension and provident fund schemes for those employed in 9 formal public and private sector organizations, long term old age pension and retirement savings schemes for the general adult population exist in developed and developing economies including neighboring India. Bangladesh Bank has drawn to government’s attention the urgency of setting up institutional framework for such schemes in Bangladesh; and the issue warrants priority attention from aspects of monetary policy efficacy, financial markets development, and long term investment needs in the real sector. I hope that our monetary policy statement for the second half of FY2015 issued today will play the same effective role as the previous issues in instilling and strengthening public confidence on Bangladesh Bank’s actions aimed at containing and stabilizing CPI inflation; and I also believe that its attendant inclusive, environmental sustainability supportive credit and financial policies will make meaningful contribution in supporting the governments pursuit of inclusive, environmentally sustainable growth and poverty eradication on the country’s path towards prosperity. My heartfelt thanks and congratulations to you mass media community representatives for the responsible role you are playing in projecting in positive light the boldly optimistic and ambitious initiatives of the government and of public institutions like the Bangladesh Bank towards these ends. Thank you so much. Dr. Atiur Rahman January 29, 2015 10 Highlights of Monetary Policy: Despite some upside risks, inflation will be kept under control to reach the target of 6.5 percent by June 2015. The economy is poised to achieve a respectable growth rate between 6.5 and 6.8 percent in the fiscal year 2015 if political stability prevails. The bottlenecks of infrastructure and energy must be addressed promptly. Over the last 20 years Bangladesh evidenced the highest amount of stability in inflation and economic growth in the South Asian region that includes India, Pakistan and Sri Lanka. Bangladesh’s growth performance is the second best (5.73 percent) after India (6.77 percent) and its inflation is the lowest (6.45 percent) in the region over the last two decades. Bangladesh Bank will pursue a monetary policy of prudence to strike the balance between objectives of moderate inflation and respectable growth. Money supply and policy rates will be controlled accordingly while opening further avenues to promote investment through greater financial inclusion. Banking governance will be up scaled further to clamp down on loan delinquencies. While the cases of credit worthy borrowers will be reviewed, habitual defaulters will face lawful consequences. Bangladesh Bank will endeavor to iron out excessive fluctuations in the exchange rate which will remain largely market based. The central bank will continue to maintain comfortable amount of foreign currency reserves to cover imports of 5 to 10 months. This safety net is required to avoid any sudden collapse in the value of Taka and to ensure a healthy growth of imports of productive inputs. Bangladesh Bank aims at supplying reserve money at the growth rate of 15.9 percent and broad money at 16.5 percent at the end of FY2015. Private sector credit growth has been targeted to grow at 15.5 percent at the end of FY2015. At the retail level both deposit and lending rates fell in July-December of FY2015 and the interest spread has on average decreased from 5.31 percent in June 2014 to 5.17 percent in December 2015. Bangladesh Bank will continue its effort to reduce this spread. 11 Monetary Policy Objectives and Strategies As part of the responsibility, as per Section 7A of the Bangladesh Bank Order 1972, Bangladesh Bank formulates and implements monetary policy each year. As stated in the preamble of the Bangladesh Bank Order 1972 amended in 2003, the objective of monetary policy of Bangladesh is to stabilize domestic monetary value (i.e. low inflation) and maintain a competitive external par value of the Bangladesh Taka (i.e. a competitive exchange rate) towards fostering growth and development of country’s resources in the best national interest. Within the legal context, Bangladesh Bank generally focuses on achieving price stability along with moderate inflation while providing sufficient space in its monetary program for domestic credit which supports broad based investment and inclusive growth objectives. The aim of the central bank is to ensure a congenial environment of output growth by providing a stable macro platform with moderate inflation and a largely stable. Bangladesh Bank conducts its monetary policy through a monetary policy framework which refers to a logical and sequential set of actions. It wants to achieve certain goals but cannot directly influence the goals. It has a set of tools at its disposal that can affect the goals indirectly in a lagged fashion. So, if the central bank waits to see the effect of the tools on the goals, it will be too late to make necessary corrections to the policy. That is why it aims at some variables that lie in between the tools and goals which it can change and monitor very shortly. Thus, Bangladesh Bank like other central banks decides on the strategy for conducting monetary policy. The variables that Bangladesh Bank generally addresses can be classified as instruments, targets and goals. The framework can be expressed in a flowchart as shown in the inner page of the back cover. The targets are further classified as operational targets and intermediate targets. Bangladesh Bank also keeps an eye on some developments of the major macro variables such as GDP growth, inflation, growth of monetary aggregates and liquidity position of banks, short-term interest rates, and exchange rates to make any policy revision. The core action space of any central bank in a developing economy can be described in the Activity Pentagon of Monetary Policy as shown in the inner page of the back cover. The two variables of the Pentagon such as the interest rate and money growth are usually used as operating targets while inflation and the exchange rate in the middle stage are often treated as intermediate targets. Achieving sustainable growth turns out to the final target in the activity space of monetary policy. Bangladesh Bank like every central has a limitation in achieving its goal because it has to assume a stable money demand function which may vary depending on other situations. Bangladesh Bank works on high-powered reserve money with the assumption that the money multiplier will remain the same. But it varies. For example, during the Great Depression, the Federal Reserve of the US increased high-powered money (monetary base). But ultimately the Fed was blamed for monetary contraction because the money multiplier fell drastically, making the growth of money supply negative. Thus, monetary policy turns out to be a difficult exercise on the part of the central bank. 12 PART II: PERSPECTIVE & STANCE ECONOMIC BRIEF STANCE 13 Background and Economic Brief Bangladesh Bank designs the Monetary Policy Stance for January-Jun 2015 based on the changes in the global scenario as well as developments in the domestic economy. Global outlook and the major snapshots on the state of the economy are presented in the Economic Analysis part in further detail. Here only the vital briefs are placed to motivate the background of the Monetary Policy Stance. World GDP growth is expected to edge up from 3.3 percent in 2014 to 3.8 percent in 2015. Although growth in emerging markets and developing economies will be moderate at 5 percent, advanced economies are likely to grow at 2.3 percent in 2015, suggesting lackluster export prospects for the developing world. In the midst of dull growth of the emerging giants, China and India, Bangladesh's projected growth at 6.4 percent in 2015 seems quite respectable. Thanks to the stability of output growth and inflation in Bangladesh, the country is poised to energize its investment demand, which needs special attention. Bangladesh Bank endeavors to create an investment friendly environment and attempts to nurture the climate of internal demand. Monetary Policy will nicely dovetail with the objective of inclusive, sustainable growth and moderate inflation. Although the momentum of growth has slightly slowed down after a peak of 6.7 percent growth in 2011, the performance is still commendable. Starting from as low as 2 percent in 2001, inflation reached its peak close to 12 percent in 2011. The downturn has been in progress in the years since, reaching 7 percent in recent months. All three sectors of the economy: agriculture, industry, and services, are performing well. Industrial growth has been faster than others as expected. The trend analysis shows 8 percent plus growth for industry and around 4 percent growth for agriculture. Services, being the largest sector (more than 50 percent), grows at 6 percent on the trend. The share of investment in GDP is around 29 percent – adequate to generate 6 percent plus growth in output. Nevertheless, further efforts to augment the investment ratio are warranted. Public investment in infrastructure and energy is essential in this regard. The implementation of Annual Development Program (ADP) requires speeding up to accomplish mega public projects that always create space for greater private investment. Although Bangladesh's Debt-GDP ratio is one of the lowest in the region, this ratio indicates the opportunities of productive debt by the government – which can be used to build infrastructure and institutions that expedite financial activity. Government borrowings from the banking sector are decreasing, but increased borrowings from the nonbanking sector may raise the cost of fund and eventually prevent lending rates from falling. Export growth, though remained around 1 percent in the first 4 months of FY2015, showed a sign of rebound since November. Import growth speeded up at the end of 2014, exceeding the growth of exports. Despite a 10 billion dollar trade deficit (exports 32 billion and imports 42 billion dollars) will be added on the deficit of 8.4 billion dollars in services and primary income as projected for FY2015. 14 Fortunately, remittances and other secondary income to the tune of 17 billion dollars are expected to cushion against the deficits of trade, services, and primary income, limiting the amount of current account deficit to 1.35 billion dollars for FY2015 – which appears to be normal and serviceable for a growing economy like Bangladesh. The overall balance that adds capital and financial accounts will still turn out to be positive ($642 million) at the end of FY2015. Further measures to attract and facilitate FDI, which is still below 2 billion dollars, must be taken to raise the investment–GDP ratio that eventually generates growth. Foreign currency reserves are hovering over around 22 billion dollars – enough to cover imports of more than 6 months. After a period of appreciation since early 2012, the exchange rate remained stable since mid-2013. In the monetary and financial sector, domestic credit grew at 11.3 percent in November 2014 (Public 6.0 percent and private 12.7 percent) although reserve money grew at 14.3 percent correspondingly. The average lending rate slightly slid down to 12.5 percent – which businesses still see as high when inflation has rolled down to 7 percent. The average deposit rate is above 8 percent, making the spread close to 5.2 percentage point which was slightly lower than 5 percentage point in October 2014. There is certainly an imperative for higher level of competition amongst Financial Institutions which will drive down the rate of interest. The slope of the yield curve is encouragingly positive to induce investors into capital market ventures. The share of nonperforming loans has recently gone up to roughly 12 percent mainly because of the new global best practice of loan provisioning and partly non-profitable situations and uncertainty related to political factors. After the burst of the price bubble at the end of 2010, the stock market languished until early 2013. The market began to rebound particularly in the market capitalization to GDP ratio since then. 15 The Stance of Monetary Policy for January-June 2015 This monetary policy mainly features: An inflation controlling money growth strategy An internal demand boosting monetary plan An investment friendly monetary path An inclusive growth framework Core Vision Simply high growth cannot be prudential for an emerging economy like Bangladesh. Growth must be sustainable to ensure steady pace of development. Growth must be long-lasting to fight poverty and to take the economy to the middle income bracket by 2021. The activity base of growth must be expanded by empowering the masses. Herein lies the essence of inclusive growth, which is instrumental to strategizing a new monetary policy for Bangladesh Bank. To provide access to finance to all sections of society and thus to make growth sustainable by empowering the poor is the main objective of financial inclusion. Bangladesh Bank strongly believes that financial inclusion not only stimulates growth by expanding the activity base, but it also contributes to growth stability through desired diversification of financial access – much needed to boost investment and entrepreneurship. Essentially, the main task of the central bank is to sustainably promote a respectable growth rate by ensuring macro stability that anchors in moderate inflation. Bangladesh Bank upholds those principal targets and devises its monetary policy stance accordingly. Inflation Major movements in price level appear to be primarily a monetary phenomenon in Bangladesh. Hence, a cautious control of reserve money that eventually augments broad money through the multiplier is imperative. The management of money growth is a challenging exercise particularly in an emerging economy like Bangladesh where healthy money supply is needed for credit expansion and private investment. On the other hand, a cautious control of money supply is required to keep inflation in cheek when investment growth, a higher employment demand, and thus higher wage begin to stimulate the price level. Bangladesh Bank is committed to strike the balance between inflation and growth for a comfortable outcome. Bangladesh Bank always monitors risks of inflation. It also observes the recent lack of vigorous investment scenario while devising this monetary policy statement for January-June 2015. Much of the lackluster investment scenario is emanating from the ongoing turbulent political situation where monetary policy has no control. Still the central Bank is determined to brave the adversity and to continue its resolute stance on investment stimulation. It will remain proactive in providing regulatory facilitation for all types of investors even within severe constraints. Inflation erodes consumption and contributes uncertainty to investment. Policy will be taken to make the gradual descent of inflation continue. High inflation will push the lending rate to remain high and thus will impede investment. Again, high inflation is most likely to raise the real effective exchanger rate (REER), putting a downward pressure on the trade balance. Thus the persistence of an inflation rate above the tolerable level affects both the domestic as well as the external sector in this age of globalization. There is no specific number of tolerable inflation for Bangladesh. The moderate level of 16 inflation for the developed countries is much lower, say 2 percent to 2.5 percent. In contrast, studies find the rates between 4 to 6 percent of inflation as suitable for sustainable growth in the developing economies. The Government of Bangladesh announced an inflation target of 5 percent by 2017 in the Budget Speech of FY2013. While this type of long term projections may vary based on the situations that constantly evolve over time, Bangladesh Bank will always strive to keep inflation at its moderate level that supports respectable growth. Keeping that strategy in mind Bangladesh Bank sets an inflation target of 6.5 percent to be achieved by June 2015. Bangladesh Bank is committed to maintaining that target of inflation. Economic Growth Overall, growth in services, construction, manufacturing, and remittances suggests that aggregate demand and overall economic growth in FY2015 will be picking up from the last fiscal’s level of 6.12 percent. The ARMA model of Bangladesh Bank’s current growth forecast for FY2015, as shown in the appendix, stands at 6.47 percent. Based on the moving trend analysis using the Hodrick-Prescott filter, as shown in the Economic Analysis part, a rate of 6.28 is derived for FY2015. Policymakers do not simply depend on mathematical models or econometric estimations. Additionally, a subjective judgment is warranted to derive a growth corridor based on economic momentum and other positive social indicators. Taking the recent trend of remittances, private credit growth, and both exports and imports, Bangladesh Bank provides a projection corridor that ranges from 6.5 percent to 6.8 percent for FY2015. The central bank will update its forecasts on a regular basis during the course of the year. The monetary program will also be flexible to accommodate any significant change in these forecasts. Even the current monetary program provides enough space for credit growth, both private and public, to support ambitious growth projections of the government. Since Bangladesh has evidenced commendable growth stability, or in other words, the standard deviation of Bangladesh’s growth is respectably low, we do not expect much deviation from the forecasted value the central bank has figured out. However, if overall political and business environment improves, Bangladesh Bank’s forecast will also be revised. Money and Credit Growth The monetary stance in the second half of FY2015 takes the recent economic and financial sector developments into account as elaborated in the Economic Analysis part. The central bank will target a monetary growth path which aims to bring down average annual inflation to 6.5 percent, while ensuring that credit growth is sufficient to stimulate inclusive economic growth. This would require a monetary program framework that limits reserve money growth to 15.9 percent and broad money growth to 16.5 percent by June 2015. The ceiling for private sector credit growth of 15.5 percent has been kept well in line with economic growth targets. This level is sufficient to accommodate any substantial rise in investment and trade-finance over the next six months. Investment and Interest Rates As various surveys assert, political turbulence and lack of adequate infrastructure and energy are the major impediments to investment and foreign investment in particular. Despite these limitations our investment-GDP ratio is 29 percent which is close to India’s and Sri Lanka’s and almost double than Pakistan’s. Still there is no room for complacency. The investment-GDP ratio has to be raised to almost 17 35 percent to earn growth rates between 7 and 8 percent if the incremental capital output ratio (ICOR) is assumed to lie between 4.5 -5.0. Simultaneously, we need to improve our productivity gains so we may get even higher growth rate with the projected level of the investment-GDP ratio. Hence, reducing the cost of fund is imperative. Bangladesh Bank will endeavor to reduce the existing spread of 5.2 percent between lending and deposit rate so the lending rate can be pulled down to incentivize the investors. The business community views the existing average lending rate of 12.5 percent as high enough to dampen investment vigor. However, reducing interest rates will require bringing inflation down even further. Otherwise real deposit rates will be negative, discouraging domestic savings and making investment finance inadequate. Bangladesh Bank urges the commercial banks to devise ways to reduce the lending rates which did not come down along with inflation correspondingly. Inflation dropped by almost 5 percentage points since the end of 2011, but the average lending rate dropped by only 1 percentage point since then, empowering the banks to earn higher real rates of interest and thus making investment more expensive than before. Bangladesh Bank is keeping the policy rates intact at 7.25% (Repo) and 5.25% (Reverse Repo). Banks are advised to lend only to creditworthy clients who invest their funds for productive purposes and repay the instalments regularly. Liberalization and Lending Rates In South Asia, both India and Bangladesh, the two fastest growing economies in the region, followed an upward trend of growth ever since they embarked on liberalization in the early 1990s. Liberalization nevertheless exposed us to mixed challenges – one of them being the less impeded flow of capital. Now overseas borrowing is possible at a much lower rate than the domestic lending rate, creating threats to the domestic funds which charge higher lending rates. Some banks with high lending rates may face the problem of excess liquidity if overseas channels of borrowing become gradually available to all potential investors. Although the amount of overseas borrowing is still trivial in comparison to total domestic credit as well as low to the debt-GDP ratio, this is a reality of liberalization. This reality clearly signals the bankers to embrace the challenge so they become more competitive in setting interest rates in the future. Bankers have to embrace the fact that cross-broader capital flows are ascending with the pace of globalization. Development Focus Bangladesh is now at a crossroads of development. The growth momentum that the country has achieved over the last decade must be continued and should be further energized to help the economy graduate to the middle income bracket by 2021. In compliance with the government’s target, Bangladesh Bank designs its demand side strategies in support of that goal. Bangladesh Bank undertakes the steps: 1) to stimulate internal demand through productive consumption that necessitates further domestic investment in turn. 2) to encourage Small and Medium enterprises (SME) to increase employment 3) to promote green economy projects that make our growth environmentally sustainable 4) to finance public projects of infrastructure and energy 5) to promote export facilities 18 6) to encourage the import of capital machinery and other inputs that support the manufacturing sector, and 7) to continue patronizing the agricultural sector whose steady progress is crucial to employment and food security of the nation. The supply side stimulation includes promoting productivity through technology in all spheres of financial transactions. The examples include: 1) mobile banking 2) e-commerce 3) automated clearing house etc. With a rapid increase in electronic transactions, the need for financial vigilance has also been scaled up to protect the integrity of the system. When our neighboring South East Asia is rapidly modernizing its banking sector, we will be thrown off the rails unless we promptly digitalize our service sector in this age of financial integration. Banking Governance Bangladesh Bank monitors the recent rise of nonperforming loans with concern and care. While many of these figures are potentially alarming, Bangladesh Bank has already taken some corrective measures to clamp down on classified loans. We hope to see their descent soon. Banks have to take strong measures to recover these loans and if not take hit in their balance sheets for these irregularities. Bangladesh Bank will not be lenient in this regard. While the cases of the credible borrowers with potential for better businesses will be reviewed, the central bank will not hesitate to take any stern measures against the habitual defaulters and bad borrowers with a track record of persistent delinquencies. The central bank has taken various steps to improve supervision so financial frauds can be minimized if not eliminated entirely. Digital technology has been deployed to investigate big financial transactions and loans in order to stop the repetition of banking irregularities. The Real Time Electronic Dashboard is an example in this regard. Fiscal Monetary Coordination Government spending may often be inflationary since it does not have immediate return. Bangladesh Bank is always in favor of limiting government borrowings from the banking sector so the government cannot crowd out private investment. In the last national budget of FY2015 government declared that Taka 312 billion will be financed from the banking system while it did not take any amount as of today on the net calculation. Rather it repaid around an amount of Taka 41 billion to the banking system in the first half of FY2015. So, government borrowing from the banking system did not create any pressure in the first half of FY2015, creating further space for the private sector. However, the FY2015 monetary program assumes that any unanticipated spending pressures in the second half of FY2015 will be accommodated within the sizeable borrowing limit set in the budget. Moreover, Ministry of finance has an established track record of keeping within this borrowing limit, indicating no concern regarding the government borrowing limit. Nevertheless, fiscal monetary coordination will be continued among senior policymakers with regular meetings of the Coordination Council. 19 Financial Stability After the global financial crisis, financial stability has become more pronounced in the global economy. Bangladesh Bank took this issue more seriously than ever. With a view to addressing the weaknesses of the financial system, it has been working on strengthening financial health of the economy. Bangladesh Bank has been arranging quarterly meetings with Bangladesh Securities and Exchange Commission and other regulators on regular basis where policy conflicts between these institutions are discussed and mitigated. In particular, Bangladesh Bank attaches special importance to deeper cooperation between Bangladesh Bank and BSEC. In addition, Bangladesh Bank took special initiative to provide a refinance line to the Investment Corporation of Bangladesh (ICB) as a support for improving capital market. As a result, stock businesses are getting back their confidence on the capital market. Such initiatives regarding financial stability and capital market development will be continued and strengthened. Inclusive and Green Financing Bangladesh Bank initiatives on inclusive and green financing are yielding positive outcomes in terms of macroeconomic and financial stability, domestic demand driven broad based inclusive output growth and faster decline in poverty. Agriculture, SMEs, and green projects have faced no credit crunch in Bangladesh during or following the global financial crisis. Incremental output from the agriculture sector and SME financing has helped uphold output stability and price stability in the real economy; while also bolstering institutional stability in the financial sector by diversifying and broadening their asset and liability portfolios in the new inclusion client bases. These initiatives will, therefore, be continued and strengthened in the first half of FY2015 remaining within the given monetary program. Foreign Reserves and Exchange Rates This stance also aims to further consolidate the country’s external sector stability. Bangladesh Bank anticipates further buildup in foreign exchange reserves in the second half of FY2015 though at a more moderate pace than FY2014 due to the balance of payments assumptions described in the Analysis part. Bangladesh Bank will continue to support a market based exchange rate while seeking to avoid excessive exchange rate volatility. The outcomes of monetary program and policies pursued in the second half of FY2015 will be reviewed in June 2015 in light of prevailing global and domestic economic conditions. In the meantime the Monetary Policy Committee at Bangladesh Bank will meet monthly to review the developments and to make policy adjustments if necessary. 20 PART III: ECONOMIC ANALYSIS GLOBAL OUTLOOK DOMESTIC SECTOR EXTERNAL SECTOR MONEY & FINANCIAL SECTOR 21 Recent Developments A: Global and Regional Outlook The World Economic Outlook has lowered the global growth prediction for 2015 from 3.9 percent to 3.8 percent. Growth projection for both advanced and emerging economies has been down scaled because of their slower than expected rate of recovery from the post crisis stage. However, in a comparative scenario, the global outlook portrays a slightly encouraging picture for the world since its output growth is expected to rise from 3.3 percent in 2014 to 3.8 percent in 2015. Figure A1: World Economic Outlook for 2015 The main contributor to this growth performance is Asia and the Pacific region. While Europe has escaped from negative growth that prevailed until 2013, the region is still expected to flounder in slow growth as low as 1.3 percent in 2015. The average growth of the emerging and developing economies is likely to be 5 percent while both China and India, the two emerging giants of the globe, will outperform the 5 percent mark. In 2015, the growth rate of 7.1 percent that China is likely to experience is the lowest in its history of 29 years. As India’s growth has slid down, now Bangladesh is expected to do as good as India in that performance to earn a growth rate of 6.4 percent – predicts the IMF. The US is likely to earn a growth rate of 3.1 percent in 2015 – remarkably higher that its growth of 2.2 percent in 2014. These results of Europe and the US emit mixed signals to the prospects of Bangladesh’s exports. A sluggish global recovery still continues. The recovery in the US is broadening on the back of stronger domestic consumption, rising investment, and industrial activity. In the Euro area, headwinds from necessary forces continue to weaken industrial production and investment sentiment. Growth may be picking up in Japan, again on the back of stronger exports, aided partially by further quantitative easing that led to a depreciation of the yen. 22 In china, poor activity along with low inflation prompted rate cuts by the People’s Bank of China. In other major emerging market economies, downside risks to growth from elevated inflation, low commodity prices, deteriorating labor market condition, and sluggish domestic demand have become accentuated. Broadly, in advanced economies, the legacies of the pre-crisis boom and the subsequent crisis still cast a shadow on the recovery. Emerging markets are adjusting to rates of economic growth lower than those reached in the pre-crisis boom and the post crisis recovery. Overall, the pace of recovery is becoming more country specific. Figure A2: GDP Growth Projections in South Asia for 2015-2019 A regional outlook in the World Economic Outlook predicts the best output performance by Bangladesh in comparison to Bangladesh’s neighbors in the five years to come. Figure A3: Global Food and Oil Prices The figure shows the co-movement between the food price index and the oil price. The correlation between the growth rates of these two series is 32 percent – a considerably high number statistically significant at the 1 percent level. Commodity prices fell by 28 percent within July-December 2014, 23 mainly reflecting the sharp drop in oil prices. Crude oil prices averaging $105/bbl in July have fallen to $60/bbl in December and below $46/bbl in early January. The uncertainties in the Middle East, however, may continue to persist and oil prices are therefore likely to remain volatile. On the other hand global food prices have also declined by about 10 percent over the past six months. The FAO forecast suggests that global food prices are expected to remain reasonably stable over the next six months as the overall stock to utilization ratio is higher than that one year earlier. B: The Domestic Sector Inflation Scenario The 12-month average inflation based on the consumer price index (CPI) maintained a declining trend during the last six months and came down to 6.99 percent in December 2014 from 7.28 percent in July 2014 mainly because of declining food prices. This inflation was driven 68 percent by food and 32 percent by nonfood items. Figure B1: 12-Month Moving Average Inflation in Percent Average food inflation moderated to 7.92 percent in December 2014 from 8.55 percent in July 2014 while average nonfood inflation edged up to 5.60 percent from 5.41 percent over the same time points. Food inflation for the last six months has been declining partly because of declining global and regional food prices, particularly moderating food prices in India. Our inflation is heavily linked to India’s unless there are greatly different money growth rates and supply shocks.1 1 See Paul B and H Zaman (2013). When and why does Bangladesh’s inflation differ from India’s? Working Paper 1301, Chief Economist’s Unit, Bangladesh Bank. The study is forthcoming in Macroeconomics and Finance in Emerging Market Economies, 2015 24 However, until November 2014, average food inflation remained above 8 percent. Point-to-point inflation data show that food inflation has, broadly fallen from the pick 9.09 percent in May 2014 to 5.86 percent in December 2014. The reasons of elevated food prices relate to distribution constraints emanated from frequent nationwide strikes in the first half of FY2014. The prospects for bumper rice production in NovemberDecember 2014, adequate food production in the year ended in June 2014, low Indian food inflation have helped Bangladesh’s food inflation fall. Figure B2: Contribution of Food and Nonfood Items to Average Inflation Nonfood inflation for the first three months of FY2015 (July-September 2014) has been declining. Point-to-point nonfood inflation has also declined steadily over the same period. This is due to a slowdown in credit growth and remittances. However, from June to December of 2014 there was an upward tendency in point to point nonfood inflation as it rose from 5.45 percent in June to 6.48 percent in December. These upticks are due partly to increased consumer demand as a number of festivals (two Eid celebrations and Durga Puja) were observed during the period. This rising tendency of nonfood inflation in very recent months pushed up average nonfood inflation from 5.34 percent in September to 5.60 percent in November 2014. Average CPI inflation pattern in rural and urban areas was almost similar to the national one. But urban inflation (7.35 percent) was more acute than the rural one (6.80 percent) in December 2014. In a regional comparison, the inflation scenario of Bangladesh looks far more moderate than that of its neighboring economies. A time-series approach, as displayed in the figure, spans the period of liberalization since the mid-1990s. 25 Figure B3: Inflation and Its Volatility in South Asian Economies: 1995-2014 10 9.45 8.57 9 8 7.31 7 6 5 6.45 4.52 3.84 4 2.87 3 2.44 2 1 0 Sri Lanka Pakistan India Average Rate of inflation Bangladesh Inflation Volatility The figure shows that both inflation and its volatility are the lowest in Bangladesh in the region over the last 20 years since 1995. Bangladesh’s average inflation of 6.45 percent along with plus-minus deviation of 2.44 percent over the 1995-1014 period is a testimony of prudent monetary management of the central bank. Inflation Expectations and the Target Figure B4: Inflation Projection for South Asian Economies: 2015-2019 As the IMF predicts, a regional convergence of inflation at the rate of 6 percent is likely over the five years to come as shown in the figure. But the process may not be that smooth as shown in the figure. 26 The FY2015 inflation target announced in the Budget is 6.5 percent. Reducing average inflation from its current 6.99 percent level to that level in the face of some upside risks may prove challenging. Aggregate demand is likely to pick up in the second half of FY2015. In addition, the possible upward price movement of oil will significantly affect commodity prices as we saw a strong correlation between the rates of change in commodity and oil prices. The upward adjustment of house rents and other service sectors items at the beginning of every year is a regular phenomenon. These tendencies may put pressure on inflation. An expected rise in gas and electricity prices and inflation expectations emanating from the upcoming salary hike in the public sector and the resulting wage hike in the private sector may exert pressure on prices particularly on the nonfood prices in coming months. On the other side, price pressures are expected to moderate with improvement in supply chain which is being disrupted to a great extent since the beginning of 2015. A better crop outlook and a continued supportive stance of monetary policy by Bangladesh Bank may help maintain a moderate rate of inflation in 2015. GDP Growth Performance A time-series perspective of Bangladesh’s growth as shown in the figure reveals that its growth entered a new era of buoyancy and upward trend since liberalization in the early 1990s. But the upward trend has recently slowed down very slightly. Figure B5: Bangladesh’s Growth and Trend over Policy Changes 8 Bangladesh's GDP Grow th in Percent Moving Trend (by HP Filter) 7 6 5 4 3 2 1 Period of Policy Anomalies New Era of Democracy and Liberalization 0 1980 1985 1990 1995 2000 2005 2010 Key indicators related to output growth in the July-December period of 2015 suggest that economic growth is likely to have picked up relative to FY2014 levels. The service sector comprises over half of GDP and its data are available only on an annual basis. However, a number of proxy indicators reflect reasonable service sector growth during the first half of FY2015. Data on bank advances show that the growth of outstanding credit to the trade and commerce sector increased to 15.2 percent at the end of the first quarter (July-September) of FY2015 from 13.7 percent at the end of the first quarter of FY2014. Bank advances to the transport sector registered a remarkable growth of 9.1 percent in the first quarter of FY2015 against the negative growth of 4.0 percent in the first quarter of FY2014. Bank 27 advances to agriculture including fishing and forestry experienced an impressive growth of 18.49 percent in the first quarter of FY2015 compared over the same period of FY2013. Moreover advances to term loans including working capital (excluding trade finance) also recorded 15.85 percent growth in the first quarter of FY2015. Looking at the manufacturing sector data on industrial term loan and SME may provide us an idea about the output growth. As per available data, disbursement of industrial term loans amounted to Taka 12809.42 crore in the first quarter of FY2015 compared to Taka 8880.79 crore in the first quarter of FY2014, recording a remarkable growth of 44.24 percent over the corresponding period of the last year. Out of the total disbursement, loans to large scale industries show 61.06 percent growth followed by medium scale industries growth by 14.86 percent while small scale and cottage industries experienced surprisingly negative growth of 25.92 percent. While loans to SME appear to be more productive, its share in total loan by banks and non-bank financial institutions has increased to 23.73 percent in the first quarter of FY2015 from 22.95 percent in the first quarter of FY2014. Moreover, loans to SME have increased by 15.67 percent at the end of September 2014 over the same period a year earlier. Sectors of the Economy The economy of Bangladesh began to experience structural transformation particularly since the early 1990s when the country embarked on liberalization. This dynamics is evident in the figure. Figure B6: The Dynamics of Three Sectors in Bangladesh The sectoral growth figures show an upward trend for all three sectors: agriculture, industry, and services. The trend lines for every sector convince us that Bangladesh’s growth is poised on a stable path as shown in the figure. 28 Figure B7: Growth of Sectors and Their Trends in Bangladesh A time series view of our growth, as displayed in the figure, reveals that Bangladesh achieved respectable growth with laudable stability in comparison to its neighbors over the period of liberalization (1995-2014). Figure B8: Growth and Growth Volatility in South Asia: 1995-2014 The figure shows GDP growth and its volatility in the major South Asian economies over the last 20 years since 1995. Output growth in Bangladesh appears to be the second highest and growth volatility appears to be the lowest in the region. This diagram also convinces that Bangladesh’s growth in likely not to deviate too much from its previous recent numbers. The investment-GDP ratio (or simply the investment ratio) further vindicates this notion of growth stability. In a comparative time-series perspective, as shown in the figure, we are convinced that the growth rate of Bangladesh’s investment ratio has been the most stable in the region since the mid- 29 1970s. The investment ratio shows a stable upward trend – a feature not seen in India, Pakistan, and Sri Lanka. Figure B9: Investment Share as a Percentage of GDP in South Asia Developments in Public Finance Table B1: Fiscal Sector Performances Particulars Total revenue NBR Tax Revenue VAT Custom Duty Income Tax Others NBR Tax Revenue Annual Development Program Budget FY2015 (in billion Taka) During JulyNovember FY2015 (in billion Taka) Change over July-NOV FY2014 (in percentage) Percentage of budgeted amount 1829.5 1497.2 550.1 146.2 560.9 240.0 477.3 188.1 57.8 146.3 85.1 13.9 14.8 12.8 13.6 13.2 31.9 34.2 39.1 26.1 35.5 803.2 168.4 21.3 20.9 As the table of revenue mobilization shows, in FY2015, total revenue target was set at Taka 1829.5 billion. Of this target, Taka 1497.2 billion is estimated to be coming from NBR revenue. During the first five months of current fiscal year, NBR revenue reached Taka 477.3 billion (31.9 percent of yearly target), which is 13.9 percentage higher than that of the same period of FY2014. Even though revenue collection from VAT (34.2 percent of yearly target), and custom duty (39.1 percent of annual target) was satisfactory, revenue collection from income tax (26.1 percent of yearly budget) was lagging behind. 30 Annual Development Program In FY2015, Annual development program (ADP) expenditure budget was set at TK 803.2 Seemingly ADP expenditure during July-November FY2015 increased by 21.3 percent compared to that of July-NoveFY2014; however, a closer look does not miss the fact that during July-November FY2015, ADP expenditure was extremely low (Taka 168.44 billion which is only 20.9 percent of annual ADP budget). The efficient use of the remaining 79 percent of ADP budget in rest of the months remains a big question. Fiscal Deficits and National Debt Figure B10: Debt-GDP Ratio in South Asia Comparative statistics with a time-series view shows that Bangladesh is in a better position than India, Pakistan and Sri Lanka in terms of the debt-to-GDP ratio. The total debt-GDP ratio of Bangladesh decreased from 50.7 percent in FY1994 to 28.6 percent in FY2014. On the other hand, debt still remains above 60.7 percent of GDP in India, Pakistan, and Sri Lanka. The Debt-GDP ratio of Bangladesh fell drastically compared to others as its external debt-GDP ratio decreased to 13.6 percent in FY2014 from 43.3 percent in FY1994. In Bangladesh, government financing became more dependent on domestic debt as the debt-GDP ratio gradually rose from 7.4 percent in FY1994 to 15.0 percent in FY2014. The figures show that Bangladesh can accumulate more debt from external sources in particular to undertake mega projects to finance infrastructure and energy. However, it also requires a healthy development of secondary markets for bonds and other long-term instruments. Government Borrowing The banking sector is less willing to see higher the government borrowings from the banking sector. The government, however, has rightly evidenced that ‘non-crowding out’ stance as shown in the figure. Government borrowing (net) from the banking system was significantly lower than projected in the first half of FY2015. There is a budget provision of Taka 312 billion for the whole of FY2015. The relatively low borrowing levels partly relates to the slower pace of ADP implementation and this pattern of government borrowing appears similar to the previous year where the borrowing largely took place in 31 the second half of FY2014 as only 46 billion Taka, of the total 175 billion Taka borrowed, was borrowed in the first half of FY2014. Figure B11: Government Borrow in Fiscal Year 2015 Figure B12: Government’s Domestic Borrowing from Banks and Nonbanks Another factor behind the low levels of borrowing from the banking sector is the fact that revenue from the sales of National Savings Certificates have risen sharply as the differential between their returns and that of bank fixed deposit rates has increased. Savings certificates sales between July and October of 2014 of Taka 90.78 billion exceeded the target of Taka 90.56 billion for the whole FY2015. The overall net borrowing from the banking system is the sum of borrowing by the Government from Bangladesh Bank and borrowing by the Government from scheduled banks. The figure also illustrates how this pattern has changed. In the first half of FY2014 government made a net repayment to Bangladesh Bank of Taka 62 billion while borrowing Taka 79 billion from scheduled banks. 32 C: The External Sector Exports and Imports Figure C1: Development of Exports and Imports in Bangladesh 11 10 9 8 7 Export (in Log) 2014 2012 2010 2008 2006 2004 2002 2000 1998 1996 1994 1992 1990 1988 1986 1984 1982 1980 6 Import (in Log) Although export growth slowed down to 1.6 over July-December of 2014, it evidences a sign of rebound in the last 2 months of 2014. Given the pace, the central bank expects to achieve 8 percent growth in export by June 2015. Figure C2: Growth Rates of Exports and Imports and their Trends 35 30 25 20 15 10 5 0 -5 -10 -15 -20 Export Growth (%) Import Growth(%) Linear (Export Growth (%)) Linear (Import Growth(%)) Export receipts boosted up in December 2014 by 17.65 percent over the previous month , recording 1.56 percent growth in July-December 2014(offsetting the negative growth up to October) compared to the same period of the previous year. Import payments based on shipment data boosted up by 16.64 percent during July-November 2014 over the corresponding period of the previous year. Import L/C opening data (rose by 14.77 percent during July-November 2014) also suggest that the import payments will have a momentum in the second half of FY2015. 33 Figure C3: Evolution of the Openness Index (Trade-GDP Ratio) in South Asia Liberalization Looking ahead to the second half of FY2015 our balance of payments projections show that there will be a correction in the pace of export growth as the existing outcome of export earnings appears to be the lag effect of cancelation of garments order followed by political deadlock in the first half of FY2014 and destruction of Rana Plaza, along with a pick-up in imports as investor confidence grows. A solid remittance growth in the second half of FY2015 can be expected. These assumptions along with the outcomes for the first half of FY2015 imply that for FY2015 overall export growth of 8 percent, import growth of 15 percent, and remittance growth of 12 percent can be projected – which will lead to a reasonable balance of payment surplus of USD642 million. Remittances Figure C4: Workers’ Remittances Remittance growth started gaining in the second half of FY2014 and became positive in the first half of FY2015. Remittance growth in FY2014 became negative of 1.6 percent against larger growth of 12.6 percent in FY2013 though this growth did faster to 5.6 percent during the second half of the year compared to the corresponding period of FY2013. 34 Figure C5: Numbers of Workers Moving Abroad However, remittance growth in the first half of FY2015 is recovering to the normalcy and trended up; recording a solid growth of 10.30 percent. Actually, the slow-down in remittance in FY2014 was primarily a function of a 36 percent drop in the number of workers migrating in FY2013 due to a host of factors like change in Akama particularly in Soudi Arabia, G-G agreement regarding manpower migration especially in Malaysia, political uncertainty in Bangladesh as well. As the above factors appear to have waned in FY2014, remittance growth is likely to have usual momentum in this fiscal. Current Account Balance Figure C6: Current Account Balance in Million USD The current account balance (CAB) recorded a deficit of USD 1316 million during July-November 2014 compared to a surplus of USD 1127 million during the same period of the preceding fiscal. The deterioration in trade deficit (0.91 percent export fall along with 16.62 percent import rise) might be responsible to this and it is offset by a rise in remittances relative to July-November 2013. Supported by 35 a larger surplus in financial account combined with capital account surpassing the deficit in current account, the overall balance recorded a surplus of USD 1157 million. This contributed to foreign exchange reserves rise, reaching USD 22.3 billion at the end of the first half of FY2015 compared with USD 21.5 billion of end FY2014. Looking ahead to the second half of FY2015 our balance of payments projections show that there will be a correction in the pace of export growth as the existing outcome of export earnings appears to be the lag effect of cancelation garments order followed by political deadlock in the first half of FY2014 and destruction of Rana Plaza, along with a pick-up in imports as investor confidence grows. Bangladesh Bank also projects a solid remittance growth in the second half of FY2015. These assumptions along with the outcomes for the first half of FY2015 imply that for FY2015 the central bank projects overall export growth of 8 percent, import growth of 15 percent and remittance growth of 12 percent which will lead to a reasonable balance of payment surplus. However, starting from FY2015 in order to retain external sector stability it will be important for export and growth to pick-up as imports are likely to grow further. This will require coordinated activities to boost export diversification, change in destination, manpower exports, upgrading skills of migrants and enhanced incentives to use formal channels to remit and invest funds – Bangladesh Bank will continue its efforts in this regard. The overall current account balance (CAB) recorded a deficit of USD 1.26 billion during JulyNovember period of FY15 in contrast to a surplus of USD 1.23 billion during the same period of FY14. The CAB was negative during the period particularly owing to import growth outstripping export growth. Import payments grew by 14.6 percent to USD 16.40 billion while export earnings increased marginally by 0.9 percent to USD 11.92 billion, compared with the corresponding period of the previous fiscal year. Remittance inflows increased by 11.6 percent to USD 6.22 billion during July-November period of FY15 compared with USD 5.57 billion during the same period of FY14. Despite a reasonable remittance growth, the deficits in trade balance (-USD 4.48 billion), services account (-2.05 billion USD) and primary income account (-1.21 billion USD) exacerbate the CAB to a deficit. On the other hand, capital & financial account recorded a surplus of USD 2.96 billion during July-November period of FY15 which was remarkably higher than the surplus of USD 212 million during the corresponding period of FY14. Higher surplus in the financial account attributed mainly due to large surpluses in trade credit, FDI and MLT loans. Thus the overall balance of payment (BOP) posted a surplus of USD 1.16 billion during July-November period of FY15 along with a reserve of foreign exchanges of USD 22.04 billion at the end of November 2014. Avoiding excessive exchange rate volatility remains a key objective of Bangladesh Bank. The nominal value of the Taka against USD slightly depreciated by o.41 percentage points in the first half of FY2015 though there is scope for depreciation. As the domestic inflation rate be higher than that of the Bangladesh’s trading partners, real exchange rate data (corresponding to REER indices) remained much above the nominal exchange rate, indicating Taka is at overvalued position, eroding the competitiveness of exporters. However, Bangladesh Bank’s participations in the foreign exchange market have protected exporters by slowing the appreciation or in turn, helping depreciation of the Taka. Moreover by opening up working capital borrowing at lower interest rates from foreign sources to exporters in FY2013, and increasing the Export Development Fund size, as well as expanding the sectors eligible for the Fund, Bangladesh Bank is actively promoting export competitiveness. 36 Balance of Payment: An Overview Items FY2013 FY2014P Projected FY2015 (in million US$) -6806 -9910 29765 32146 36571 42057 -4189 -5609 3065 3096 7254 8705 -2571 -2828 171 188 2742 3016 14912 17000 79 100 14833 16900 Balance of Trade Export f.o.b (including EPZ) Import f.o.b (including EPZ) Balance of Services Receipts Payments Balance of Primary Income Receipts Payments Balance of Secondary Income Official transfers Private transfers -7009 26567 33576 -3162 2830 5992 -2369 120 2489 14928 97 14831 CURRENT ACCOUNT BALANCE 2388 1346 -1348 Capital Account 629 644 450 Financial Account 2770 3075 1540 Foreign Direct Investment Portfolio Investment Other Investment Net Aid Flows MLT loans MLT amortization payments Other long term loans Other short term loans Trade credit Commercial banks(DMBs &NBDCs) Errors and omissions 1726 368 676 1179 2085 906 -150 -193 -250 90 -659 1504 825 746 1259 2277 1018 418 355 -1045 -241 418 1600 700 -760 850 2200 1350 100 -250 -1350 -110 0 OVERALL BALANCE 5128 5483 642 Note: P=Provisional R=Revised 37 Foreign Direct Investment Figure C7: Foreign Direct Investment in Million USD The financial account shows that foreign direct investment in the first five months of FY2015 stood at USD 585 million compared with USD553 million in the same period of FY2014 - the pattern in FY2015 is likely to be dominated by reinvestment from existing firms such as Grameenphone, HSBC, Robi while new foreign firm entry is likely to have been limited given infrastructural constraints and persistent uncertainty in politics. Medium and long term loan disbursements in the first five months of FY2015 were USD748 million relative to USD641 million during the corresponding period of FY2014. Improved external balances are reflected in the accumulation of international reserves to over USD22 billion at the end of the first half of FY2015, sufficient to cover 5.5 months of projected imports. Foreign Currency Reserves Figure C8: Monthly Foreign Currency Reserves 38 Figure C9: Annual Foreign Currency Reserves and Monthly Import Cover Exchange Rates Figure C10: Exchange Rate: Amount of USD one Taka Can Buy In order to stabilize foreign exchange rate (Taka/USD), Bangladesh Bank continued its participation in the domestic foreign exchange market as required, with a net purchase of foreign currencies amounting to USD 986.45 million during the first half of FY2015. Consequently, the foreign exchange market remained stable during the first half of FY2015. 39 D: The Monetary and Financial Sector Assets and Monetary Aggregates The program targets and real achievements of net assets and monetary aggregates can be presented in the following table and charts. Table D1: Year on Year Growth (in Percent) of Monetary Aggregates Table 1: Monetary Aggregates (Y-o-Y growth in percent) Items 1. Net Foreign Assets@ 2. Net Domestic Assets Domestic Credit Credit to the public sector (incld. Govt.) Credit to the private sector 3. Broad money 4. Reserve money FY11 6.2 24.7 27.5 34.6 25.8 21.4 21.1 FY12 7.8 19.2 19.2 17.4 19.7 17.4 9.0 Actual FY13 50.1 11.1 10.9 11.1 10.8 16.7 15.0 FY14 38.6 11.0 11.6 8.8 12.3 16.1 15.4 Nov’14 26.6 9.4 11.3 6.0 12.7 12.8 14.3 ProgramR Dec.14 Jun.15 26.0 3.6 13.5 20.2 13.4 17.4 10.9 25.3 14.0 15.5 16.0 16.5 15.5 15.9 @ Constant exchange rates of June 2011 have been used. R=Revised Figure D1: Assets and Monetary Aggregates: Program and Actual Developments 40 41 Monetary growth targets for the first half of FY2015 stayed on track. Reserve money (RM) growth and growth of net domestic assets (NDA) of Bangladesh Bank, which are critical anchors of the monetary program, remained much above the program targets up to October 2014 mainly because of the rise of liquidity demand following two consecutive religious festivals. Afterwards RM and NDA of Bangladesh Bank are gradually coming closer to the program targets and RM reached even below the program line at the end of December 2014 though NDA still stayed above the targets. However, as growth of net foreign assets (NFA) is gradually coming down (and also supported by projected BOP for FY2015) RM growth is likely to be in line with the program targets by the end of FY2015. Broad money growth, however, broadly moves on consistently with the program targets (12.8 percent growth in November 2014 compared with 16.0 percent target as of December). Domestic credit growth also goes on consistently with the program target up to first quarter of FY2015 since public sector credit growth was above the program path while private sector credit fell short of the program targets. However, after the first quarter of FY2015, all monetary aggregates moved below the program paths. Broad money, domestic credit, credit to the public sector, credit to the private sector recorded 12.8 percent,11.3 percent, 6.1 percent and 12.7 percent growth at the end of November 2014 respectively against the targets of 16.0 percent, 13.4 percent, 10.9 percent and 14.0 percent by the end of December 2014. Private sector credit registered 12.7 percent growth at the end of November 2014 compared to the program growth of 14.0 percent at the end of December 2014. However, Bangladeshi corporates are now being allowed to tap foreign sources of financing. The addition of external borrowings with domestic borrowings implies that total private sector credit registered 14.3 percent growth at the end of November 2014. Political uncertainty and infrastructural bottlenecks are holding the pace of expected private investment back. Hence, the private sector credit growth remained below program target. Net foreign assets of the banking system also registered a 26.6 percent growth at the end of November 2014 against the program growth of 26 percent by the end December 2014. 42 Lending Rates and Deposit Rates Figure D2: Lending and Deposit Rates in Percent and the Spread Call money rates have leveled off and average retail interest rate spreads have fallen close to 5 percent. Call money rates have declined since their peaks in early 2012 when they were around 20 percent, and also fell in the second half of FY2013 from around 10 percent in January 2013 to around 7 percent in June 2013. They have since leveled off ranging from around 6.5-7.9 percent in the first half of FY2015 with some seasonal pikes. This is also reflected in below average advance to deposit ratios (70.45 percent) in November 2014. Figure D3: Call Money Rates in Percent At the retail level both deposit and lending rates rose in the second half of FY2014 and since then interest rate spreads have on average fallen – from 5.31 percent in June 2014 to 5.17 percent in November 2014 – we can infer that lending rates have fallen faster than deposit rates. Domestic lending rates have fallen due to lower cost of funds for banks, lower demand for credit as well as due to increasing competition from overseas lenders whose lending rates are in single digits. Bangladesh Bank will keep 43 on its effort in further reducing lending rates to make it tolerable to investor though there is limitation of cost of fund. However, infrastructural problem should be more focused on than interest rate while considering further investment. Figure D4: Interest Rate Spread in Percent The Yield Structure Figure D5: Yield Curves: A Comparative View (in Percent) The yield curve shows several yields or interest rates across different contract lengths for a similar debt contracts. It could be used as a bench mark for other debt in the market, and is also used to predict changes in economic growth. Virtually, the shape of the yield curve is what gives the investor an idea of future interest rate change and economic activity. A normal yield curve (upward sloping) reflects investor expectations for the economy to grow in the future, and importantly, for this growth to be associated with a greater expectation that inflation will rise in future rather than fall. The shape of yield curve of Bangladesh Bank remained the same normal during the first half of FY2015 (end June-end December 44 2014), reflecting fundamentally no changes in the business’s expectation. However, the interest rates of the lower maturity was higher on the curve at the end of December and as the maturity increases the interest rate also increases comparing with June end yield curve. Banking Sector Performance Figure D6: Return on Assets (ROA) in the Banking Sector Return on assets (ROA) was declining since December 2010 from 1.8 percent to 0.6 percent in June 2013. The ROA increased to 0.9 percent in December 2013 mainly because of the temporary relaxation of loan rescheduling policy from December 2013 to June 2014 (required provision for bad debt for the year 2013 was only Taka 46.1 billion, compared to Taka 86.4 billion for 2012). The ratio declined again to 0.61 percent at the end of June 2014 owing to maintaining higher provision for the increased amount of nonperforming loans and the net losses made by state commercial banks (SCB). However it is still near to the Basel II standard of 0.6 percent ROA. Figure D7: Capital Adequacy Ratio of Banks (Basel II Compliant) 45 Capital adequacy ratio (CAR) decreased to 10.6 percent at the end of September 2014 from 11.5 percent in December 2013 though surpassing the Basel accord of the minimum 10 percent capital adequacy ratio. Data show that while private commercial banks (PCB) and foreign commercial banks (FCB) are successfully maintaining the prevailing standard since December 2010, SCBs and specialized banks (SB) are still struggling to fulfill this regulatory requirement. Figure D8: Gross Nonperforming Loans as Percentage of Outstanding Loans The increasing trend in gross nonperforming loans of the banking sector started after December 2013 and continued during the first three quarters of 2014. The ratio increased to 11.6 percent at the end of September 204 from 8.9 percent at the end of December 2013. This rise happened because of implementation of the new guideline for loan classification and rescheduling after June 2014. In addition, the lack of profitability due to the uncertainties emanating from political factors contributed to this increased volume of nonperforming loans. Capital Market Developments Historical data on the general index of Dhaka Stock Exchange (DSE) shows that it started to decline from the highest peak of 8602.4 in November 2010 to 4342.3 at the end of July 2013. However, Dhaka Stock Exchange introduced the DSE Broad (DSEX) index instead of the DSE general index from August 2013. As per the index, it stood at 4865.0 at the end of December 2014, which is 8.6 percent higher than that at the end of June 2014 and 14.7 percent higher than that at end of December 2013. Although the ratio of market capitalization to GDP once rose to over 30 percent in the middle of 2010, it is regarded as the highest stage of the bubble before the bubble goes burst. But a sign of steady development in the capital market is evident since early 2013. 46 Figure D9: Capital Market Developments 47 PART IV: APPENDIX STUDIES POLICY NOTES 48 Annexure A: Pay Scale and Inflation: No Strong Pattern is Visible Reports on the proposed eighth national pay scales triggered a lot of controversy on its possible effects on inflation rates. Some economists and policymakers argue that it will create inflationary pressures while many others argue that it will not. An analysis of the causative factors of inflation around different pay scales will be a better guide in resolving this controversy, and therefore, the team investigated the causes of inflation during these pay scales as reported in the relevant issues of the Bangladesh Bank Annual Report. The team plotted the monthly average inflation rates since 1982 to see if there is a regular pattern in the association between pay scale and higher inflation that many people suspect to exist. The chart, however, did not indicate any clear or near one-to-one relationship. The inflation rates after the third and fourth pay scales showed downward trends though they were rising before the announcement. The fifth, sixth, and seventh pay scales, on the other hand, were followed by rising inflation rates. Despite the rising trends in the inflation rates in the recent three pay scales, it would be unwise to conclude that the eighth pay scale would also follow the suit. The history of the causes of high inflation rates as reported in various issues of Bangladesh Bank Annual Report finds that higher inflation rates were caused by a variety of factors during different pay scale periods. The major factors reported were: higher prices of oil and food items in the international market, distortions in supply side factors, natural calamities/disasters, political instability, and disruption in domestic and/or global food production. Other factors that were mentioned in Bangladesh Bank annual reports included effect of private credit expansion, high government borrowing, sharp depreciation of taka, disruption in industrial production, food supply shortage, and pay hikes. However, except a few well-documented factors such as oil price hike, high food prices in the international market, supply shortage owing to natural calamities or low global production, political instability it is difficult to clearly attribute to which factors led to higher 49 inflation. The following table lists the causes of inflation reported in Bangladesh Bank Annual Report during the third through the seventh pay scales: Pay scale Trend of Inflation 3rd (Aug'85) Down 4th (Sep'91) Down 5th (Oct'97) Up 6th (May'05) Up 7th (Dec'09) Up Causes Reported in Bangladesh Bank Annual Report Inflation slowed down owing to a marked slowdown in the growth of liquidity and domestic credit; Administered prices kept inflation in check despite pay hike Overall price situation improved because of price stabilization by the government; satisfactory production of food grains Shortfall in Aman production driving food prices up; Higher fuel and electricity prices, Increase in credit to the private sector Pay hike since June 2005; natural calamities disrupted supply of essential goods , High import prices of essential consumer goods and raw materials for industrial production Higher domestic food prices; rising prices of imported essentials in the international market, particularly, in neighboring countries Inflation rate trended down after announcement of third and fourth pay scales. The announcement of the third pay scale was followed by declining trend inflation because of a marked slowdown in liquidity and credit growth and government administered prices. Announcement of the fourth pay scale too was followed by government administered price stabilization policy. In addition, satisfactory production of food grains also caused inflation rate to decline. The fifth pay scale was followed by an upward trend in inflation caused by high food prices owing to a shortfall in Aman production, higher fuel and electricity prices, and increase in credit to the private sector. Announcement of the sixth pay scale in 2005 was followed by rising inflation due to pay hike, higher prices if essential goods caused by loss in production from natural calamities, and high import prices of essentials as well as raw materials for industrial production. Similarly, after the seventh pay scale we see an upward trend in inflation because domestic food prices and essential commodity prices were high in the international market, particularly, in neighboring countries during this period. Thus, a strong relationship between the announcement of the pay scales and inflation cannot be established. 50 Annexure B: Point to Point vs. Average Inflation Which one should be reported? Among the two types of inflation (point to point and average) measures sometimes we may confused about which one should be reported. Both numbers go in the same direction most of the time. Point to point inflation is important to show the direction in contemporary prices while 12-months average inflation gives a more general picture of the price level changes. The confusion arises when there is a sudden/one-shot vicissitudes in the nominal index values and the two inflation measures generates numerals of opposite direction. Chart-I shows both monthly and 12-months moving average values of a hypothetical series of consumer price index (CPI). The monthly nominal series has a trough in November 2011 and a spike in May 2013. However the average index smooth outs those ups and downs of the nominal values and keeps pace with the general trend of the series. Chart-II shows the series of point to point and average inflation. While the point to point inflation for November 2011 became negative due to the low index value, one year later in November 2012 it is artificially high (as in November 2012 the index had only a mediocre increase). The opposite happens between May 2013 and May 2014 due to the high index value in May 2013. Point to point inflation was more than 20 percent in May 2013 and became inaccurately negative in May 2014 (in fact from October 2013 CPI was increasing so economy was experiencing positive inflation in May 2014). Throughout the period average inflation remained positive and within the range of 5-12 percent which relates the general trend of the CPI. 51 Percent 22 20 18 16 14 12 10 8 6 4 2 0 -2 Chart II: Inflation 12 Month Point-to-Point 12 Month Average High Pto P inflation due to high index value in May 2013 Artificially high P to P inflation in Nov 2012 due to low index value in Nov 2011 Negetive P to P inflation due to low index Value in Nov 2011 Negetive P to P inflation in May 2014 due to high index value in May 2013 So, in such cases, it is more communicable to report the average inflation rate. 52 Annexure C: Bangladesh’s Growth Forecasting2 The objective of this exercise is to construct a univariate (ARIMA/ARMA) model for the output growth of Bangladesh. To this end, we have collected data on output growth of the country over a 39-year period from 1976 to 2014. In this note, year means fiscal year which runs from July to June. Before searching an appropriate model, it is important to know whether the data series is stationary or not. Phillips-Perron unit root test suggests that the series is stationary. Output Growth of Bangladesh: 1976- 2014 8 7 Growth Rate (%) 6 5 4 3 2 1 0 1980 1985 1990 1995 2000 2005 2010 Source: Bangladesh Bureau of Statistics Phillips-Perron Unit root test of Output Growth In level Variable Output Growth Intercept and trend -7.18 (0.00) Intercept -4.52 (0.00) Remark I(0) Note: The null hypothesis states that the variable has a unit root. Pvalues are shown in the parentheses following each adjusted tstatistic. Bold values indicate appropriate model. Since the growth series is stationary, we can proceed to find out the appropriate ARMA model. A number of literatures suggests that growth processes of many economies follow AR(1) process. Following this notion, we begin our exercise with AR(1) process. we find that the coefficient of AR(1) term is statistically significant, but the adjusted-R2 of the model is very low (10 percent). Moreover, after seeing the plot of residuals, we suspect that there might be a significant upward trend in the series. For this reason, we re-estimate the model after including a trend variable in the AR(1) model. Estimation results show that the trend coefficient is statistically significant but AR(1) coefficient becomes insignificant which makes the model inappropriate. We also include a moving average (MA) term in the model, as the possibility of a significant MA term cannot be ruled out. When we estimate the ARMA(1,1) with trend, AR(1) coefficient becomes statistically insignificant and the model suffers from heteroskedasticity problem which makes this model inappropriate. After some experiment, we find that ARMA (3, 2) including a time trend model is the most appropriate model. Results are presented in the following Table. All the coefficients of the model, except AR(1) and AR(3) terms, are statistically significant and adjusted-R2 is relatively high (68 percent). 2 This is an ongoing study carried out by four researchers in the Chief Economist’s Unit. 53 Diagnostic tests of the residuals indicate that the model is free of serial correlation, heteroskedasticity and non-normality problem. Even though two AR coefficients of the model are statistically insignificant, we keep them in the model to tackle the heteroskedasticity problem. Estimation with Output Growth in Bangladesh Variables Dependent Variable: Growth Coefficient 4.52 (0.00) -0.19 (0.28) -0.54 (0.00) 0.005 (0.97) 0.18 (0.00) 0.95 (0.00) 0.68 C Growth(-1) Growth (-2) Growth (-3) @Trend MA(2) Adjusted-R2 Serial Correlation Test 4.51 (0.21) 6.38 Q-stat at lag 8 (0.50) 9.80 Q-stat at lag 12 (0.55) Heteroskedasticity Test (Correlogram of Residuals Squared) 4.08 Q-stat at lag 4 (0.40) 6.85 Q-stat at lag 8 (0.45) 9.58 Q-stat at lag 12 (0.57) 0.66 Jarque-Bera Stat (0.72) Note: P-values are shown in the parentheses Q-stat at lag 4 Now, we can use the model to generate in-sample forecast and out-of-sample forecast of output growth of Bangladesh for the forecast horizon 2015 to 2018. To form the forecasts, we use dynamic method in which previously forecasted values for the lag dependent variables are used to form the next period’s forecast. Actual and Fitted Output Growth in Bangladesh 8 7 Growth Rate (%) 6 5 4 3 2 1 0 1980 1985 1990 1995 Actual Output Growth 54 2000 2005 Fitted Growth 2010 In-Sample Dynamic Forecast of Output Growth of Bangladesh: 1979-2014 8 7 Growth Rate (%) 6 5 4 3 2 1 0 1980 1985 1990 1995 Actual Output Growth 2000 2005 2010 Growth Forecast (Dynamic) Dynamic Forecast of Output Growth in Bangladesh: 2015-2017 8 7 Actual Growth Growth Forecast Growth Rate (%) 6 5 4 3 2 1 0 1980 1985 1990 1995 Actual Output Growth 2000 2005 2010 Forecasted Growth Forecast of Output Growth in Bangladesh Year Dynamic Forecast (%) Standard Error of Forecast Dynamic FY15 6.47 0.88 FY16 6.27 0.84 FY17 7.13 0.94 55 2015 Annexure D: Growth-Inflation Correlation and the Inflation Heat Map 14 No Correlation Strong Positive Correlation 12 10 8 6 4 2 Policy Anomalies Liberalization 0 1980 1985 1990 1995 2000 2005 2010 BD GDP Growth Rate in Percent Inflation The biggest impediment of monetary policy is that higher growth is often associated with higher levels of inflation particularly at the emerging stage of a Hyperinflation country. We observe this pattern since liberalization began at a faster pace in the early 1990s, as shown in the figure. The correlation over the entire sample or the pre-1991 sample is 16% weakly negative and highly insignificant. But the correlation 15% over the liberalization regime is 45 percent and the value is 14% statistically significant. 13% Hence, policymakers have to compromise on growth if 12% inflation is high. Alternatively, if inflation can be brought 11% High down to a comfortable zone, spurring growth through demand 10% Inflation creation or credit expansion becomes easier. 9% 8% In both India and Bangladesh, most policy documents 7% and studies on inflation regard the range between 4 to 6 6% percent as moderate inflation that appears to be supportive of growth and a better functioning of monetary policy and 5% Moderate financial markets. 4% Inflation 3% Accordingly, we can develop an inflation heat map as 2% Disinflation shown in the figure. The heat map claims that both high 1% inflation and deflation are deterrent to faster growth. A 0% moderate level of inflation has historically been supportive to -1% sustainable growth. -2% Deflation 56 DCP-01-2015-800


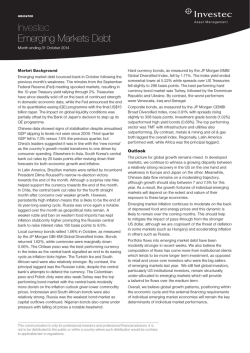
© Copyright 2026