
View PDF version
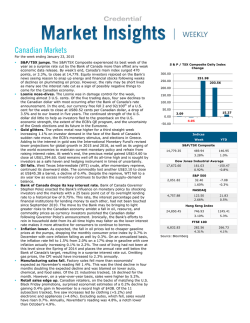
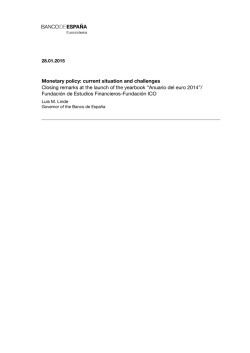
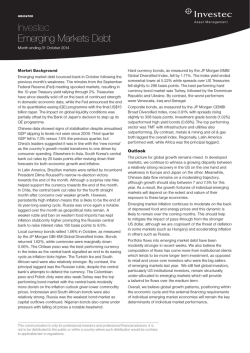
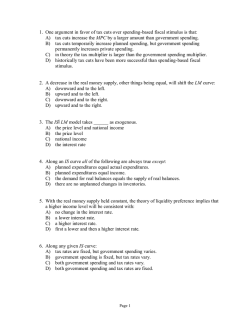
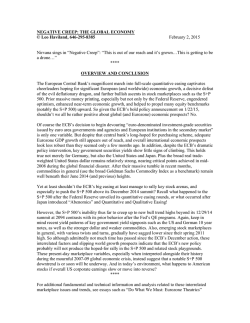
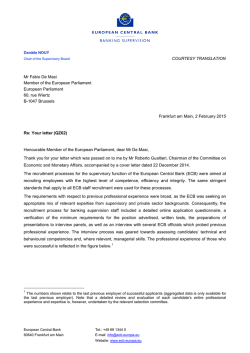
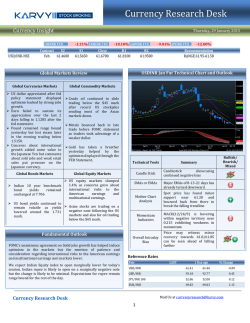
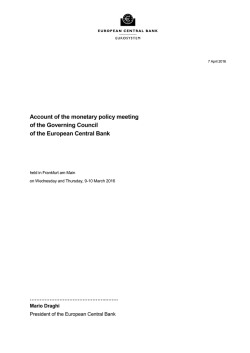
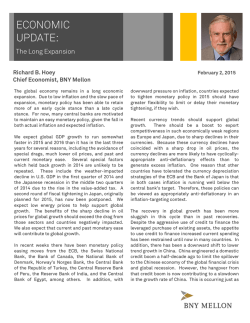
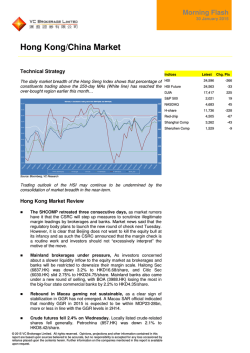
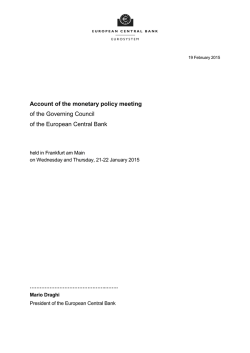
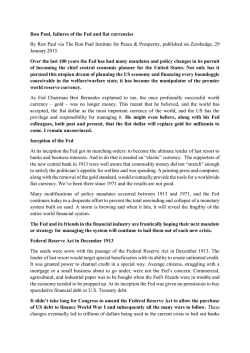
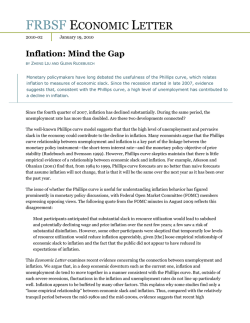
January 30, 2015
Northern Trust
Global Economic Research
50 South LaSalle
Chicago, Illinois 60603
northerntrust.com
•
Calculating the consequences of budget policies is a global headache
•
The recent round of central bank easing may continue for a while
•
Reports of a budding currency war are exaggerated
Carl R. Tannenbaum
Chief Economist
312.557.8820
[email protected]
Keeping score is sometimes a difficult thing. Millions of Americans cheered when bowling alleys
mercifully automated the accounting for strikes, spares and splits. Tennis confuses some people:
why are the first and second points in a game worth 15 and the third worth 10? With tallies
above the line and below the line, bridge makes it hard to get to the bottom line.
Nonetheless, the outcomes of these exercises are critically important. Will health care bankrupt
the American economy? Should Greece pursue growth or austerity? How big is the deficit in a
public pension system? The answers to all these weighty questions rest on some very fuzzy
math.
There are two stages to fiscal forecasting. The first requires establishing a baseline, which
depicts the most likely path of inflows and outflows using the laws and policies currently in
effect. The process requires assumptions about economic and market progress during the study
period.
Unfortunately, many of the most-pressing issues in public finance play out over a decade or
longer because of the government’s provision of retirement benefits and health care. Potential
forecast inaccuracies are compounded as each year passes.
State Pensions: Funded Ratio
Federal Debt at Different Rates of Growth
of Health Care Expenditures
160
80%
Extended Baseline With Economic Feedback
Investment return assumptions
Lower Growth Rate
are in parentheses
Higher Growth Rate
120
.
60%
Percent
Ieisha Montgomery
Senior Analyst
Country Risk
312-630-6984
[email protected]
But all these pale in comparison to the challenge of projecting the bottom line in a public
budget. Economic trends and economic policies, which are difficult to evaluate, drive revenues
and expenses. Past patterns may not be a good guide to future performance, and there are
countless interdependencies among variables. In a sense, fiscal projections are a nexus for all
the horrors forecasters face.
As a Percent of GDP
Asha G. Bangalore
Economist
312.444.4146
[email protected]
80
40%
20%
40
0%
0
1999
2009
2019
2029
2039
Milliman (7.5%)
State Budget
Solutions (3.2%)
Sources: CBO, Milliman, State Budget Solutions.org
The opinions expressed herein are those of the author and do not necessarily represent the views of The Northern
Trust Company. The Northern Trust Company does not warrant the accuracy or completeness of information contained
herein, such information is subject to change and is not intended to influence your investment decisions.
Two interesting illustrations are shown above. The retirement of the post-war generation will
prompt a shift from private to public medical coverage for many Americans. Demographics,
combined with inflation in the cost of care, threaten to produce significant increases in the U.S.
federal deficit. But health care inflation has been moderating of late; each 0.75% drop in annual
escalation reduces the projected government debt by more than $500 billion over the next
decade.
The second centers around rate-of-return assumptions for public pension systems. Many states,
counties and cities face shortfalls between expected returns and expected benefit payments in
their plans, with little time to close the gaps before the baby boom retirement boom begins in
earnest. The size of these deficiencies is dependent on the expected return on assets in the plan.
Without getting into the thorny question of what is reasonable in this arena, the funded ratio of
a defined benefit plan is incredibly sensitive to this particular parameter.
The challenges for forecasters only increase as we move to the second element of the exercise –
evaluating how policy changes might affect the outcome. Calculating the impact of proposed
measures on public budgets is referred to as “scoring.” Oftentimes, measures are scored
exclusively on the direct impact that they might have on revenue or spending; under this simple
rubric, a tax cut would be viewed as increasing the deficit.
But the hope of those who support lower taxes is that it would generate increased levels of
economic growth, broadening the tax base and producing additional revenue. To capture this,
some are advocating “dynamic” scoring to evaluate economic policies. The dynamic part refers
to indirect after-effects that might be captured to make the analysis more comprehensive.
The case for a more-dynamic approach might be found in the plight of Greece, which recently
elected a new prime minister who aims to turn away from austerity. The projections done by
Greece’s creditors seemed to underestimate the deleterious effect that budget cuts would have
on growth, leading to a painful contraction that contributed to the recent political turnaround.
Greece: Real GDP Growth
6
4
1.8
IMF Estimate in 2010
1.4
Percent change
0
-2
-4
-6
Impact of Tax Reform Act of 2014:
Real GDP Change (2014-2023)
1.6
2014 Actual = average of first 3 quarters
2
Percent Change
It’s difficult for
budget
forecasters to
hit a moving
target.
1.2
1.0
0.8
0.6
0.4
-8
0.2
-10
2010 2011 2012 2013 2014 2015
0.0
Model Model Model Model Model Model Model Model
1
2
3
4
5
6
7
8
Sources: IMF, Joint Committee on Taxation
The opinions expressed herein are those of the author and do not necessarily represent the views of The Northern
Trust Company. The Northern Trust Company does not warrant the accuracy or completeness of information contained
herein, such information is subject to change and is not intended to influence your investment decisions.
2
Dynamic scoring might have revealed that austerity that is too extreme damages the tax base to
a point that hinders the quest for budget balance.
Dynamic scoring
is more
comprehensive
but also more
vulnerable to
error or bias.
While theoretically meritorious, performing this expanded accounting is extraordinarily difficult.
For example, if taxes are cut, the heightened level of activity could threaten to become
inflationary. In that event, the central bank might tighten monetary policy to cool things down,
which would restrain the tax base.
This may seem hard to follow, but this is a simple depiction of a much more intricate string of
causes and effects that can take many years to evolve. Even if the direction of these influences is
known, their magnitudes are very difficult to estimate with precision. Different models may
come up with vastly different conclusions, as shown in the chart above examining the tax reform
proposal that Congress considered last year.
Opponents of dynamic scoring cite this uncertainty as a reason to continue with the simpler
approach. There is also valid concern that the analyst’s political leanings may steer the
assumptions used to evaluate policies dynamically.
Many governmental entities around the world are being challenged to establish their long-term
solvency. Getting the scoring right will be essential to the integrity of these efforts. This is no
game; world markets have a lot riding on the outcome.
A Round of Cuts
The announcements out of the Swiss National Bank (SNB) and European Central Bank (ECB) in
the last couple of weeks initiated a chain of similar moves from other central banks. Some
observers worry that the easing cycle might spin out of control. Yet, thus far, the initial round of
reactions has been measured.
Part of the calm is most likely due to the fact that while larger than expected, the ECB’s
quantitative easing (QE) program was long-awaited, and the announcement was carefully staged
with several leaks in the days prior. This foreshadowing was a welcome change from the abrupt
move seen in Switzerland a week earlier.
Central bank actions in the aftermath of the SNB and ECB announcements can be divided into
two camps: those that must react to the ECB movements and those that are acting mainly as a
result of domestic factors.
In the first camp are countries that try to sustain a peg to other currencies. Denmark has
maintained a peg since 1982, and so Denmark’s Nationalbank has responded to Danish krone
appreciation by cutting its deposit rate 45 basis points over the course of three rate decisions in
the last two weeks. The Danish have the tools and balance sheet space to maintain the peg.
Several other areas, including Saudi Arabia and Hong Kong, have currency pegs. Both are pegged
to the U.S. dollar and have shown few signs of stress. In the Saudi case, the riyal is hard pegged
at 3.75/USD. The HK$ is currently pegged at $7.80 to the US$1. The arrangement requires the
Hong Kong dollar monetary base to be 100% backed – and changes in it to be 100% matched –
by corresponding changes in U.S. dollar reserves held in the Exchange Fund.
The opinions expressed herein are those of the author and do not necessarily represent the views of The Northern
Trust Company. The Northern Trust Company does not warrant the accuracy or completeness of information contained
herein, such information is subject to change and is not intended to influence your investment decisions.
3
Upcoming Central Bank Decisions
CENTRAL BANK
POLICY RATE*
OUTLOOK FOR FIRST QUARTER
European Central Bank
0.05%
No Changes Expected
Bank of England
0.50%
No Changes Expected
Bank of Japan
0-0.10%
No Changes Expected
Reserve Bank of Australia
2.5%
25 basis point cut possible in February
Reserve Bank of New Zealand
3.5%
No Changes Expected
Bank of Canada
0.75%
25 basis point cut possible in March
Bank of Korea
2%
25 basis point cut possible in February
* Source: Haver Analytics/National Central Banks
Further afield, central bank decisions have generally focused on domestic concerns. Outside of
the United States, growth has been sluggish and the largest external issue weighing on
governments is not the SNB or ECB, but oil prices.
The Bank of Canada’s surprise 25 basis-point cut to 0.75% was primarily driven by a morecautious economic outlook tied to the impact of lower oil prices on investments, exports and
households.
The global
trend toward
monetary
easing gathers
steam.
Likewise, the Monetary Authority of Singapore’s (MAS) decision to ease monetary policy by
reducing the slope of its policy band for the Singaporean dollar (S$) was a response to a
deteriorating inflation outlook caused by the fall in global commodity prices. Monetary policy in
Singapore currently aims for “modest and gradual appreciation” of the S$ against an undisclosed
trade-weighted basket of currencies. But the MAS could switch to a zero-appreciation policy if
economic growth sputters.
The Reserve Bank of India cut its repo rate, its key lending rate, by 25 basis points to 7.75%
earlier this month. However, the move came ahead of the SNB and ECB announcements and was
aimed at bolstering growth. The bank expressed confidence that is winning its battle with
inflation – thanks to lower oil prices – and could therefore focus on boosting flagging growth.
New Zealand dropped its tightening stance last week and announced its expectation that
interest rates will remain on hold for “some time.” To the west, the Reserve Bank of Australia
(RBA) has a meeting next week, and the outcome is currently too close to call. The bank’s
preferred inflation measure is within the 2% – 3% target range, but the sluggish non-mining
economy could push the RBA to cut. On the other side, the surging Australian real estate market
could keep rates on hold.
We can almost certainly expect a number of central bank actions in the months to come. This is
yet another byproduct of the global energy price realignment. Anticipation of these movements
could cause some incremental market volatility, and the capital flows that occur in reaction to all
these changes will be important to watch.
The opinions expressed herein are those of the author and do not necessarily represent the views of The Northern
Trust Company. The Northern Trust Company does not warrant the accuracy or completeness of information contained
herein, such information is subject to change and is not intended to influence your investment decisions.
4
Does Currency Competition Exist?
Yesterday’s Wall Street Journal ran a headline, “Central Bankers Ramp Up Currency Wars.”
Similar views emerged when Japan undertook aggressive monetary policy actions in 2013 and
the Federal Reserve implemented QE programs. The ECB’s QE initiative is the latest culprit for
such proclamations. Is it accurate to represent these exchange-rate movements as a currency
competition?
The euro has declined about 20% vis-à-vis the dollar since June 2014. The pace of depreciation
accelerated after the ECB’s announcement. Other currencies also posted significant declines in
this time period, and currency market volatility has risen noticeably.
U.S. Dollar Trend
Index, Exchange rate set=100 on June 2, 2014
Currency
realignment
is inevitable
as countries
address their
domestic
objectives.
120
110
JPM Currency Volatility Index
12
130
Euro
Rupee
Real
Yuan
Yen
10
8
6
100
90
80
4
2
0
Source: Haver Analytics, Bloomberg
In a global exchange-rate system consisting of largely flexible exchange rates, accommodative
monetary policy leads to a reduction of interest rates, a weaker currency and capital outflows. A
depreciation of the currency results in export growth, with a lag.
But this should be viewed as a side effect and not an objective. Over the longer term, if
monetary easing results in stronger growth and more-normal levels of inflation, a country’s
currency will once again strengthen. Any capital that has departed will return in response.
If recipients of capital inflows also face weak demand and low inflation, they should be in a
position to ease monetary policy and offset the pressures of currency appreciation. But if
inflation is problematic, short-term strategies such as capital controls are an option.
A few countries, such as Indonesia, Mexico, Chile, Brazil, have currency stability as part of their
central bank mandate and they typically respond with appropriate actions to manage their
currencies. So they may have a prescribed reaction function.
But while it may seem as if other central banks are reacting competitively to what the ECB has
done, all the changes seen in the last several weeks can be explained by the global trend toward
disinflation. Claims of a currency war were erroneous when the Fed undertook quantitative
easing, and they are equally unfounded now.
The opinions expressed herein are those of the author and do not necessarily represent the views of The Northern
Trust Company. The Northern Trust Company does not warrant the accuracy or completeness of information contained
herein, such information is subject to change and is not intended to influence your investment decisions.
5


© Copyright 2026