
FACTSHEET - Solactive US High Dividend Low Volatility Index 30.1
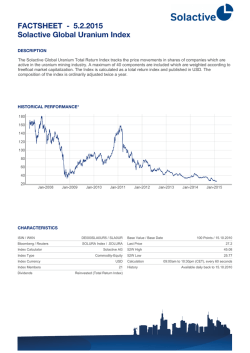
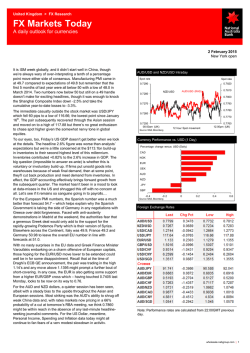
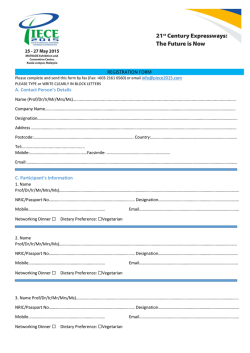
FACTSHEET - 5.2.2015
Solactive US High Dividend Low Volatility Index
BESCHREIBUNG
HISTORISCHE WERTENTWICKLUNG*
STAMMDATEN
ISIN / WKN
Bloomberg / Reuters
DE000SLA2DV9 / SLA2DV
- / 10.07.2009
Aktueller Stand
212.11
Index Berechner
Solactive AG
52W Hoch
213.89
Index Typ
Price Return
52W Tief
Index Währung
Index Komponenten
Dividenden
SOLHDLV Index / .SOLHDLV
Basiswert / Basisdatum
USD
40
No reinvestment
Berechnung
Historie
172.46
09:30am to 04:50pm (EST), every 15 seconds
Available daily back to 10.07.2009
FACTSHEET - 5.2.2015
Solactive US High Dividend Low Volatility Index
STATISTIKEN
in USD
Performance
Performance (p.a.)
30T
90T
3.5%
52.3%
lfd. J
Seit
Auflage
21.6%
3.0%
109.0%
21.9%
35.0%
14.1%
180T
360T
2.1%
9.3%
8.6%
19.7%
Volatilität (p.a.)
10.6%
11.1%
10.2%
9.1%
10.5%
11.4%
Hoch
213.89
213.89
213.89
213.89
213.89
213.89
Tief
204.90
199.21
194.01
174.44
204.67
101.50
4.92
0.77
1.91
2.40
3.32
1.18
-2.2%
-4.4%
-4.4%
-4.4%
-2.2%
Sharpe Ratio
Max. Drawdown
VaR 95 \ 99
CVaR 95 \ 99
WÄHRUNGS EXPOSURE
-11.5%
7.0% \ 0.9%
-4.6% \ -12.4%
3.2% \ -2.2%
-9.4% \ -16.3%
LÄNDER EXPOSURE
TOP KOMPONENTEN
Ticker
Währung
Land
Firma
Gewicht
GE UN Equity
USD
US
GENERAL ELECTRIC CO
10.34%
T UN Equity
USD
US
AT&T
10.18%
VZ UN Equity
USD
US
VERIZON
9.93%
PM UN Equity
USD
US
PHILIP MORRIS INTERNATIONAL
8.91%
MO UN Equity
USD
US
ALTRIA GROUP INC
7.34%
DUK UN Equity
USD
US
DUKE ENERGY CORP
6.33%
SO UN Equity
USD
US
SOUTHERN COMPANY THE
6.08%
VTR UN Equity
USD
US
VENTAS INC
3.99%
PPL UN Equity
USD
US
PPL CORP
3.59%
HCN UN Equity
USD
US
HEALTH CARE REIT INC
3.35%
HCP UN Equity
USD
US
HCP INC
2.53%
CNP UN Equity
USD
US
CENTERPOINT ENERGY INC
2.38%
O UN Equity
USD
US
REALTY INCOME CORP
2.08%
AGNC UW Equity
USD
US
AMERICAN CAPITAL AGENCY CORP
2.04%
NLY UN Equity
USD
US
ANNALY CAPITAL MANAGEMENT INC
1.67%
FACTSHEET - 5.2.2015
Solactive US High Dividend Low Volatility Index
Realtime Preise, einen Index Guide sowie weitere Informationen finden Sie auf www.solactive.com
* Past performance is no guarantee of future results and may be lower or higher than current performance. Index returns are no guarantee for any returns of financial products linked to the
index. Any performance information regarding financial products linked to the index can reflect temporary waivers of expenses and/or fees and does not include insurance/annuity fees and
expenses.
This info service is offered exclusivley by Solactive AG, Guiollettstr. 54, D-60325 Frankfurt am Main, E-Mail [email protected] | Disclaimer: All our activities as an aquisition agent and
investment adviser (in accordance with § 1 Article 1a No. 1, 1a and 2 of the German Banking Act / KWG) in the capacity of a "contractbound agent" are subject to the liability of Exclusive
Private Finance GmbH, Gaisbergstrasse 40, 69115 Heidelberg, Germany (§ 2 Article 10 German Banking Act / KWG). This document is for the information and use of professional advisers
only. Remember, the information in this document does not constitute tax, legal or investment advice and is not intended as a recommendation for buying or selling securities. The information
and opinions contained in this document have been obtained from public sources believed to be reliable, but no representation or warranty, express or implied, is made that such information is
accurate or complete and it should not be relied upon as such. Solactive AG and all other companies mentioned in this document will not be responsible for the consequences of reliance upon
any opinion or statement contained herein or for any omission. | © Solactive AG, 2013. All rights reserved.
© Copyright 2026