
role of sulfur, silicon and carbon on the crystallization processes in
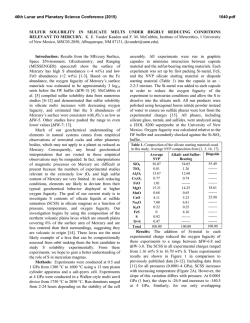
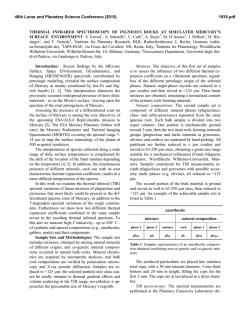
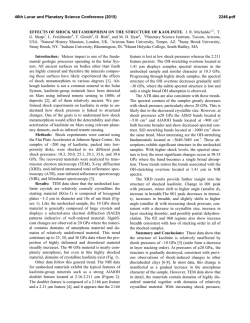
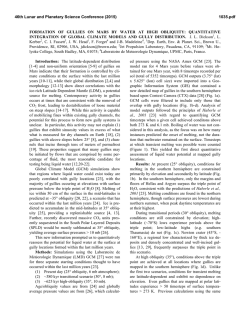
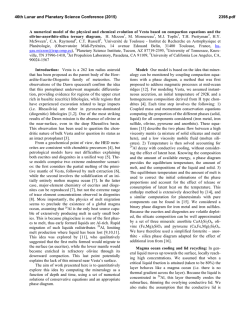
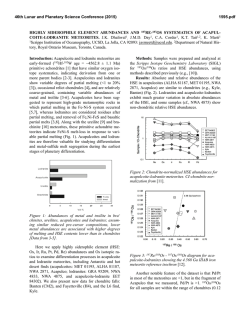
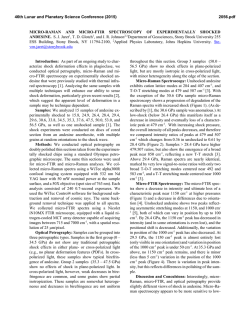
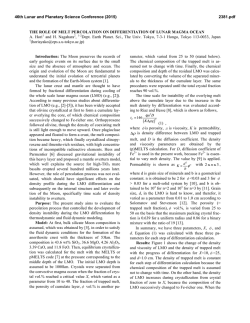
46th Lunar and Planetary Science Conference (2015)
2627.pdf
ROLE OF SULFUR, SILICON AND CARBON ON THE CRYSTALLIZATION PROCESSES IN
MERCURY’S CORE INFERRED FROM IN-SITU MELTING EXPERIMENTS BETWEEN 4.5 AND 15.5
GPA. A. M. Martin1, J. Van Orman1, S. A. Hauck, II1, N. Sun1, T. Yu2 and Y. Wang2, 1Case Western Reserve University, 10900 Euclid Avenue, Cleveland OH 44106 USA ([email protected]), 2University of Chicago,
GSECARS, Argonne National Laboratory, 9700 South Cass Avenue, Argonne IL 60439 USA.
Introduction: The formation and evolution of
Mercury’s large metallic core is poorly understood.
Based on the evolution of the melting temperature as a
function of pressure in the Fe-S system, a top-down
crystallization processes (iron “snow”) has been suggested, which does not occur in larger terrestrial planets like the Earth [1-3]. In order to test this atypical
process in a system that is likely to be closer to a natural core composition, we recently constrained the eutectic melting temperature in the Fe-FeS-Fe3C system,
which we found to be very low (800-900°C) between
4.5 and 24 GPa [4] (Figure 1). Recent results from the
MESSENGER mission indicate extremely reducing
conditions in Mercury, under which a substantial
amount of silicon should also dissolve into the core
[5]. The presence of Si could significantly modify the
chemical and physical properties of Mercury’s core
(e.g., phase relations, crystallization, and density). According to [5-7], the liquidus in the 74 wt.% Fe - 18
wt.% S - 8 wt.% Si system is located at ~1800°C at 15
GPa, increasing to 2000°C above 25 GPa. By extrapolation, they suggest that the liquidus is located above
1600°C at the pressure of Mercury’s core/mantle
boundary (5-7 GPa). The solidus temperature is estimated to be around 1450°C at 20 GPa [6]. No data are
available on the liquidus and solidus temperatures below 15 GPa. [8] observed melting above 1200°C at 5
and 10 GPa in the 87.81 wt.% Fe – 14.62 wt.% S –
4.62 wt.% Si – 0.99 wt.% C system; however, they did
not constrain the liquidus and solidus temperature.
In order to test the iron snow hypothesis in a system that takes into account sulfur, silicon and carbon,
we performed in-situ high-pressure, high-temperature
experiments in the Fe-FeS-Fe2Si-Fe3C system using a
multi-anvil press on a synchrotron. Our experiments
allow us to constrain the eutectic melting temperature
as a function of pressure and to determine melt compositions, and provide a basis to build a complete phase
diagram that can be used to model Mercury’s core
crystallization.
Experimental method: In order to observe low
degree eutectic melting, we separated the samples into
two parts: (1) an iron rod presaturated with Si and C
and (2) a mixture of FeS, Fe2Si and Fe3C. Eutectic
melting temperature and phase relations were determined at various pressures between 4.5 and 15.5 GPa
using a 1000-ton mutli-anvil apparatus at the Advanced Photon Source, Argonne (13-IDD). A 10/5
(octahedron edge length / WC cubes TEL) assembly
was used for all the experiments. The sample was
placed in a BN capsule plugged by BN powder. Temperature was measured using a W5Re95-W74Re26 thermocouple crossed at one end of the sample. Pressure
calibrations were made during each experiment using a
MgO pressure marker. A cylindrical rhenium foil was
used as furnace. It was separated from the MgO octahedron using a LaCrO3 insulating sleeve. In addition,
graphite windows were inserted into the Re furnace
and LaCrO3 sleeve on the X-ray beam path. During the
experiments, the pressure was first increased to the
desired value. Then, the temperature was increased by
increments in order to regularly take X-ray images and
diffraction spectra of the sample. Temperature was
quenched soon after the melting was observed, so that
eutectic melting textures would be preserved.
Figure 1: Pressure – temperature diagram showing the
eutectic melting curve in the Fe-S-Si-C system (this
study) compared to the Fe-S-C system [4]. Previous
studies on the Fe-S-C [8, 9], Fe-S-Si [6], Fe-S [1] and
Fe-Fe3C [10] systems from the literature are reported
for comparison.
Analyses: Energy dispersive X-Ray diffraction
spectra were collected for 300s at various stages during the experiments. 2-θ was calibrated at ambient
pressure during each experiment. Spectra of MgO
were fitted using [11]. X-ray images were also taken at
various stages in order to observe the decrease of con-
46th Lunar and Planetary Science Conference (2015)
trast between the two parts of the sample that occurs
when the melting temperature is reached. After the
experiments, the recovered samples were mounted in
epoxy resin, ground to the longitudinal mid-section
and polished using Al2O3 powder. Back-scattered electron images and quantitative analyses were performed
using an energy dispersive spectrometer and a silicon
drift detector on a FEI Nova Nanolab 200 Scanning
Electron Microscope. The standards used for Fe, S, C,
Si and O were iron Fe, iron sulfide FeS, iron carbide
Fe3C, quartz SiO2 and alumina Al2O3, respectively.
Figure 2: Back-scattered electron images of the FeSrich melt (left) and FeSi-rich melt (right) textures.
Results: The X-ray images, diffraction spectra and
back-scattered electron images of the recovered samples show that the eutectic melting occurs around 800 900°C between 4.5 and 15.5 GPa. Immiscibility between a FeS-rich melt and a FeSi-rich melt is observed
in the recovered samples (Figure 2). FeSi-rich melt is
present in all the samples below 12 GPa, while FeSrich melt forms up to at least 15.5 GPa. This lower
stability pressure of the FeSi-rich melt is in agreement
with the phase diagram in the Fe-S-Si system [5].
Analysis of the immiscible melts indicates that C preferentially partitions into the FeSi-rich melt, rather than
in the FeS-rich melt (Figure 3). Solid Fe, FeS, Fe3Si
and Fe3C are also present in all the samples.
Discussion: The eutectic melting temperatures determined in this study are close to the eutectic temperatures in the Fe-FeS-Fe3C system, indicating that Si
does not influence the eutectic temperatures significantly. Melting therefore occurs at much lower temperature than suggested for the Fe-S-Si [5] system at
similar pressures. This difference may be explained by
the presence of C in the samples. It is also possible that
the eutectic temperature is overestimated significantly
in quench experiments; our experimental setup may be
more suitable for detecting the low degrees of melting
in metallic systems.
2627.pdf
Figure 3: Ternary diagrams showing the Fe, S, Si and
C contents (at%) in the FeSi-rich melts (red) and FeSrich melts (pink) formed in the Fe-S-Si-C system (this
study), compared to the FeS-rich melt formed in Fe-SC system (blue) from [4]. The cotectic curves determined by [8] are also reported for comparison.
Implications for Mercury’s core: The variations
of eutectic melting temperature observed by [2] in the
Fe-S system are not observed in the presence of C and
Si. However, the eutectic melting temperature is systematically lower, and it slightly decreases when pressure increases (Figure 1). This slightly negative eutectic melting temperature gradient with pressure implies
that an iron “snow” process may be important if sulfur,
silicon and carbon are all alloyed with Fe in Mercury’s
core. Furthermore, the low melting temperatures in the
Fe-S-Si-C system may also aid in maintaining a substantial liquid portion of Mercury’s core to the present
and in limiting the amount of global contraction [12]
that is due to solidification of the core [13, 14].
References: [1] Chen et al. (2008) GRL, 35,
L07201 [2] Chen et al. (2008) High Press. Res., 28,
315-326 [3] Dumberry and Rivoldini (2015) Icarus,
248, 254-268 [4] Martin et al. (2014) LPSC XLV, Abstract # 2854 [5] Malavergne et al. (2010) Icarus, 206,
199-209 [6] Sanloup and Fei (2004) PEPI, 143-144,
421-432[7] Siebert et al. (2004) [8] Deng et al. (2013)
GCA, 114, 220-233 [9] Dasgupta et al. (2009) GCA,
73, 6678-6691 [10] Nakajima et al. (2009) Phys. Earth
Planet. Mat., 174, 202-211 [11] Speziale et al. (2001)
JGR, 106, 515-528. [12] Byrne at al. (2014) Nature
Geosci., 7, 301-307 [13] Tosi et al. (2013) JGR Planets, 118, 2474-2487 [14] Hauck et al. (2004) EPSL,
222, 713-728.

© Copyright 2026