
Thermal Infrared Spectroscopy of Igneous Rocks at Simulated
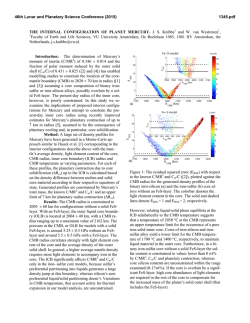
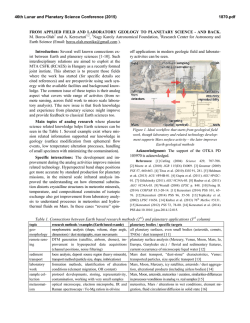
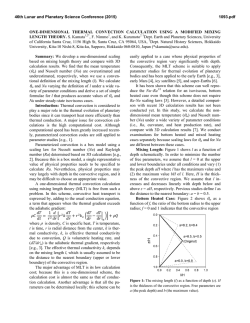
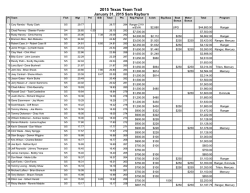
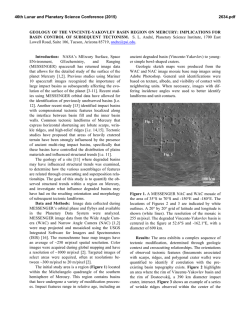
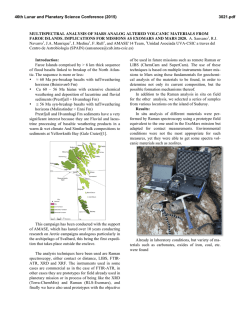
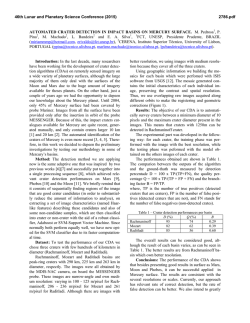
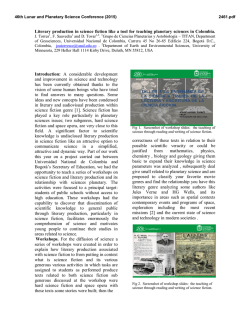
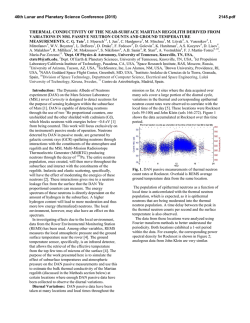
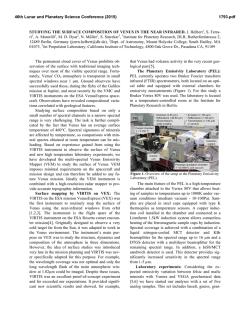
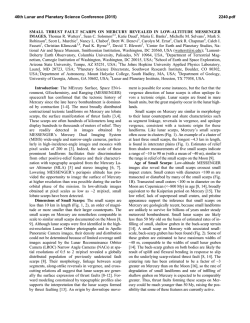
46th Lunar and Planetary Science Conference (2015)
1935.pdf
THERMAL INFRARED SPECTROSCOPY OF INGNEOUS ROCKS AT SIMULATED MERCURY’S
SURFACE ENVIRONMENT S. Ferrari1, A. Maturilli1, C. Carli2, A. Stojic3, M. D’Amore1, J. Helbert1, H. Hiesinger3, and F. Nestola4, 1Institute for Planetary Research, DLR, Rutherfordstrasse 2, Berlin, Germany ([email protected]), 2IAPS-INAF, via Fosso del Cavaliere 100, Roma, Italy, 3Institute for Planetology, Westfälische
Wilhelms-Universität, Wilhelm-Klemm-Str. 10, Münster, Germany, 4Geosciences Department, Università degli Studi di Padova, via Gradenigo 6, Padova, Italy.
Introduction: Recent findings by the MErcury
Surface, Space ENvironment, GEochemistry, and
Ranging (MESSENGER) spacecraft, corroborated by
petrologic modeling, revealed the surface composition
of Mercury as mainly constituted by low-Fe and Mgrich basalts [1, 2]. This interpretation dismisses the
previously assumed widespread presence of more felsic
materials - as on the Moon’s surface - leaving open the
question of the crust petrogenesis of Mercury.
Assessing the presence of a differentiated crust on
the surface of Mercury is among the core objectives of
the upcoming ESA/JAXA BepiColombo mission to
Mercury [3]. The ESA Mercury Planetary Orbiter will
carry the Mercury Radiometer and Thermal Imaging
Spectrometer (MERTIS) covering the spectral range 714 µm to map the surface mineralogy of the planet at
500 m spatial resolution.
The interpretation of spectra collected along a wide
range of daily surface temperatures is complicated by
the shift of the location of the band minima depending
on the temperature [4, 5]. In addition, the simultaneous
presence of different minerals, each one with its own
characteristic thermal expansion coefficient, results in a
more difficult interpretation of the spectra.
In this work we examine the thermal infrared (TIR)
spectral variations of linear mixtures of plagioclase and
pyroxenes that most likely could be present in the differentiated igneous crust of Mercury, in addition to the
T-dependent spectral variations of the single constituents. Furthermore we show how two different thermal
expansion coefficients combined in the same sample
reveal in the resulting thermal infrared spectrum. To
this aim we measure high-T emissivity - up to 450° C of synthetic and natural compositions (e.g., anorthosite,
gabbro, norite) and their components.
Sample Sets and Methodologies: The sample sets
includes mixtures, obtained by mixing natural minerals
of different origins, and co-genetic mineral compositions occurred in natural bulk rocks. Mineral chemistries are acquired by microprobe analyses, and bulk
rock compositions are verified by polarization microscopy and X-ray powder diffraction. Samples are reduced to <125 µm: the selected particle-size class cannot be totally immune to thermal gradient effects and
volume scattering in the TIR range, nevertheless it approaches the presumable size of Mercury’s regolith.
Mixtures. The objective of this first set of samples
is to assess the influence of two different thermal expansion coefficients on a vibrational spectrum, regardless of the different petrologic origin of the selected
phases. Natural single-phase crystals are reduced in a
jaw crusher and then sieved to <125 µm. Then linear
mixtures are obtained, simulating a normalized content
of the primary rock-forming minerals.
Natural compositions. The second sample set is
composed of different mineral phases (plagioclases,
clino- and ortho-pyroxenes) separated from the same
igneous rock. Each bulk sample is divided into two
equal volumes. One portion is mechanically ground
toward 2 mm, then the two main rock-forming minerals
groups (plagioclase and mafic minerals as pyroxenes,
olivines and oxides) are separated by hand-picking. All
partitions are further reduced in a jaw crusher and
sieved to 63-250 µm sizes, obtaining a grain-size range
suitable for a mechanical refinement (Frantz Magnetic
Separator, Westfälische Wilhelms-Universität, Münster). Samples considered for TIR measurements include plagioclases and pyroxenes with possible accessory mafic phases (e.g. olivine), all reduced to <125
µm.
The second portion of the bulk material is ground
and sieved as well to 63-250 µm sizes, then reduced to
<125 µm. An example of the achievable sample sets is
listed in Table 1.
anorthosite
mixture
natural composition
phase 1
phase 2
mixture
rock
phase 1
phase 2
pl100
pl0
pl90
plx
pl100
pl100-x
Table 1: Samples representative of an anorthositic composition obtained combining non-co-genetic and co-genetic minerals.
The produced particulates are placed into stainless
steel cups, with a 50 mm internal diameter, 5 mm thick
bottom and 20 mm in height, filling the cups for the
first 3 mm. The cups are at last placed in a dryer chamber.
TIR spectroscopy. The spectral measurements are
performed at the Planetary Emissivity Laboratory (In-
46th Lunar and Planetary Science Conference (2015)
stitute of Planetary Research, Deutsches Zentrum fuer
Luft- und Raumfahrt, Berlin) [6]. The instrument used
is a Bruker Vertex 80V, with a liquid nitrogen cooled
HgCdTe detector and a KBr beamsplitter.
The spectrometer is coupled to an evacuated planetary simulation chamber, where the steel sample cups
are heated via an induction system [4]. Samples are
heated once and emissivity are collected under a pressure of 1 mbar at 150°C, 250°C, 350°C and 450°C
with increasing temperatures, then during the cooling
maintaining the temperature at 250°C. Radiance is collected by an Au-coated parabolic 90° off-axis mirror
and reflected to the spectrometer, which acquires spectra between 10000 and 615 cm-1 at a resolution of 4
cm−1. Measurements of the calibration body are taken
at the same temperatures as the sample. Within the
chamber, an iron buffer is provided in order to avoid
any possible Fe oxidation during the annealing (Fig.1).
Besides spectroscopy, all the provided samples are
analyzed before and after the heat-treatment using XRay Diffraction, in order to verify any possible variation due to the annealing.
Figure 1: Sample is placed within the chamber; the temperatures of the radiative surface, the chamber walls and the mirror are constantly monitored; the iron buffer is placed in the
proximity of the sample.
The objectives of this specific set-up are (i) preventing any possible variation of the sample during the
heating, (ii) reaching the maximum temperature variation achievable by the PEL set-up within the range
suggested for the surface of Mercury, (ii) verifying any
possible variation occurred during the entire experiment.
Results: Here we show a first example of anorthosite. Spectra of (i) a mixture constituted by 90 wt.% of
Ca-rich plagioclase (labradorite) and 10 wt.% of Mgrich clinopyroxene (augite) and (ii) a reduced anor-
1935.pdf
thositic rock sample are collected under the same conditions.
Compared to the lower-temperature (i.e. 150°C)
labradorite spectrum, the lower-temperature mixture
spectrum shows a slight flattening and a shift of the
first reststrahlen band towards lower wavenumbers,
assimilating the contribution of the Mg-rich clinopyroxene (augite) emissivity.
With increasing temperature, sample spectra tend to
increase the band depths, and shift the minima with
different magnitude to lower wavenumbers (Fig. 2).
The absorptions in the 900-1200 cm-1 region, which are
due to Si-O stretch motions of the silica tetrahedra in
the structure, display the most significant shifts. A preliminary comparison between the synthetic anorthosite
and a natural one confirms the same trend for the main
absorption bands (Fig. 2).
Figure 2: Changes in the position of the first absorption
band as a function of temperature for the mixture (full
squares, 1124 cm-1 position for 1-R room-temperature minimum) and the natural anorthositic sample (empty squares).
Further observations include the shift of the Christiansen feature (CF) toward higher wavenumbers, the
increase of depth for most of the bands relative to the
continuum removal, and the stasis or disappearance of
bands located in the 600-900 cm-1 range with increasing temperatures.
References:
[1] Nittler L. R. et al. (2011) Science, 333, 1847–
1850. [2] Stockstill-Cahill. et al. (2012) J. Geophys.
Res., 117, E00L15. [3] Benkhoff J. et al. (2010) PSS,
58, 2-20. [4] Helbert J. et al. (2013) EPSL, 371-372,
252-257. [5] Ferrari et al. (2014) Am. Min., 99, 786792. [6] Maturilli A. et al. (2008) PSS, 56, 420-425.

© Copyright 2026