
The Role of Melt Percolation on Differentiation of Lunar Magma Ocean
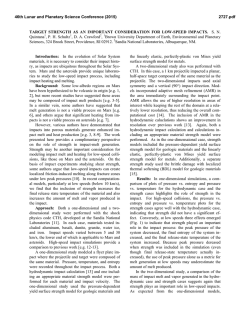
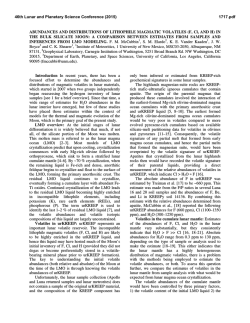
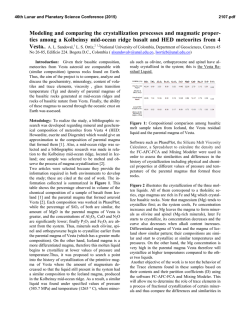
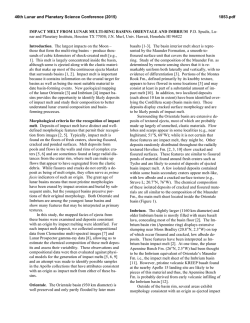
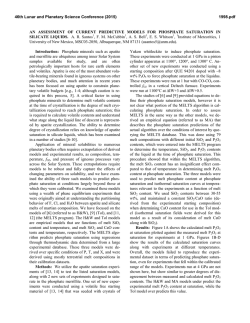
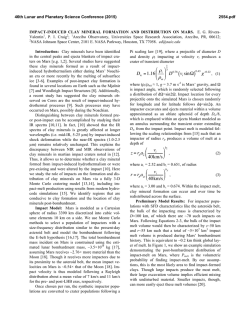
46th Lunar and Planetary Science Conference (2015)
2381.pdf
THE ROLE OF MELT PERCOLATION ON DIFFERENTIATION OF LUNAR MAGMA OCEAN
A. Hori1 and H. Nagahara2, 1-2Dept. Earth Planet. Sci., The Univ. Tokyo, 7-3-1 Hongo, Tokyo 113-0033, Japan
1
([email protected])
Introduction: The Moon preserves the records of
early geologic events on its surface due to the small
size and the absence of atmosphere and ocean. The
origin and evolution of the Moon are fundamental to
understand the initial evolution of terrestrial planets
and the formation of the Earth-Moon system [1].
The lunar crust and mantle are thought to have
formed by fractional differentiation during cooling of
the whole scale lunar magma ocean (LMO) (e.g., [2]).
According to many previous studies about differentiation of LMO (e.g., [2]-[5]), it has been widely accepted
that olivine crystallized at first to form a cumulate layer overlying the core, of which chemical composition
successively changed to Fe-richer one. Orthopyroxene
followed olivine, though the density of coexisting melt
is still light enough to move upward. Once plagioclase
appeared and floated to form a crust, the melt composition became heavy, which finally crystallized clinopyroxene and ilmenite-rich residues, with high concentrations of incompatible radioactive elements. Hess and
Parmentier [6] discussed gravitational instability of
this heavy layer and proposed a mantle overturn model,
which well explains the source for high-TiO2 mare
basalts erupted several hundred millions years later.
However, the role of percolation process was not evaluated, which should have significant effects on the
density profile during the LMO differentiation and
subsequently on the internal structure and later evolution of the Moon, specifically time scale of density
instability to overturn.
Purpose: The present study aims to evaluate the
percolation process that controlled the development of
density instability during the LMO differentiation by
thermodynamic and fluid dynamic modeling.
Model: At first, bulk silicate Moon composition is
assumed, which was obtained by [5], in order to satisfy
the fluid dynamic conditions for the formation of the
anorthosite crust with the thickness of 53km. The
composition is 43.6 wt% SiO2, 36.6 MgO, 4.26 Al2O3,
3.39 CaO, and 11.8 FeO. Then, equilibrium crystallization was calculated for the melt with the MELTS or
pMELTS code [7] at the pressure corresponding to the
middle depth of the LMO. The initial LMO depth is
assumed to be 1000km. Crystals were separated from
the convective magma ocean when the fraction of crystal vol.% reached a critical value X, which varied as a
parameter from 10 to 40. The fraction of trapped melt,
the porosity of cumulate layer, vol.% is another pa-
rameter, which varied from 25 to 50 (stated below).
The chemical composition of the trapped melt is assumed not to change with time. Finally, the chemical
composition and depth of the residual LMO was calculated by converting the volume of the separated minerals to the thickness of the cumulate layer. The same
procedures were repeated until the total crystal fraction
reaches 90 vol.%.
The time scale for instability of the overlying melt
above the cumulate layer due to the increase in the
melt density by differentiation was evaluated according to Riaz and Hesse [8], which is shown as follows,
φµ 2 D
tC = 146
2
( KΔρ g) (1) ,
where is porosity, is viscosity, K is permeability,
Δρ is density difference between LMO and trapped
melt, and D is the diffusion coefficient. The density
and viscosity parameters are obtained by the
(p)MELTS calculation. For D, diffusion coefficient of
Fe2+ is used in the present work, because Fe2+ is essential to vary melt density. The value by [9] is applied.
2
Permeability is shown as K = d φ n with 2 ≤ n ≤ 3 ,
b
where d is grain size of minerals and b is a geometrical
constant. n is obtained to be 2 for <0.03 and 3 for
> 0.03 for a melt-solid system by [10], and b is obtained to be 104 for n=2 and 103 for n=3 by [11]. Grain
size, d, in the LMO is hard to know, and therefor, it
varied as a parameter from 0.01 to 1.0 cm according to
Solomatov and Stevenson [12]. The porosity (=
trapped melt fraction), vol.%, is varied from 25 to
50 on the basis that the maximum packing crystal fraction is 0.639 for a uniform radius and 0.86 for a binary
mixture with the ratio of 19 [13].
In summary, we have three parameters, X, , and
d. Equation (1) was calculated with these three parameters for each step of differentiation calculation.
Results: Figure 1 shows the change of the density
and viscosity of LMO and the density of trapped melt
with the progress of differentiation for X=10, =25,
and d=1.0 cm. The density of trapped melt is constant
for each step of differentiation calculation because the
chemical composition of the trapped melt is assumed
not to change with time. On the other hand, the density
of LMO increases during crystallization from crystal
fraction of zero to X, because the composition of the
LMO successively changed to Fe-richer one. When the
46th Lunar and Planetary Science Conference (2015)
solidification reaches ~73%, the density increases drastically, because plagioclase appeared to move upward
to form the crust. The viscosity of the LMO also increases with differentiation because of the change of
the composition of LMO. This tendency is also the
case for other values of the three parameters.
Figure 2 shows the percolation time, which is the
time to arise instability between lighter trapped melt
and the overlying heavier residual melt in the magma
ocean body for the case of X=10%. The zigzag pattern
comes from the density change of magma ocean during
crystallization from the crystal fraction of zero to X,
where the increase in the melt density lowers the percolation time. When the crystal fraction is reached the
critical value X, the magma ocean comes back to crystal-free, the density difference becomes smaller, and
the percolation time becomes longer. It is worth noting
that the percolation time at the critical crystal fraction
is approximately constant almost all through the LMO
differentiation. Figure 2 shows that the porosity and
specifically the grain size strongly affect the percolation time. The broken lines in Fig. 2 are for the case of
d=0.01cm and the solid lines are for d=1.0cm. The
percolation time varies by up to about two orders of
magnitude for the variation of porosity by two times
(compare red and green), whereas the percolation time
varies by up to about 9 orders of magnitude for the
variation of grain size by two orders of magnitude
(compare red solid and broken lines).
Discussions: Shearer [14] discussed that the duration of LMO crystallization is highly dependent on the
size of the LMO and the nature and thermal conductivity of the early crust. The crystallization time of the
LMO before anorthite crust formation is estimated to
vary from 102 to less than 107 years (e.g.,[15],[16]).
They also predicted total LMO crystallization time of 6
107 to 2 108 years for different thickness of the
crust. Previous thermal models further suggested that
the LMO crystallized very rapidly before anorthite
crust formation and that the crystallization speed became smaller with thickening of the anorthite crust.
Thus, the crystallization time of LMO is poorly constrained.
Comparing the percolation time at the critical crystal fraction for each step of differentiation calculation
and the duration of the whole LMO crystallization,
we can conclude that the percolation time is much
shorter than the crystallization time if the grain size is
1.0cm. If we apply the relationship between grain size
and cooling rate of a magma ocean by [12], grain size
tends to be larger with lowering cooling rate, which
suggests larger grain size near the end of LMO crystallization. In summary, it is highly possible that the den-
2381.pdf
sity instability caused repeated minor scale overturn of
magma ocean and trapped melt during LMO differentiation, which would have resulted in the absence of
density instability that caused large-scale overturn proposed by [6].
Reference: [1] Hartmann, W.K. and Davis, D.R. (1975) Icarus 24, 504-515. [2] Wood, J. A. et al. (1970) Proc. Apollo 1 Lunar
Sci. Conf., 965. [3] Solomon, S.C. and Longhi, J. (1977) Proc. LSC
8, 583-599. [4] O’Neill and H. St C (1991) GCA 55, 1135-1157. [5]
Sakai,R.,et al. (2014) Icarus 299, 45-56. [6] Hess, P. C. and Parmentier, E.M., (1995) EPSL 134, 501-514. [7] http://melts.ofmresearch.org/. [8] Riaz, A., et al. (2006) Journal of Fluid Mechanics
548, 87-111. [9] Zhang, Y., Ni, H and Chen, Y. (2010) Rev. Mineral.
Geochem., 72, 311-408. [10] McKenzie, Dan. (1989) EPSL 95.1,
53-72. [11] Maaløe, Sven, and Åse Scheie. (1982) CMP 81, 350357. [12] Solomatov, V. S. and Stevenson, D. J. (1993) JGR Planets,
98(E3), 5407-5418. [13] Solomatov, V. S. and Stevenson, D. J.
(1993) JGR Planets, 98, 5391-5406. [14] Shearer, C.K., et al. (2006)
Rev. Mineral. Geochem. 60, 365-518. [15] Solomon, S. C., and J.
Longhi. (1977) Proc. LPSC 8. 583-599. [16] Minear, J. W. (1980).
Proc. LPSC 11, 1941-1955.
Figure 1 Change of the density of the LMO and
trapped melt and the viscosity of LMO with the progress of differentiation for X=10, =25,and d=1.0cm.
Figure 2 Percolation time of LMO melt to interstitial
melt by gravitational instability with the progress of
differentiation.
© Copyright 2026