
1908
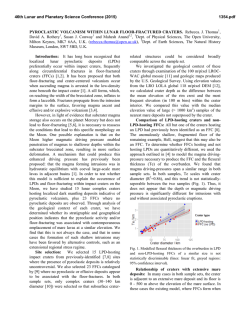
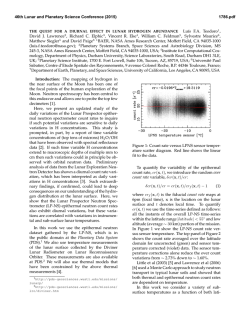
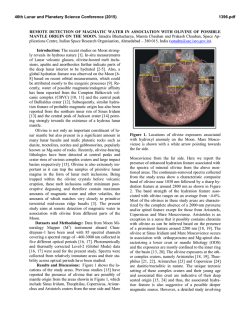
46th Lunar and Planetary Science Conference (2015)
1908.pdf
INVESTIGATION OF SINUS AESTUUM, RIMA BODE, AND VAPORUM REGIONAL DARK MANTLE
DEPOSITS. C. M. Weitz1, M. Staid1, L. Gaddis2, and S. Besse3, 1Planetary Science Institute, 1700 E Fort Lowell,
Suite 106, Tucson, AZ 85719 ([email protected]); 2Astrogeology Science Center, U. S. Geological Survey, 2255 N.
Gemini Drive, Flagstaff, AZ 86001; 3ESA/ESTEC SRE-S Keplerlaan 1, 2201 AZ Noordwijk, The Netherlands.
Introduction: Lunar dark mantle deposits (DMDs)
were produced in explosive volcanic eruptions and are
identified based upon their relatively low albedos, surface smoothness, mantling relationship to underlying
terrain, and spectral absorption bands due to the presence of iron-bearing volcanic glasses [1-6]. DMDs
may be composed of glasses and/or crystallized beads,
with glasses exhibiting a broad absorption centered
near 1 µm and generally displaying weaker absorptions
near 2 µm. They can be spectrally differentiated from
olivine based on a more symmetrical absorption extending beyond 1 µm [7]. Additionally, the distance
between the 1 and 2 µm band minima is shorter for the
glasses than in pyroxenes or olivine [8-10].
M3 85-band reflectance measurements provide an
excellent data set to characterize the mineralogy of
DMDs relative to surrounding materials and interpret
their geologic context because the DMDs are readily
visible due to their low albedo and broad ferrous absorption relative to surrounding deposits, especially
feldspathic materials. Using M3 data [11-13], we produced mineralogic parameter images [8] at three locations: Sinus Aestuum (SA), Rima Bode (RB), and Vaporum (VP). Additional data sets that we utilized include: Lunar Reconnaissance Orbiter (LRO) Narrow
Angle Cameras (NAC) and LRO Wide Angle Camera
(WAC) [14]; Terrain Camera (TC) and Multispectral
Imager (MI) data from the Japanese Space Agency’s
(JAXA) SELENE (also called ‘Kaguya’) mission [15].
Using all these data sets, we mapped the distribution of
DMDs, explored their stratigraphic relationships to
other units, and searched for plausible vents that may
have erupted the pyroclastic deposits.
Observations: Figure 1 shows a M3 mineralogic
parameter mosaic across SA (SA1 and SA2) and RB.
Basalts appear pink due to a strong 1 µm absorption,
brighter feldspathic areas are lavender (high 1.58 µm
reflectance), and pyroclastic glasses appear green due
to a shorter wavelength 2 µm band. The spinel-rich
areas [16-18] are identified by a strong 2 µm absorption observed in the spectra and appear black.
Stratigraphic relationships suggest the following:
emplacement of older pyroclastics associated with the
spinels (SA1&2) as well as without spinel (RB), followed by mare basalts, then additional eruption(s) of
pyroclastics lacking spinels at SA, and finally later
feldspathic mixing within the DMDs. The spinel-rich
regions in SA are usually best exposed on highland/basin materials rather than with pyroclastic mate-
rials now observed at the surface. In general, the pyroclastics are older relative to the mare, but there are a
few areas where pyroclastics not associated with spinel
appear younger than some of the basalts (Fig. 1).
Similar analyses for VP (Fig. 2) also provide insight into the distribution and stratigraphy of the DMD
in that region. The distribution of pyroclastics was
mapped using M3 spectral information and also
Kaguya and WAC images. The DMD is concentrated
along highlands and has been covered by younger
mare within the Vaporum basin to the north. Mare
ponds within the highlands appear to be covered by
pyroclastics, indicating the explosive volcanic activity
occurred between effusive eruptions in this region.
Source vents for DMDs. We have identified
oval/elongate features and rilles that could be potential
vents. The linear rille at RB has been proposed as a
possible vent for the DMD here, yet the distribution of
pyroclastics is not centered on the rille. Fitting a circle
to the DMD deposit [3], and assuming the deposit resulted from one eruption that produced an umbrella
shaped plume [19], the most likely vent is located to
the west where it was covered by the younger mare
materials within the basin. Several elongated vents and
sinuous rilles are visible in and around SA (Fig. 1) that
could be potential source vents for some of the pyroclastics. At VP, a plausible source vent (Fig. 2) that is
12.5 km in diameter and 1 km deep has a raised rim
and is near the center of the DMD deposit.
References: [1] Pieters et al. (1973) J. Geophys. Res. 78,
5867–5875. [2] Adams et al. (1974) Proc. Lunar Sci. Conf.
5th, pp. 171–186. [3] Gaddis et al. (1985) Icarus 61, 461–
489. [4] Hawke et al. (1989) Proc. Lunar Planet. Sci. Conf.
19th, pp. 255–268. [5] Hawke et al. (1990) Lunar Planet. Sci.
Conf. 20th, pp. 249–258. [6] Hawke et al. (1991) Proc. Lunar
Planet. Sci. Conf. 21st, pp. 377–389. [7] Pieters et al. (1993)
J. Geophys. Res. 98, 17127– 17148. [8] Besse et al. (2014) J.
Geophys. Res., 10.1002/2013JE004537. [9] Horgan et al.
(2014) Icarus 234, 132-154. [10] Jawin et al., (2014) J. Geophys. Res., submitted. [11] Boardman et al. (2011) J. Geophys. Res., doi:10.1029/2010JE003730. [12] Clark et al.
(2011) J. Geophys. Res., doi:10.1029/2010JE003751. [13]
Besse et al. (2011) J. Geophys. Res., 116, E00G13,
doi:10.1029/2010JE003725. [14] Robinson et al. (2010)
Space Science Review, 150: 81-124. [15] Haruyama et al.
(2008) Advances in Space Research, 42 (2), 310-316. [16]
Sunshine et al. (2010) LPSC XLI, Abstract 1508. [17] Yamamoto et al. (2013) Geophy. Res. Letts 40, 4549-4554. [18]
Sunshine et al. (2014) LPSC 45, Abstract 2297. [19] Weitz et
al. (1998) J. Geophys. Res. 103, 22725-22759.
46th Lunar and Planetary Science Conference (2015)
1908.pdf
Figure 1. M3 color parameter mosaic covering Sinus Aestuum (SA1&2) and Rima Bode (RB) merged with WAC
mosaic. In this image, red is the 1 µm integrated band depth (IBD), green is the band depth at 1.9 µm, and blue is the
reflectance at 1.58 µm. Basalts show up in pink due to a strong 1 µm absorption whereas the pyroclastic glasses
show up as green due to a shorter wavelength 2 µm band. Brighter feldspathic areas show up in lavender. The
spinel-rich areas show up as black. The magenta outline identifies the DMD for Rima Bode. The yellow outline
identifies SA DMDs associated with spinel-rich areas on the highlands. The red outlines indicate possible pyroclastics on the mare. The white circles are the locations where [17] identified Fe-rich spinel. Black outlines indicate possible source vents for the pyroclastics.
Figure 2. M3 color parameter mosaic merged
with Kaguya TC evening mosaic covering
Vaporum DMD. In this image, red is the 1
µm IBD, green is the band depth at 1.9 µm,
and blue is the reflectance at 1.58 µm. The
pyroclastics are outlined in yellow whereas
the blue lines delineate mare-highland contacts. Unusual depressions that could be
vents are noted by brown outlines and a ‘V’
marks a plausible source vent for the
pyroclastics.
© Copyright 2026