
analysis of dark mantle deposits on the southeastern limb of the
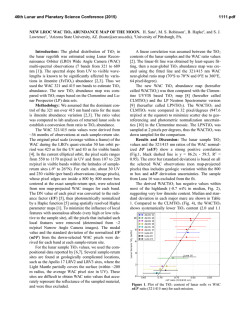
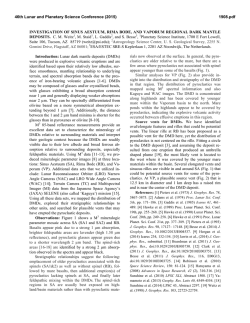
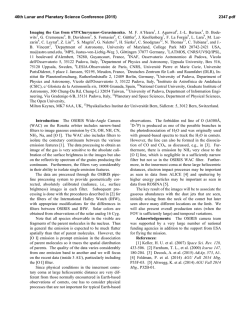
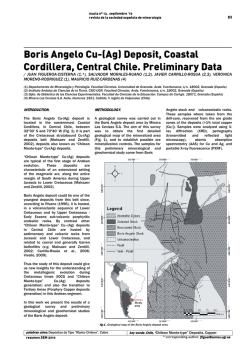
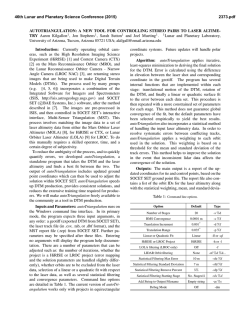
46th Lunar and Planetary Science Conference (2015)
2714.pdf
ANALYSIS OF DARK MANTLE DEPOSITS ON THE SOUTHEASTERN LIMB OF THE MOON
INCORPORATING LROC WAC AND M3 MULTISPECTRAL DATA SETS. J.Olaf Gustafson1, B.R.
Hawke2, H. Sato3, L.R. Gaddis4, and T.A. Giguere2,5. 1Dept. Earth & Atmospheric Sciences, Cornell University, Ithaca, NY; 2Hawaii Institute of Geophysics and Planetology, University of Hawaii, Honolulu, HI; 3School of Earth
and Space Exploration, Arizona State University, Tempe, AZ; 4Astrogeology Science Center, U.S. Geological Survey, Flagstaff, AZ; 5Intergraph Corporation, Kapolei, HI. ([email protected]).
Introduction: We previously studied dark-mantle
an important tool for understanding the mode of emdeposits (DMDs) on the southeastern limb of the Moon
placement of a DMD (e.g. effusive vs. explosive volusing Lunar Reconnaissance Orbiter Camera (LROC)
canism) as well as possible relationships between
Wide Angle Camera (WAC) monochrome data, LROC
DMDs.
high-resolution Narrow Angle Camera (NAC) images,
Methods: The LRO WAC acquires monochrome
and Clementine UV-VIS data. We have extended this
images using a 605 nm filter at a resolution of ~75
analysis to include WAC color (two ultraviolet (UV)
m/pix, and multispectral images at two ultraviolet (UV)
and five visible (VIS) wavelengths from 320-690 nm)
and five visible (VIS) wavelengths (320, 360, 415, 565,
and Moon Mineralogy Mapper (M3) data (spectral
605, 645, and 690 nm) at a resolution of ~400 m/pix in
range 0.4-3 μm, 20 nm spectral resolution) as well as
the UV and ~75 m/pix in the visible [7,8]. WAC color
LROC-derived topographic data (GLD100 data set).
analysis was perfomed using a photometrically normalOur goals are (1) to assess interdeposit and intradeposit
ized 7-band near-global mosaic computed using the mecompositional variations among the SE Limb DMDs
dian value from many repeat observations for each pixel
and compare them to other volcanic deposits both
[9]. The M3 instrument acquired multispectral images
within this region and elsewhere across the Moon, and
across a spectral range 0.4-3μm at 20 nm spectral reso2) to characterize the topography of the DMDs and aslution, with a spatial resolution of ~140m/px or
sess their mode of emplacement.
~280m/px depending on the orbital period [10]. Level 2
Background: Numerous potential pyroclastic dev1.0 data were downloaded from the Planetary Data
posits have been mapped across the Moon, typically
System [11], and spectra were extracted from minimum
based on their low albedo, smooth texture, and
mantling effect over underlying terrain features
[1,2,3,4]. Gaddis et al. [1] compared the composition of 75 potential lunar pyroclastic deposits
using Clementine spectral reflectance (CSR)
measurements. For this study, we have chosen a
region along the southeastern limb of the Moon
that contains nine of those 75 deposits at six locations (Fig. 1): Humboldt (D=207 km), a floorfractured crater with four distinct DMDs; Petavius (D=177 km), a crater with several large graben containing at least four distinct DMDs
(treated as one by [1]); Barnard (D=105 km), Abel
B (D=41 km), and Abel C (D=31 km) craters; and
the highlands east and southeast of Titius crater Fig. 1- Study area on the SE limb of the Moon (portion of global WAC
(D=73 km). The results presented here continue mosaic [8], NASA/GSFC/ASU)
and extend our previous study of this region [5,6],
utilizing data generated by the LROC WAC and Chan5x5 pixel regions for each geologic unit. Continuum redrayaan M3 instruments.
moved relative reflectance was derived by fitting a
The various multispectral data sets that exist for the
straight line across both the 1 μm and 2 μm bands (after
Moon each have slightly different capabilities,
Besse et al. [12]). Our topographic analysis was based
strengths, and weaknesses, including differences in spaon the WAC GLD100 DTM [8].
tial and spectral resolution, areal coverage, illumination
Results and Discussion: Our initial analysis of the
conditions, and data quality. By utilizing LROC WAC
SE Limb region utilizing WAC and M3 color data has
and M3 data to supplement the CSR data used previfocused on the deposits within and near Humboldt. Figously, we hope to refine the compositional classification
ure 2a presents a WAC color ratio image designed to
of the target deposits and therefore constrain possible
emphasize differences in UV reflectance that differentigenetic relationships. Anaysis of the topography is also
46th Lunar and Planetary Science Conference (2015)
ate both compositional units and regolith maturity levels. Of particular interest in this image is the contrast
between the Humboldt NE DMD and the other Humboldt deposits. In addition, both Abel B and C are somewhat subdued, exhibiting little contrast with surrounding units in contrast to the distinctive appearance of the
Humboldt and Barnard DMDs. These same trends can
be seen in the M3 near-infrared spectra (Fig. 3). While
the Humboldt DMDs all have a similar 2 μm band position, the NE deposit has an asymmetric 1 μm band extending to longer wavelengths (Fig. 3a). When Abel B
& C are compared to Humboldt, they both have a shorter
2 μm band center and weaker 1 μm band (Fig. 3b). Abel
B in particular has a weaker mafic signature, suggesting
that the DMD material may have mixed with highland
components.
The topographic expression of DMDs is an important factor in understanding emplacement mechanisms. The Humboldt DMDs are generally smooth with
low slopes, consistent with effusive emplacement; the
NE deposit is typical (Fig. 4a, b). A comparison of Abel
B & C reveals that the floor of Abel C is quite smooth
and flat, consistent with effusive emplacement, while
the floor of Abel B is hummocky and likely mantled
with pyroclastic material (Fig. 4c, d).
2714.pdf
Conclusions and Future Work: Preliminary results from our analysis of DMDs on the southeastern
limb utilizing multispectral and topographic data confirms our earlier conclusion that these deposits are predominantly effusive (mare ponds), with relatively limited associated pyroclastic deposits. Analysis of the
WAC and M3 multispectral data will continue with the
goal of characterizing all the SE Limb DMDs and constraining the composition and mineralogy of the deposits. In particular, we intend to explore the utility of the
M3 dataset to differentiate between glassy and crystalling deposits, using recently developed methods as described by Besse et al. [12] and Horgan et al. [13].
References: [1] Gaddis L.R. et al. (2003) Icarus
161, 262-280; [2] Head J.W. III (1974) PLSC 5th, 207222; [3] Gaddis L.R. et al. (1985) Icarus 61, 461-488;
[4] Hawke B.R. et al. (1989) LPS 19th, 255-268; [5]
Gustafson J.O. et al. (2010) LPS 41st #1862; [6] Gustafson J.O. et al. (2013) LPS 44th #2723; [7] Robinson
M.S. et al. (2010) Space Sci. Rev. 150 (1-4), 81-124; [8]
Scholten et al. (2011) LPS 42nd #2046; [9] Sato H. et al.
(2014) JGR 119(8), 1775-1805; [10] Pieters et al. 2009
Curr. Sci. 96(4), 500-505; [11] Malaret et al. (2011)
NASA PDS; [12] Besse et al. (2014) JGR 119(2), 355372; [13] Horgan et al. (2014) Icarus 234, 132-154.


© Copyright 2026