
1175
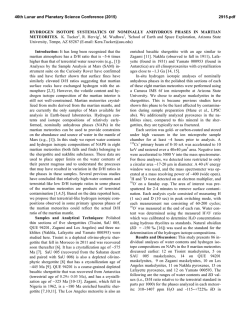
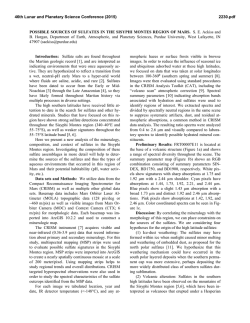
46th Lunar and Planetary Science Conference (2015)
1175.pdf
LATITUDINAL VARIATION IN THE ASSOCIATION OF H2O WITH SULFUR IN MARTIAN SOIL.
Suniti Karunatillake1, James J. Wray2, Olivier Gasnault3,4, Scott M. McLennan5, A. Deanne Rogers5, Steven W. Squyres6, William V. Boynton7, J. R. Skok1, Nicole E. Button1, Lujendra Ojha2
1Geology and Geophysics, Louisiana State University, USA ([email protected]) Note equal contributor, James J. Wray; 2Earth
and Atmospheric Sciences, Georgia Institute of Technology, USA; 3Université de Toulouse, Toulouse, France; 4CNRS, France;
5Department of Geosciences, Stony Brook University, USA; 6Department of Astronomy, Cornell University, USA; 7Department
of Planetary Sciences, University of Arizona, USA.
Introduction: The significance of H2O to any putative extant or extinct biosphere, as well as its potential
role in the chemical and physical evolution of the Martian crust both present and past [1,2] make factors affecting the distribution of H2O on Mars singularly important. S variation plays an equally important role as a
control on inferred fluid pH, alteration environments,
and water activity [3]; atmospheric-regolith S cycles
and processes may dominate over epochal time scales
[4,5]; analogous environments on Earth suggest atmospheric controls on S-cycles [6].
The variability of hydration due to thermodynamic
stability [7,8], due to diversity of sulfate minerals as determined remotely [9], and due to diversity observed in
situ [10] may obscure any association between H2O and
S. Additionally, ice tables detected within ~ 1 m depth
at latitudes as low as 45° [11] suggest a complex interplay among scattered ice bodies at depth and various
water-bearing material at shallower levels including
clay, zeolite, and silica [12 – 14]. The Mars Odyssey
Gamma Ray Spectrometer (GRS) is sensitive to such
depth variation as it samples the surface to several decimeter depths. Relative to the tens of microns sensitivity
of visible, near infrared, and thermal infrared (VN/TIR)
instruments, this may reveal compositional differences
with the surface. Such possibility also arises from in situ
observations at Gusev Crater where Paso Robles type
soil, rich in Fe-sulfates, sometimes underlies “typical”
Martian basaltic soil [10]. In the context of such complexities, our recent work [15] suggests a compelling association of H2O and S, consistent with hydrous Fe3+
sulfate distribution at global scales, especially in the
Southern hemisphere.
Regolith at grain sizes smaller than gravel, constituting the bulk of the Martian subsurface at regional scales,
may be a primary repository of chemical alteration, mechanical alteration, and bio-signatures. The GRS, with
hundreds of km lateral resolution and compositional
sensitivity to decimeter depth, provides unique insight
into this component of the regolith, which we call soil.
In this work, we assess the latitudinal variation in
hydration state, as represented by the H2O : S molar ratio. The latter may contribute to meaningful differences
in climate conditions that control the atmosphere-sur-
face interface and resultant soil composition. The regional scope of our work is assisted in particular by the
GRS’s intrinsic spatial resolution of roughly 440 km
[16], complementing the local chemistry [13] of
VN/TIR remote sensing missions.
Data and methods: We use elemental mass fraction
data derived from GRS γ photon spectra as discussed
by Boynton et al. [17]. These data are limited to between roughly ±60° latitude since [17] accurate mass
fractions are difficult to calculate within the polar regions with the exception of H2O. While the relatively
low intensity of characteristic peaks for S makes the
mass fraction map difficult to generate, spectra accumulated during science operations enabled the first
such midlatitudinal map to be created [18]. Nevertheless, substantial smoothing necessary to achieve sufficient numerical precision causes spatial autocorrelation
[19] and limits the spatial resolution of the S mass
fraction map. Therefore, we utilized 10° × 10° bins for
the S mass fraction, w(S), dataset. Accordingly, we rebinned w(H2O) from its original 5° × 5° resolution to
10° × 10°.
We map the global hydration state distribution by
first computing the moles of H2O, n(H2O), and of S,
n(S), in 100 g of soil at each 10° × 10° bin. This takes
the form w(H2O) × 0.0555 employing standard atomic
mass values [20]. Similarly, w(S) × 0.0312 yields the S
moles. The molar ratio is computed subsequently, with
corresponding uncertainty propagated as
𝑛(𝐻2 𝑂)
𝑛(𝑆)
𝜎𝑚 {𝑤(𝑆)} 2
√[
𝑤(𝑆)
] +[
𝜎𝑚 {𝑤(𝐻2 𝑂)} 2
𝑤(𝐻2 𝑂)
] , where σm denotes
the standard error of each variable. Ratios in the radical employ mass fractions, since the molar conversion
factor for mass fraction and its standard error cancels.
The molar ratio and corresponding uncertainty maps
underpin our analyses.
We developed a comparative mineral library on the
basis of peer-reviewed literature on remote sensing and
in situ observations [10,21]; thermodynamic [22] and
climatic models [4]; hydration-dehydration experiments that simulate Martian conditions [23]; and meteoritic observations [24]. This places candidate minerals
in several overlapping categories: bulk soil observed in
situ; outcrop and bedrock sensed remotely or in situ;
and thermodynamic feasibility. The nature of γ photon
spectra reflecting elemental composition at regional
46th Lunar and Planetary Science Conference (2015)
scale makes the judicious selection of minerals essential; a merely exhaustive list of all terrestrial and laboratory minerals would undermine effective modeling.
Accordingly, we consider 27 candidates with 13 distinct H2O : S molar ratios to compare with the distribution of GRS-derived values.
Results and discussion: Despite substantial overlap in possible hydration states across the mineral
groups, Mg-sulfates are generally not hydrated in the
2.5 to 4 range with the exception of starkeyite at 4
[22]; even amorphous meta-stable forms of Mg-sulfates may not exceed a hydration state of 3 [25] and are
thermodynamically more likely to be hydrated at 1 – 2
[22].
Figure 1. Hydration state plotted against latitude to
identify latitudinal variations in average hydration.
Blue error bars signify one standard error and the black
dot indicates the average, both accounting for heteroscedasticity [26]. Mid-point of each 10̊ -wide latitudinal bands is shown on the x-axis.
Intriguingly, Figure 1 shows a sustained trend of
increasing hydration state from less than 3.5 (e.g., between ferricopiapite and kornelite) to values exceeding
3.5 (e.g., starkeyite) within the map bounds in the
Northern hemisphere. Decreasing mean S concentrations accompany this trend. The proportional decrease
in average S molar content (moles per 100 g of regolith), of ~16% relative to the equatorial band’s 0.074
value (equivalent to mass fraction .074×32.065 =
2.4%), compares favorably with the ~15% proportional
increase in the hydration state from ~3.3 at the equator.
This suggests less variability in H2O concentration
northward than S, reinforcing the hemispheric-scale
decoupling between them in the North [15].
H2O abundances may decouple from S in the North
due to a confluence of decreasing depth to ground ice
stability, H2O accumulation in pore spaces of fine particle mantles presumably thickening northward, H2O
adsorption on fine particles, and specific surface area
[27,28]. Additional potential contributors include the
proportion of amorphous phases that may adsorb H2O
1175.pdf
[29], weakening chemical association with S. Consequently, sulfate may exert only a minor influence on
the latitudinal variations in hydration states in the
Northern hemisphere.
Unlike the North, hydration state generally decreases Southward from the Equator (Figure 1). With
the exception of the 50° - 60° latitudinal band, the hydration state decreases from the equatorial band to
about 2.8 as S molar content decreases to ~0.06. The
similar decrease of both by about 15% reinforces the
compelling possibility of H2O bound primarily in sulfates in the Southern hemisphere [15] producing a spatially associated variation in both. Higher hydration
state in the 50° - 60° South band relative to much of
the Southern hemisphere may reflect a decoupling of S
and H2O in the polar regime of Mars, perhaps analogous to the broader trend at play in the Northern hemisphere.
References:[1] Bishop, J. L. et al. Planet. Space Sci.
86, 130 – 149 (2013); [2] Michalski, J. R. et al. Nat.
Geosci. 6, 133–138 (2013); [3] Tosca, N. J. et al.
Science 320, 1204–1207 (2008); [4] Halevy, I. et al.
Science 318, 1903–7 (2007); [5] Halevy, I. & Schrag,
D. P. Geophys. Res. Lett. 36, L23201 (2009); [6] Peng,
Y. et al. in 44th LPSC 2427 (2013); [7] Feldman, W.
C. et al. J. Geophys. Res. 110, E11009 (2005); [8]
Steiger, M. et al. Geochim. Cosmochim. Acta 75,
3600–3626 (2011); [9] Murchie, S. L. et al. J.
Geophys. Res. 114, E00D06 (2009); [10] Yen, A. S. et
al. J. Geophys. Res. 113, E06S10 (2008); [11] Byrne,
S. et al. Science 325, 1674–6 (2009); [12] Jouglet, D.
et al. J. Geophys. Res. 112, E08S06 (2007); [13]
Bishop, J. L. et al. J. Geophys. Res. 114, E00D09
(2009); [14] Wray, J. J. et al. Geology 37, 1043–1046
(2009); [15] Karunatillake, S. et al. Geophys. Res. Lett.
41, 7987–7996 (2014); [16] Karunatillake, S. et al. J.
Geophys. Res. 112, E08S90 (2007); [17] Boynton, W.
V. et al. J. Geophys. Res. 112, 1–15 (2007) [18] King,
P. L. & McLennan, S. M. Elements 6, 107–112 (2010);
[19] Karunatillake, S. et al. Earth. Moon. Planets 108,
253 – 273 (2012); [20] Wieser, M. E. Pure Appl.
Chem. 78, 2051–2066 (2006); [21] Lane, M. D. et al.
Am. Mineral. (2014) doi:10.2138/am.2014.4762; [22]
Steiger, M. et al. Geochim. Cosmochim. Acta 75,
3600–3626 (2011); [23] Xu, W. & Parise, J. B. Am.
Mineral. 97, 378–383 (2012); [24] Righter, K. et al.
Earth Planet. Sci. Lett. 288, 235–243 (2009); [25]
Wang, A. et al. J. Geophys. Res. 114, E04010 (2009);
[26] Karunatillake, S. et al. Earth. Moon. Planets 108,
253 – 273 (2012); [27] Janchen, J. & Brettschneider, T.
in 42nd LPSC 2, 1369 (2011); [28] Beck, P.,
Pommerol, A., Schmitt, B. & Brissaud, O. J. Geophys.
Res. 115, E10011 (2010); [29] Meslin, P.-Y. et al.
Science 341, 1238670–1238670 (2013).

© Copyright 2026