
Coordinating Chemical and Mineralogical - USRA
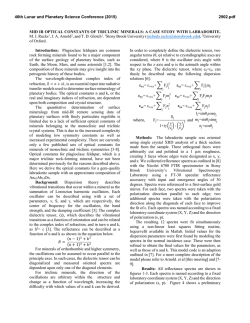
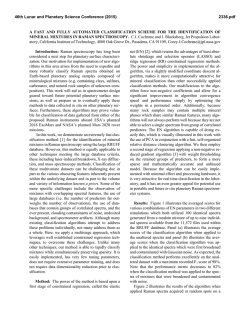
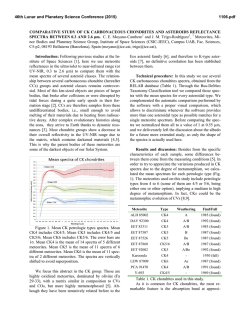
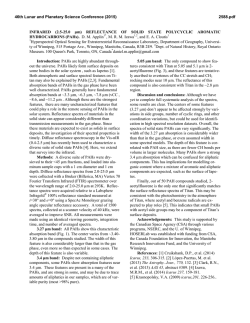
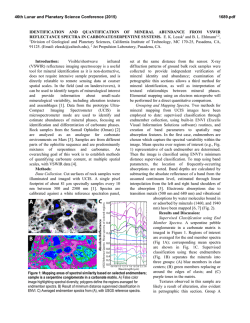
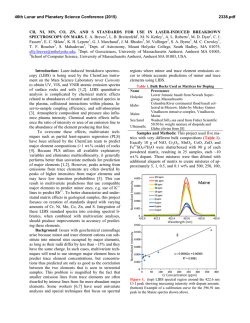
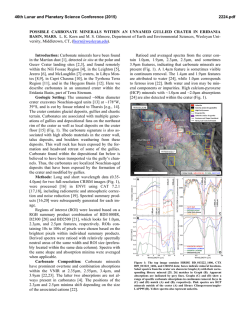
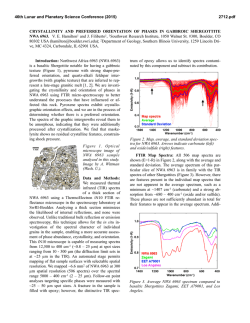
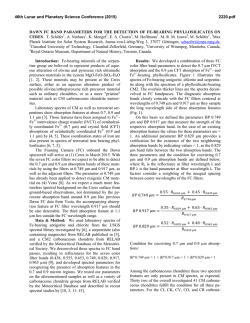
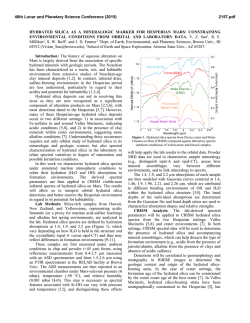
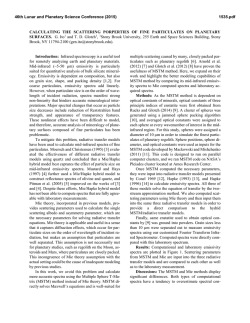
46th Lunar and Planetary Science Conference (2015)
1537.pdf
COORDINATING CHEMICAL AND MINERALOGICAL ANALYSES OF ANTARCTIC DRY VALLEY
SEDIMENTS AS POTENTIAL ANALOGS FOR MARS
S. N. Patel1,2, J. L. Bishop2, P. Englert3, and
4
1
E. K Gibson .
San Jose State University (San Jose, CA; [email protected]). 2SETI Institute (Mountain View,
3
CA). University of Hawaii at Mānoa (Honolulu, HI). 4Johnson Space Center (Houston, TX).
Introduction: The Antarctic Dry Valleys (ADV)
provide a unique terrestrial analog for Martian surface
processes as they are extremely cold and dry sedimentary environments. The surface geology and the chemical composition of the Dry Valleys that are similar to
Mars suggest the possible presence of these soil formation processes on Mars.
The soils and sediments from Wright Valley,
Antarctica were investigated in this study to examine
mineralogical and chemical changes along the surface
layer in this region and as a function of depth. Surface
samples collected near Prospect Mesa and Don Juan
Pond of the ADV were analyzed using visible/nearinfrared (VNIR) and mid-IR reflectance spectroscopy
and major and trace element abundances.
Methods: Many samples were collected from soil
pits and lakebottom depth profiles during 1979/1980.
The sampling locations of two cores studied here are
shown in Figure 1. VNIR spectra were measured of the
sediment grains using an ASD spectrometer [1]. Bidirectional reflectance spectra were measured from
0.3-2.55 µm and FTIR reflectance spectra from 1-25
µm for crushed versions of the samples using the RELAB facility at Brown University as in previous experiments e.g. [2]. Other geochemical analysis methods
including Na+, Ca2+ and Cl- were also carried out [3].
Results: Don Juan Pond - Core DJ39. The spectra
of each sample contained a band near 1.89-1.93 µm
due to combinations of H2O stretching and bending
vibrations, as well as bands in the 2.1-2.4 µm region
due to OH combination vibrations. Elevated hydration
Figure 1. Map of Wright Valley (from [3]) and sampling locations for cores DJ39 and WV72.
bands were found for samples collected 3-9 cm below
the surface. Samples in this region exhibited spectral
mineral fingerprints similar to those of clays and sulfates (Figure 2) suggesting elevated chemical alteration
in this zone. These spectra exhibit bands near 1.45 and
1.94 µm and weak features near 1.76 and 2.24-2.26 µm
that are consistent with the spectral features of gypsum
[4]. Bands near 1.92 and 2.20 µm are characteristic of
allophane [5].
Figure 2. Reflectance spectra of three samples from
core DJ39 representative of the high salt/water region of the core are compared to spectra of gypsum
(orange), allophane (red), and montmorillonite (light
green).
Figure 3. Photo of sample core aligned with a bar
graph showing the elevated salt region. The arrows
show the relationship between the chemistry and the
thin layers of bright sediment.
46th Lunar and Planetary Science Conference (2015)
1537.pdf
H2O soluble cation and anion abundances for Na+,
and Cl- measured from a previous study [3]
showed an elevated salt region of 3-8 cm below the
surface (Figure 3). Similar patterns in 1.94 µm band
depth due to H2O in minerals and salt abundance (Na+,
Cl-) along the soil profile suggest that chemical alteration is occurring a few cm below the surface as opposed to at the surface.
Ca2+
Wright Valley Soil Pit #1 - Core WV72. The chemical composition of these samples are shown in Table 1.
Greater abundances of Cl-, NO3- and SO4- are observed
a few cm below the surface and the presence of these
ions decreases down the soil profile below ~20 cm.
Spectra of many of the samples in core WV72 contain water bands near 1.45 and 1.94 µm, which indicate
the presence of hydrated components. Spectra of sample JB1089 from 2-4 cm depth contain the strongest
pair of bands at 2.44 and 2.55 µm. This doublet feature
together with the water bands are consistent with the
spectrum of Iron(III) Nitrate Nonahydrate or
(Fe(NO3)3●H2O (Figure 4). Spectra of other forms of
hydrated nitrates also exhibit doublet features near 2.42.6 µm, but are less consistent with the bands observed
in the Wright Valley sediment spectra. Elevated NO3abundances were observed in samples from 2-16 cm
depth in the sample core in preliminary anion extractions (Table 1).
Table 1. Concentrations of various anions for each
sample of Drive tube 72 (note that extraction of the
ions may be incomplete).
Figure 4. Reflectance spectrum of Wright Valley
soil pit sample JB1089 (orange) compared to lab
spectra of hydrated iron (III) nitrates.
Summary and Applications to Mars: Increased
abundances of soluble cations and anions were observed in sediments a few cm below the surface in a
soil pit at Don Juan Pond. Spectra of these subsurface
sediments have deeper water bands consistent with
elevated amounts of hydrated sulfates, salts and clays.
Increased soluble anion abundances were also observed for sediments 2-16 cm below the surface in a
soil pit near Prospect Mesa. Spectra of some of these
samples included a doublet related to the spectral features of hydrated iron nitrate. This study shows elevated abundances of hydrated minerals through their spectral features
and elevated abundances of soluble cations a few cm below the
surface. This is attributed to increased chemical activity just
below the surface.
References: [1] Patel S. (2013)
NCUR Proceedings, 802-809.
[2] Bishop J. L. et al. (2014a)
Phil Trans Royal Soc. A, 372,
20140198. [3] Gibson E. K. et al.
(1983) JGR, 88, A912-A928.
[4] Bishop J. L. et al. (2014b)
Am.Min., 99, 2105-2115. [5]
Bishop J. L. et al. (2013) Clays
Clay Min., 61, 57-74.
Acknowledgements:
We are
grateful to the SETI InstituteSJSU URSA program that supported work by S. Patel on the
project. Thanks are also due to T.
Hiroi for acquiring the spectra at
RELAB/Brown Univ.

© Copyright 2026