
Raman spectroscopic and SEM analysis of sodium zippeite
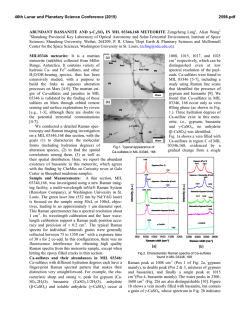
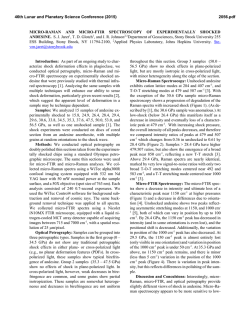
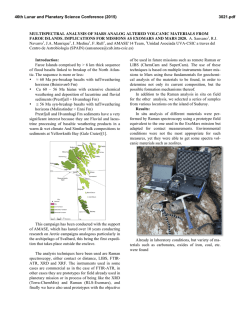
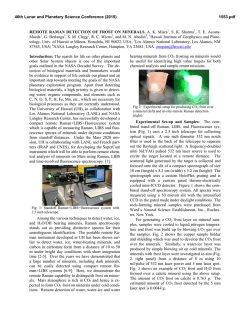
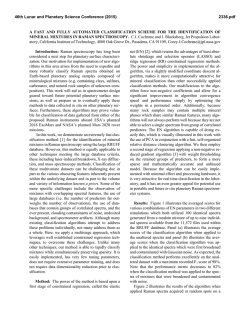
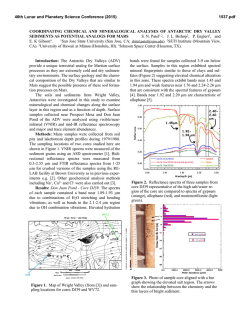
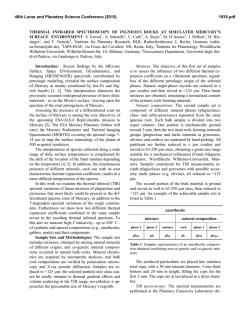
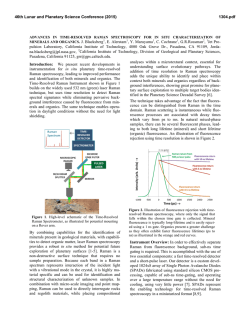
This is author version of article published as:
Frost, Ray L. and Cejka, Jiri and Ayoko, Godwin A. and Weier, Matt L. (2007) Raman spectroscopic and SEM
analysis of sodium zippeite . Journal of Raman Spectroscopy 38(10):pp. 1311-1319.
Copyright 2007 John Wiley & Sons
Raman spectroscopic and SEM analysis of sodium zippeite
Ray L. Frost 1*, Jiří Čejka 1,2 , Godwin A. Ayoko 1 and Matt L. Weier 1
1. Inorganic Materials Research Program, School of Physical and Chemical Sciences,
Queensland University of Technology, GPO Box 2434, Brisbane, Queensland 4001,
Australia.
2. National Museum, Václavské náměstí 68, 115 79 Praha 1, Czech Republic.
Abstract
Raman at 298 and 77 K and infrared spectra of two samples of sodium-zippeite were studied
and interpreted. U-O bond lengths in uranyl were calculated and compared with those inferred
from the X-ray single crystal structure data of a synthetic sodium-zippeite analog. Hydrogenbonding network in the studied samples is discussed. O-H…O bond lengths were calculated
and compared with those predicted from the X-ray single crystal structure analysis.
Key words: sodium-zippeite, uranyl mineral, Raman and infrared spectroscopy, U-O bond
lengths in uranyl, hydrogen-bonding network
Introduction
Uranyl sulfates of the zippeite group are common constituents in the oxidized zone of
uranium deposits 1,2. Zippeites may impact upon the mobility of uranium and heavy metals in
mine tailings and may form in a geological repository for nuclear waste such as results from
spent nuclear fuel. Uranyl sulfates may determine the mobility and fate of uranium in natural
systems. These uranyl sulfates are also important as alteration products of nuclear waste. They
may incorporate radionuclides into their crystal structure, thus impacting the mobility of some
radionuclides 2. Uranyl sulfate minerals are not abundant, however, they are widespread,
occurring in uranium deposits worldwide. The uranyl sulfate minerals including zippeites
originate and are formed as a result of the oxidation of sulfide minerals connected with the
formation of sulfate anions in the presence of hexavalent uranium in the form of uranyl ions,
(UO2)2+ 2.
Uranyl minerals of the zippeite-group have been poorly-defined for many years 3-5.
Very few spectroscopic studies have been undertaken even though Raman spectroscopy has
been applied to other minerals containing the uranyl group 6-11. It is presumed that the zippeite
minerals are simple hydrated uranyl sulfates. Frondel and Weeks first showed that these
minerals are not simple hydrated uranyl sulfates, but in fact each contain a cation in addition
to the uranyl ion 4. Desription and comparison of natural samples with their synthetic
1
analogues were published in 1976 by Frondel et al. 5. Chemical composition, refractive
indices and X-ray powder patterns were included in this paper. However, some confusions in
these results were observed. O‘Brien and Williams 12 and Haacke and Williams 13 presented
ΔGof values for synthetic K-, (NH4)-, Na-, Mg-, Ni-, Co- and Zn-zippeites and assumed
extensive solid solution formation between divalent cation containg zippeites, between K- and
(NH4)-zippeites, but not between K- and Na-zippeites. Extensive crystallochemical and
structural study of synthetic zippeites was recently published by Burns et al. 14 followed by a
dissertation describing in detail some natural zippeites 2. Both authors found the layered
zippeites are topologically identical. The sheet contains zig-zag chains of edge-sharing uranyl
pentagonal dipyramids, and the chains are connected by the sharing of vertices between the
uranyl pentagonal dipyramids and sulfate tetrahedra. Each sulfate tetrahedron is linked to four
different uranyl dipyramids 15. The sheet is made up of chains of uranyl pentagonal
dipyramids that are two polyhedra wide. The chains are crosslinked through (SO4)2tetrahedra, resulting in uranyl sulfate sheets. The composition of the sheet is dependant upon
the distribution of (O2-)/(OH)- in each zippeite phase 2. The uranyl sulfate sheets are in some
cases (e.g. Mg-, Zn-, Co-, (NH4)-zippeites) anhydrous, [(UO2)2(SO2)O2], or oxy anions may
be partly substituted by hydroxyls e. g. in zippeite (the name zippeite proposed by Frondel for
K-zippeite from Jáchymov, studied by Nováček in 1935 5, [(UO2)4(SO4)2O3(OH)], or in
sodium-zippeite, [(UO2)4(SO4)4O5(OH)3)] 14,15. Burns et al. 14 concluded that the distribution
of interlayer constituents, i .e. mono- and divalent cations and water molecules can be
rationalized on the basis of the bonding requirements of the uranyl sulfate sheets 15. It may be
assumed that the (UO2)/(SO4)2- molar ratio in the layers is probably close to 2 with some
variability in the O/OH ratio. However, McCollam 2 proved that practically in all analysed
natural zippeites the molar ratio M+(M2+)/(UO2)2+/(SO4)2- was lower than expected from the
stoichiometry. The interlayer is open and able to include monovalent and divalent cations for
balancing the charge of the layers together with water molecules. Hydrogen-bonding network
plays also an important role for the origin and stability of zippeites.
Frondel et al. 5 attributed to natural and synthetic sodium-zippeite the formula
Na4[(UO2)6(SO4)3(OH)10]. 4H2O. According to Burns et al. 14, the formula for synthetic
sodium-zippeite is Na5(H2O)12[(UO2)8(SO4)4O5(OH)3] with Z = 4, 8 symmetrically distinct
U6+ atoms (one UO2O5, five UO2O4(OH) and two UO2O3(OH)2) and four symetrically
distinct S6+ atoms. Each (OH)- group is bonded to two U6+ cations, and is located at a
common equatorial vertex. In Na-zippeite, there are three symmetrically distinct (OH)groups, two of which occur along a shared edge between uranyl pentagonal dipyramids 14.
The presence of some Ux(O,OH)y groupings was assumed and proved in the crystal structure
of synthetic Na-zippeite. In the interlayer, Na cations are coordinated by six or seven ligands
(Ouranyl atoms and/or OU-S atoms and/or water molecules). Five Na cations and twelve water
molecules form a complex interlayer in synthetic Na-zippeite. Eight water molecules are
shared between two Na+ cations and four are bonded to only one Na+ cation. The interlayer of
the synthetic Na-zippeite contains also a substantial number of hydrogen bonds thus forming a
complex hydrogen-bonding network 14.
It has been shown that the uranyl sulfate sheet topology is very similar in all zippeitetype minerals and their synthetic analogues 14,16,17. However, the relatively large interlayer
enables complex localization of monovalent and/or divalent cations and the formation of solid
solutions, and of water molecules. Water molecules may be coordinated by cations or only
hydrogen bonded. McCollam 2 assumes possible existence of solid solutions of zippeites
containing monovalent cations Na+, K+ and (NH4)+, and may also contain divalent cations.
2
Water molecules from the interlayer and hydroxyls in the sheets participate in formation of a
very complex hydrogen-bonding network in Na-zippeite 14.
Sodium-zippeite was described from Jáchymov, Czech Republic 18, Geevor mine, St.
Just, Cornwall, England 19 Rožná, Czech Republic 20 La Creusaz uranium prospect,
Switzerland 21, Jánská žíla, Březové Hory, Příbram, Czech Republic 22. Infrared spectra and
thermal analysis of natural and synthetic zippeites were reviewed by Čejka 23. Raman
spectroscopy has proven very useful for the study of minerals 24-26. Indeed Raman
spectroscopy has proven most useful for the study of diagentically related minerals as often
occurs with uranyl secondary minerals 7-10,27. Some previous studies have been undertaken by
the authors using Raman spectroscopy to study complex secondary minerals formed by
crystallisation from concentrated sulphate solutions 28. The aim of this paper is to present
Raman and infrared spectra of natural sodium-zippeite and to discuss the spectra from the
structural point of view. The paper is a part of systematic studies of vibrational spectra of
minerals of secondary origin in the oxide supergene zone and their synthetic analogs.
Experiments
Minerals
The Na-zippeite minerals used in this work were obtained from the Mineralogical research
Company and originated from The Happy Jack Mine, White Canyon District, San Juan
County, USA. The mineral was analysed by EDX for chemical compoistion and by powder
X-ray diffraction for phase identification.
SEM and X-ray microanalysis
Zippeite samples were coated with a thin layer of evaporated carbon and secondary
electron images were obtained using an FEI Quanta 200 scanning electron microscope (SEM).
For X-ray microanalysis (EDX), three samples were embedded in Araldite resin and polished
with diamond paste on Lamplan 450 polishing cloth using water as a lubricant. The samples
were coated with a thin layer of evaporated carbon for conduction and examined in a JEOL
840A analytical SEM at 25kV accelerating voltage. Preliminary analyses of the zippeite
samples were carried out on the FEI Quanta SEM using an EDAX microanalyser, and
microanalysis of the clusters of fine crystals was carried out using a full standards quantitative
procedure on the JEOL 840 SEM using a Moran Scientific microanalysis system. Uranium
oxide was used as a standard for U. The K-Kα peak is strongly overlapped by the U-M lines
and was deconvolved using a peak strip routine, which gave similar results to a peak fit
routine used by the EDAX analysis software. However some uncertainty remains in the
quantitative measurements of K in the presence of U. Oxygen was not measured directly but
was calculated using assumed stoichiometries to the other elements analysed.
Raman spectroscopy
Crystals of the sodium zippeite were placed on the stage of an Olympus BHSM
microscope, equipped with 10x and 50x objectives and part of a Renishaw 1000 Raman
microscope system, which also includes a monochromator, a filter system and a Charge
Coupled Device (CCD). Raman spectra were excited by a HeNe laser (633 nm) at a resolution
of 2 cm-1 in the range between 100 and 4000 cm-1. Repeated acquisition using the highest
magnification was accumulated to improve the signal to noise ratio. Spectra were calibrated
3
using the 520.5 cm-1 line of a silicon wafer. In order to ensure that the correct spectra are
obtained, the incident excitation radiation was scrambled. Previous studies by the authors
provide more details of the experimental technique. Spectra at liquid nitrogen temperature
were obtained using a Linkam thermal stage (Scientific Instruments Ltd, Waterfield, Surrey,
England). Details of the technique have been published by the authors 29-32.
Infrared Spectroscopy
Infrared spectra were obtained using a Nicolet Nexus 870 FTIR spectrometer with a
smart endurance single bounce diamond ATR cell. Spectra over the 4000−525 cm-1 range
were obtained by the co-addition of 64 scans with a resolution of 4 cm-1 and a mirror velocity
of 0.6329 cm/s. Spectral manipulation such as baseline adjustment, smoothing and
normalisation was performed using the GRAMS® software package (Galactic Industries
Corporation, Salem, NH, USA).
Results and discussion
Scanning Electron Microscopy
The SEM image of the Na zippeite studied in this work is shown in Figures 1. The
numbers on the image show the points where EDX analyses were undertaken. Figure 1 shows
a mass of crystals agglomerated together. The crystals appear to have been formed in solution
as a colloid and possibly because of electrostatic attraction have assembled into a crystalline
mass. The agglomerated crystals are > 5 µm in length. Figure 1 shows the close relationship
between different single crystals and several edge to face and face to face stacking may be
observed. Such stacking supports the concept of electrostatic attraction between the particles.
Figure 1 seems to show the particles have been damaged through some mechanochemical
treatment such as a tumbling action. Many of the crystals are large and greater than 10
microns. SEM images reveal that the zippeite morphology consists of an array of rosettes of
flat elongated crystals. The rosettes may be up to 50 µm in diameter while individual crystals
are up to 20 µm in length and less than 0.5 µm in thickness.
The results of the EDX analyses of the zippeite are reported in Table 1. The
analyses are taken from different crystals. The presence of carbon results from the coating of
the sample. The zippeite from The Happy Jack Mine are based upon sodium as the
monovalent cation. Thus the formula of the zippeite samples studied is close to that for
synthetic Na-zippeite by Burns et al. 14. In Dana’s new mineralogy and Anthony´s Handbook,
a number of zippeites are characterised. One of the minerals among others from The Happy
Jack Mine is a sodium zippeite. Both report the Na-zippeite to be orthorhombic 33. It is noted
that a synthetic sodium-zippeite as prepared by Burns 14, Na5(H2O)12[(UO2)8(SO4)4O5(OH)3],
was monoclinic, P21/a, a 17.6425(110, b 14.6272(9), c 17.6922(11) Å, β 104.461(1)o, Z = 4.
Raman and Infrared Spectroscopy
In the crystal structure of synthetic Na zippeite, there are present four symmetrically
distinct S6+ [as (SO4)2- units]. Because of the Td symmetry lowering, all (SO4)2- vibrations
may be infrared and Raman active, and the doubly degenerate ν2 (SO4)2- bending vibrations,
the triply degenerate antisymmetric stretching vibrations ν3 (SO4)2- and the triply degenerate
4
bending vibrations ν4 (SO4)2- split. Raman and infrared bands assigned to the ν3 (SO4)2- are
located in the region 1280-1040 cm-1, bands attributed to the ν1 symmetric stretching
vibrations (SO4)-1 in 1020-950 cm-1, and bands assigned to the ν4 (SO4)2- and ν2 (SO4)2bending vibration in 680-560 cm-1 and 560-350 cm-1, respectively. As in the case of the
(UO2)2+ stretching vibrations, some overlap or coincidence of the (SO4)2- stretching vibrations
and δ U-OH bending is possible. Bands connected with libration modes of water molecules
may coincide especially with bands attributed to the (SO4)2- bending vibrations.
The Raman spectra in the 950 to 1050 cm-1 region of two mineral samples from the
happy Jack Mine are shown in Figure 2. The reason for showing the spectra of two samples is
to prove consistency of measurement. An intense band at 1009.5 cm-1 in the 298 K spectrum
which shifts to 1011.6 cm-1 in the 77 K spectrum is attributed to the SO 24 - symmetric
stretching vibration. The bands are asymmetric on the lower wavenumber side and an
additional band in the 1006-7 cm-1 position is observed. A single band was observed for
uranopilite at around 1008.7 cm-1 in the 298 K spectrum and at 1008.9 cm-1 in the 77 K
spectrum and is assigned to the SO 24 - symmetric stretching vibration 6-11,28. The band shows a
slight shift to higher wavenumbers upon cooling to 77 K. The infrared spectra of zippeite is
shown in Figure 3. A number of overlapping infrared bands are observed at 1173, 1140,
1100, 1069 and 1051 cm-1. A low intensity band is observed at ~1015 cm-1 and is assigned to
the infrared activated SO 24 - symmetric stretching vibration.
The infrared spectra of uranyl secondary minerals containing the sulphate anion as
reported by Čejka show that bands in the SO 24 - - symmetric stretching region may be but need
not be observed 34. Serezhkina et al. (1981) observed two bands at 1012 and 1002 cm-1 and
attributed them to the ν1 (SO4)2- 35. The Raman spectrum is clearer with a sharp intense
band at 1042 cm-1 attributed to the (SO4)2- symmetric stretching vibration. Three Raman
bands are observed at 1147, 1100 and 1090 cm-1 and are assigned to the (SO4)2- antisymmetric
stretching vibrations. In the infrared spectrum two bands are observed at 1145 and 1086 cm-1.
Serezhkina et al. (1982) attributed bands at 1227, 1160, 1140, 1070 and 1037 to the ν3 SO 24 - .
Čejka proposes that the symmetry of the (SO4)2- anion must be of C1 symmetry. If this is so
then the ν1 and ν2 bands become infrared active. In this work no infrared band equivalent to
the symmetric stretching mode is observed. Thus it is suggested that a higher site symmetry
C3v is possible. However, Serezhkina et al. (1982) assigned two bands to the ν1 SO 24 - as
mentioned above.
A number of Raman bands are observed in the 1050 to 1150 cm-1 region and are
assigned to the SO 24 - antisymmetric stretching vibrations (Figure 4). Raman bands are
observed at 1081, 1090.7 and 1130 cm-1 and shift to 1082, 1090 and 1132 cm-1 at 77 K. An
intense Raman band is observed for zippeite at 1261 cm-1 which shows a slight shift to lower
wavenumbers upon cooling to 77 K. One possible assignment is that this band is due to a UOH deformation mode. Four bands were observed for uranopilite at around 1178, 1145, 1115
and 1096 cm-1 (Frost et al in press). These bands were ascribed the SO 24 - antisymmetric
stretching vibrations. A broad band is also observed for uranopilite at 1272 cm-1. It is not
known what the attribution of this band is due to, but one possibility is that it is assignable to
U-OH deformation modes.
There are four bands observed for zippeite in the spectral profile centred upon 840
5
cm-1 at 840, 841, 833 and 823 cm-1 (Figure 5). These bands are assigned to the ν1 (UO2)2+
symmetric stretching vibrations. The bands show a slight shift to higher wavenumbers upon
collecting the spectra at 77 K. In the infrared spectrum of zippeite (Figure 3) two low
intensity bands are observed at 815 and 821 cm-1 and are attributed to the infrared ν1 (UO2)2+
symmetric stretching vibrations. The two infrared bands at 880 and 912 cm-1 are assigned to
the ν3 (UO2)2+ antisymmetric stretching vibrations. No Raman bands are observed in these
positions for Na zippeite. In the Raman spectrum of johannite in the 650 to 1100 cm-1 range at
298 K three bands are observed at 812, 788 and 756 cm-1 and are attributed to the ν1
symmetric stretching modes of the (UO2)2+ units. In the infrared spectrum of johannite two
bands are observed at 936 (as a shoulder) and 898 cm-1. Čejka assigned these bands to the ν3
antisymmetric stretching modes of the (UO2)2+ units 23. In the infrared spectrum a band of
uranopilite is observed at 838 cm-1 and are ascribed to the infrared activated symmetric
stretching modes. Multiple infrared bands for uranopilite are observed at 932, 912, 888 and
863 cm-1. The probable assignment of these bands is to the ν3 antisymmetric stretching modes
of the (UO2)2+ units, although there may be also a coincidence of the uranyl stretching
vibrations bands and those of δ U-OH bending bands.
U-O bond lengths in uranyls may be calculated with the empirical relations by Bartlett
and Cooney 36. Raman bands, observed in sample No.1 at 886.6 cm-1 /1.794 Å (298 K) and
888.6 cm-1 /1.793 Å (77 K) (IR bands 926.9 cm-1/1.765 Å; 908.7 cm-1 /1.778 Å; 894.2 cm-1
/1.789 Å; 884.7 cm-1 /1.796 Å ; 877.6 cm-1 /1.801 Å; 856.9 cm-1 /1.817 Å) and in sample No.
2 at 887 cm-1 /1.794 Å (298 K) and at 924.2 cm-1 /1.767 Å; 896.6 cm-1 /1.787 Å; 888.6 cm-1
/1.793 Å; 869.8 cm-1 /1.807 Å; 858.6 cm-1 /1.816 Å(77 K) (IR bands 926.2 cm-1 /1.766 Å; 912
cm-1 /1.776 Å; 880.4 cm-1 /1.799 Å; 858 cm-1 /1.816 Å) are attributed to the ν3 (UO2)2+
antisymmetric stretching vibrations. Raman bands in sample No. 1 at 841.4 cm-1 /1.770 Å;
839.8 cm-1 /1.771 Å; 833.5 cm-1 /1.777 Å; 823.3 cm-1/1.787 Å; 813.3 cm-1 /1.797 Å (298 K)
and at 844 cm-1 /1.767 Å; 843.4 cm-1 /1.768 Å; 838.3 cm-1/1.773 Å; 828.2 cm-1 /1/783 Å;
823.4 cm-1 /1.787 Å; 813.5 cm-1 /1.797 Å; 803.1 cm-1 /1.808 Å (298 K) (IR bands at 844.8
cm-1 /1.767 Å; 820.9 cm-1 /1.790 Å; 801.6 cm-1 /1.809 Å; 794 cm-1 /1.817 Å) and in sample
No. 2 841.5 cm-1 /1.770 Å; 839.8 cm-1 /1.771 Å; 832.8 cm-1 /1.778 Å; 824.8 cm-1 /1.786 Å;
812.9 cm-1 /1.798 Å; 807.7 cm-1 /1.803 Å) are assigned to the ν1 (UO2)2+ symmetric stretching
vibrations. U-O bond lengths calculated with two empirical relations 36 are in agreement with
those from the single crystal structure data ∅ 1.77 Å 14. An overlap / a coincidence of the
(UO2)2+ stretching vibrations and δ U-OH bending vibrations may be expected and cannot be
excluded. Raman and especially infrared bands connected with δ U-OH bending vibrations
are observed also in the region 1560-1300 cm-1 (Figure 4).
Bands in the region 560 – 350 cm-1 mostly connected with the (SO4)2- bending
vibrations are discussed below. However, some of the Raman bands in the range 560-440
cm-1 may be attributed to the ν (bridge elongation) (U3O), 390-350 cm-1 to the ν (group
elongation) U3(OH)3, 340-270 to the γ (out-of-plane bending) (U3O), and 230-210 cm-1 to the
γ (out-of-plane bending) and δ (in-plane bending) U3(OH)3. The presence of such units may
be predicted from the structure of synthetic sodium-zippeite. Bands observed at lower
wavenumbers than approximately 210 cm-1 are related to lattice vibrations and translations.
The Raman spectrum of the low wavenumber region of zippeite at 298 and 77 K are shown in
Figure 6. A band is observed at 669 cm-1 at 298 K and is assigned to the triply degenerate ν4
bending vibration of the (SO4)2- units. This band is found at 672 cm-1 at 77 K. No additional
bands were resolved at this temperature in this spectral region. In the infrared spectrum two
absorption bands are observed at 619 and 605 cm-1 and may be assigned to this vibrational
mode. Čejka found absorption band at 619 cm-1 which is in good agreement with this work 23,
6
and Serezhkina et al. found four bands at 642, 611, 605 and 595 cm-1 for johannite assigned to
the ν4 (SO4)2- .
Intense bands are observed in the 373 to 497 cm-1 region and are attributed to the ν2
bending modes of the (SO4)2- units. The observation of more than one band in this spectral
region suggests a lowering of the symmetry of the sulphate anion to C3v or less. Bands in the
398 cm-1 region are assigned to the ν2 SO42- bending vibrations. Some bands may be also
related to the ν U-Oequatorial , i.e. U-Oligand vibrations 37. Intense bands observed in the Raman
spectra at 77 K are also connected with these ν2 SO42- bending vibrations. Bands at
wavenumbers lower than 320 cm-1 observed in the Raman spectra (Fig. 6) - not measured in
the infrared spectra, are attributed to the ν2 (δ) UO22+ bending vibrations and the lowest bands
(180-260 cm-1) may be assigned to the lattice and/or OI-U-Oligand vibrations 38 and /or cation
and anion librations 39. In each of the spectra bands are observed at around 322, 294, 260 cm1
. Any unambiguous assignment of bands in this range is very complex.
In the 298 K spectrum for johannite Frost et al found three bands are observed at 302, 277 and
205 cm-1. In the 77 K spectrum, bands shifted to 306, 282, 231 and 210 cm-1 with other low
intensity bands found at 191, 170 and 149 cm-1. In the infrared spectrum of johannite Čejka
assigned the two bands at 257 and 216 cm-1 to the doubly degenerate ν2 bending vibration of
the (UO2)2+ units.
OH stretching region
In the crystal structure of sodium-zippeite, there are three symmetrically distinct
hydroxyls in the uranyl anion sheet, and twelve water molecules in the interlayer 14. Water
molecules are coordinated to Na+-cations and participate together with the sheet hydroxyls in
formation of hydrogen-bonding network. This hydrogen-bonding network influences origin
and formation of the crystal structure of sodium-zippeite and plays an important role in the
stability of this natural phase 40-42. Infrared bands in the range 3600-2800 cm-1 are attributed
to the ν OH stretching vibrations of water molecules and hydroxyls without any possible
resolution the ν1 and ν3 (Figure 7). Libowitzky‘s empirical relation enables to infer the OH…O bond lengths from the wavenumbers of the observed tops of bands 43. These lengths
(cm-1/Å) are for sample No.1 3600/>3.2; 3558.6/3.04; 3504.2/2.902; 3475.7/2873;
3455.9/2853; 3302.4/2.75; 3079.1/2.676; 2876.8/2.63 and for sample No. 2 3600/>3.2;
3559.3/3.042; 3505.2/2.905; 3456.1/2853; 3452.1/2.85; 3281.1/2.74; 3127.4/2.687.
From the observed and calculated data may be inferred that there are free or very
weakly bonded three (OH)- units in the structure of both sodium-zippeite samples. This is in
agreement with the structure 14. Deconvolution of broad bands enables to prove the presence
of strongly hydrogen bonded water molecules 14. Uranyl oxygen and some other uranyl anion
sheet oxygens and hydroxyls may participate in the formation and arrangement of the
hydrogen-bonding network with water molecules from the interlayer. Hydrogen bonding
between water molecules in the interlayer is also supposed. According to Hawthorne 44, a
complex crystal structure may be understood as composed of two units - strongly bonded
structural units – uranyl anion sheets , and the weakly bonded interstitial complex – the
interlayer. The bonding interaction between the structural unit and the interstitial complex is
weak. This weak interaction controls the stability of the structure 44.
A set of 5 bands (1645.7; 1628.8; 1625.2; 1618.6 cm-1) for sample No. 1 and of 3
bands (1646.3; 1627.8; 1619.7 cm-1) may be assigned to the δ H2O bending vibrations (Figure
8). Only bands at 1612.9 cm-1 (298 K) and 1675.3 cm-1 (77 K) were observed in the Raman
7
spectra of sample No. 2. Raman and infrared spectroscopy study of sodium-zippeite confirms
that structurally nonequivalent water molecules are present in its structure. This is in
agreement with the structure 14 and thermal analysis 23 of synthetic sodium-zippeite.
Conclusions
(a) Raman and infrared spectra of two samples of sodium-zippeite from Happy Jack Mine
were studied.
(b) Bands connected with the (UO2)2+ and (SO4)2- stretching and bending vibrations were
attributed respecting their number as a result of FGA-correlation.
(c) Coincidence of some of these bands with the bands assigned to U-OH bending vibrations
is probable.
(d) U-O bond lengths in uranyls were calculated and compared with the X-ray single crystal
structure data. Both data are in good agreement.
(e) Three free or very weak hydrogen bonded symmetrically distinct hydroxyls located in the
sheets were inferred from the spectra. This agrees with the structure of sodium-zippeite.
(f) Water molecules of the interlayer participate in a set of hydrogen bonds forming thus a
complex hydrogen-bonding network which influences the origin, formation and stability
of the mineral.
(g) Relatively large interlayer probably enables introducing of mono- and/or divalent-cations
and water molecules influencing thus possible existence of solid solutions 2 and mineral
stability by hydrogen-bonding network 40,41,44 .
8
References
1.
2.
3.
4.
5.
6.
7.
8.
9.
10.
11.
12.
13.
14.
15.
16.
17.
18.
19.
20.
21.
22.
23.
24.
25.
26.
27.
28.
29.
30.
31.
32.
33.
34.
35.
36.
37.
38.
39.
40.
41.
42.
43.
44.
Finch, R, Murakami, T. Reviews in Mineralogy 1999; 38: 91.
McCollam, BE. University of Notre Dame 2004.
Frondel, C Systematic Mineralogy of Uranium and Thorium, 1958.
Frondel, C, Weeks, AD. Proc. UN Intern. Conf. Peaceful Uses Atomic Energy, 2nd, Geneva, 1958
1958; 2: 277.
Frondel, C, Ito, J, Honea, RM, Weeks, AM. Canadian Mineralogist 1976; 14: 429.
Frost, RL, Cejka, J, Weier, M, Ayoko, GA. Journal of Raman Spectroscopy 2006; 37: 1362.
Frost, RL, Cejka, J, Weier, M, Martens, WN. Journal of Raman Spectroscopy 2006; 37: 879.
Frost, RL, Cejka, J, Weier, ML, Martens, W. Journal of Raman Spectroscopy 2006; 37: 538.
Frost, RL, Weier, ML, Cejka, J, Kloprogge, JT. Journal of Raman Spectroscopy 2006; 37: 585.
Frost, RL, Weier, ML, Reddy, BJ, Cejka, J. Journal of Raman Spectroscopy 2006; 37: 816.
Frost, RL, Henry, DA, Erickson, K. Journal of Raman Spectroscopy 2004; 35: 255.
O'Brien, TJ, Williams, PA. Inorganic and Nuclear Chemistry Letters 1981; 17: 105.
Haacke, DF, Williams, PA. Mineralogical Magazine 1979; 43: 539.
Burns, PC, Deely, KM, Hayden, LA. Canadian Mineralogist 2003; 41: 687.
Burns, PC. Can. Mineral 2005; 43: 1839.
Burns, PC, Ewing, RC, Hawthorne, FC. Canadian Mineralogist 1997; 35: 1551.
Burns, PC, Miller, ML, Ewing, RC. Canadian Mineralogist 1996; 34: 845.
Ondrus, P, Veselovsky, F, Hlousek, J, Skala, R, Vavrin, I, Fryda, J, Cejka, J, Gabasova, A. Journal of
the Czech Geological Society 1997; 42: 3.
Elton, NJ, Hooper, JJ. Mineralogical Magazine 1993; 57: 352.
Paulis, P, Sikola, D, Holeczy, D. Vestnik Ceskeho Geologickeho Ustavu 1994; 69: 87.
Meisser, N. 2003.
Sejkora, J, Cejka, J, Škácha, P, Gabašová, A, Novotná, M. Bull. mineral.-petrolog. Odd. Nár. Muz
(Praha) 2003; 11: 183.
Cejka, J. Reviews in Mineralogy 1999; 38: 521.
Frost, RL, Palmer, SJ, Bouzaid, JM, Reddy, BJ. Journal of Raman Spectroscopy 2007; 38: 68.
Frost, RL, Henry, DA, Weier, ML, Martens, W. Journal of Raman Spectroscopy 2006; 37: 722.
Frost, RL, Musumeci, AW, Kloprogge, JT, Adebajo, MO, Martens, WN. Journal of Raman
Spectroscopy 2006; 37: 733.
Frost, RL, Weier, ML, Martens, WN, Kloprogge, JT, Kristof, J. Journal of Raman Spectroscopy 2005;
36: 797.
Frost, RL, Wills, R-A, Weier, ML, Martens, W. Journal of Raman Spectroscopy 2005; 36: 435.
Frost, RL, Weier, ML. Thermochimica Acta 2003; 406: 221.
Frost, RL, Weier, ML, Kloprogge, JT. Journal of Raman Spectroscopy 2003; 34: 760.
Frost, RL, Weier, ML. Journal of Raman Spectroscopy 2003; 34: 776.
Frost, RL, Weier, ML. Thermochimica Acta 2004; 409: 79.
Gaines, RV, Skinner, HCW, Foord, EE, Mason, B, Rosenzweig, A Dana's new mineralogy, 8th ed.;
John Wiley and Sons: New York, 1997.
Cejka, J, Urbanec, Z, Cejka, J, Jr., Mrazek, Z. Neues Jahrbuch fuer Mineralogie, Abhandlungen 1988;
159: 297.
Serezhkin, VN. Geokhimiya 1981: 1677.
Bartlett, JR, Cooney, RP. Journal of Molecular Structure 1989; 193: 295.
Hoekstra, HR, Siegel, S. Journal of Inorganic and Nuclear Chemistry 1973; 35: 761.
Volod'ko, LV, Komyak, AI, Umreiko, DS Uranyl Compounds, Vol. 1: Spectra, Structure, 1981.
Anderson, A, Chieh, C, Irish, DE, Tong, JPK. Canadian Journal of Chemistry 1980; 58: 1651.
Hawthorne, FC. Zeitschrift fuer Kristallographie 1992; 201: 183.
Hawthorne, FC. Acta Crystallographica, Section B: Structural Science 1994; B50: 481.
Hawthorne, FC. EMU Notes in Mineralogy 1 1997; European Mineralogical Union: 373.
Libowitzky, E. Monatshefte fuer Chemie 1999; 130: 1047.
Hawthorne, FC. Geologiya Rudnykh Mestorozhdenii 2003; 45: 100.
9
Table 1. Elemental concentrations in weight % from EDX analyses of crystal clusters
from the zippeite sample from Happy Jack Mine, USA. Oxygen was calculated
indirectly by stoichiometry.
Wt %
1
2
3
4
4’
5
C
11.16
-
O
19.73
8.94
21.72
25.96
34.85
3.05
U
76.21
89.08
74.78
52.53
59.13
95.03
10
S
1.99
1.25
2.65
2.99
3.36
1.92
Na
2.07
0.73
0.84
5.11
2.66
0
Total
100.00
100.00
99.99
100.00
100.00
100.00
ν3
cm-1
36
ν1
cm-1
36
IR
890.1
1.773 Å
1.792 Å
1.787 Å
IR
850.4/798.6
1.761 Å
1.812 Å
Raman
Raman
298 K
298 K
888.2
880.7
1.775 Å
1.779 Å
1.793 Å
1.799 Å
1.788 Å
1.792 Å
Raman
Raman
298 K
298 K
845.7/827.3/810.2 841.1/830.4
1.766 Å
1.770 Å
1.783 Å
1.780 Å
1.800 Å
Raman
77 K
864.4
1.790 Å
1.811 Å
1.802 Å
Raman
77 K
812.9
1.790 Å
Table 2 Comparison of the bond lengths as calculated from the ν1 and ν3 band positions
11
List of Figures
Figure 1 SEM image of sodium zippeite from the Happy Jack Mine. (The numeric
indicates an exasmple of the the position of the EDX analyses)
Figure 2 Raman spectra of sodium zippeite in the 950 to 1050 cm-1 region at 298 and 77
K.
Figure 3 Infrared spectra of sodium zippeite in the 500 to 1300 cm-1 region
Figure 4 Raman spectra of sodium zippeite in the 1050 to 1450 cm-1 region at 298 and 77
K.
Figure 5 Raman spectra of sodium zippeite in the 750 to 950 cm-1 region at 298 and 77
K.
Figure 6 Raman spectra of sodium zippeite in the 150 to 750 cm-1 region at 298 and 77
K.
Figure 7 Infrared spectra of sodium zippeite in the 2550 to 3700 cm-1 region
Figure 8 Infrared spectra of sodium zippeite in the 1400 to 1800 cm-1 region
List of Tables
Table 1. Elemental concentrations in weight % from EDX analyses of crystal clusters
from the zippeite sample from Happy Jack Mine, USA. Oxygen was calculated
indirectly by stoichiometry.
Table 2 Comparison of the bond lengths as calculated from the ν1 and ν3 band positions
12
Figure 1
13
Figure 2
14
Figure 3
15
Figure 4
16
Figure 5
17
Figure 6
18
Figure 7
19
Figure 8
20
21

© Copyright 2026