
SYSTEMATIC PROCESSING OF MARS EXPRESS HRSC IMAGE
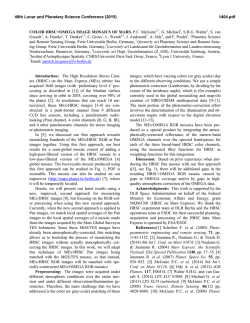
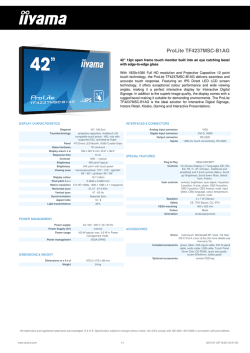
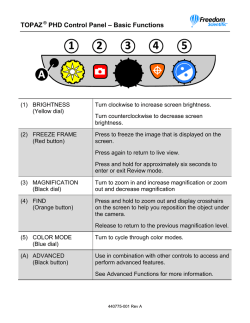
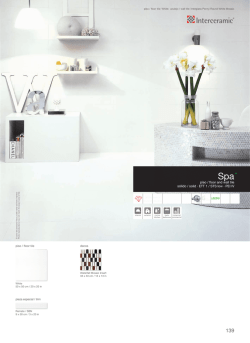
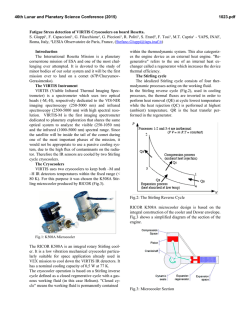
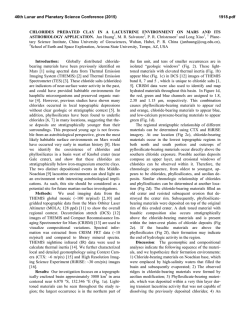
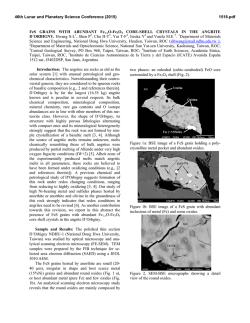
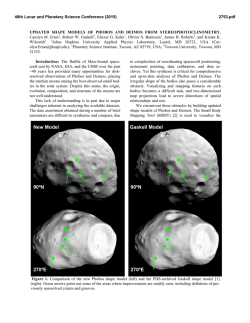
46th Lunar and Planetary Science Conference (2015)
2387.pdf
SYSTEMATIC PROCESSING OF MARS EXPRESS HRSC IMAGE MOSAIC QUADRANGLES G. Michael, S. Walter, P. McGuire, T. Kneissl, S. van Gasselt, C. Gross, B. Schreiner, W. Zuschneid. Planetary Sciences
and Remote Sensing, Institute of Geological Sciences, Freie Universitaet Berlin, Malteser Strasse 74-100, Haus D,
Berlin 12249, Germany.
Introduction: Mars Express HRSC image strips
show varying brightnesses caused by differing illumination and atmospheric conditions. Lambert correction
improves the situation [1], but not sufficiently for a
visually consistent mosaic (Fig 1).
plying a gaussian blur (without changing average spatial brightness characteristic).
a
b
c
Fig 2. a) TES b) Tied HRSC over TES c) Intermediate brightness
reference
Fig 1. After Lambert correction: strips generally have good internal
illumination consistency, but atmospheric variability between strips
remains strongly visible (the area shown is particularly difficult)
There is not yet a systematically applicable correction for atmospheric effects for HRSC, which means
that it cannot provide accurate information on surface
albedo variations on scales greater than the image strip
width. HRSC was conceived as a high resolution instrument, so this is not necessarily a problem: the
global albedo of Mars at lower resolution is already
well known, e.g. from TES [2], and if this is utilised as
a brightness reference for individual HRSC strips, they
can be brought into mutual consistency.
Method: We construct the mosaic according to the
following scheme:
Step 1: Apply Lambert correction and map-project
image strips (see [1])
Step 2: Create intermediate resolution brightness
reference map (Fig 2). Divide HRSC strip into cells
and tie local mean of HRSC pixels to local mean of
equivalent area in albedo map (using a continuous interpolation). Mosaic at moderate resolution to obtain
higher resolution brightness reference map with same
average brightness characteristics as source albedo
map. Eliminate remaining image edge artefacts by ap-
Step 3: Create full resolution mosaic, tied to intermediate brightness reference map (Fig 3). Process
images at full resolution, tying locally (and continuously) to intermediate brightness reference map, this
time measured over smaller patches over each strip.
Place into mosaic, feathering (i.e. fading from 0% to
100% transparency) over a narrow range of pixels.
Note that feathering helps to hide the image boundary,
but is only effective if the image brightnesses are well
matched.
a
b
c
Fig 3. a) Tied HRSC over TES b) Intermediate brightness reference
c) Final mosaic, 12.5 m/pix
Step 4: Image sequence optimisation. Images are
put into the mosaic in order of best ground sampling
resolution (lowest to highest). In cases where this is
not the optimal sequence (for reasons of quality or
consistency) we manually construct a list of ordering
relations. This is done by comparison of the assembled
mosaic with individual image strips.
46th Lunar and Planetary Science Conference (2015)
Step 5: Contrast recovery. A significant number of
images show reduced contrast caused by increased
atmospheric scattering, appearing in the processed
mosaic as relatively flat bands. Contrast is recovered
by stretching the histogram width by a factor of typically 1.5-6, the amount being adjusted iteratively after
inspection of the assembled mosaic (Fig 4).
a
2387.pdf
morphological studies in the absence of a full correction of atmospheric effects (Fig 6). We have begun
systematic processing of the complete HRSC dataset,
working according to the USGS MC-30 quadrangle
scheme.
b
Fig 4. a) Mosaic with overlaid very low contrast images 1903_0000
(left), 1892_0000 (centre) b) Mosaic including images 1903_0000,
1892_0000 with contrast increases of 6x, 5x
Step 6: Colour processing. We have achieved some
preliminary results in systematic processing of the colour channels using a similar technique, using a constant value for each colour channel instead of the
brightness reference map, and restoring the larger scale
brightness features by pan-sharpening the colour mosaic with that of the nadir channel (Fig 5). This means
that colour differences are retained at local scales (less
than the strip width), but not over longer distances,
which may be sufficient for geomorphological interpretations at scales close to the resolution of the HRSC
instrument.
Fig 5. A colour mosaic including about 20 image strips in the Aram
Chaos region
Acknowledgement: We thank the HRSC experiment team at DLR Berlin and the Mars Express operations team at ESOC for their successful planning, acquisition and processing of the HRSC data. The work
was supported by the German Space Agency (DLR
Bonn), grant 50QM1301 (HRSC on Mars Express), on
behalf of the German Federal Ministry for Economic
Affairs and Energy.
References: [1] Walter et al. (this conference, abs.
#1434) [2] Christensen et al., J. Geophys. Res., 106,
23823-23871, 2001.
Conclusion: We have shown that it is possible to
produce a visually consistent image mosaic for geo-
Fig 6. MC-11 Oxia Palus quadrangle composed from 184 image strips


© Copyright 2026