
Final Revised Paper
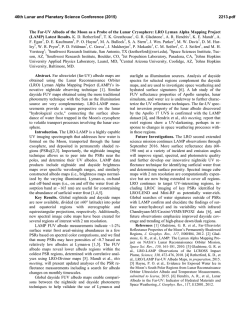
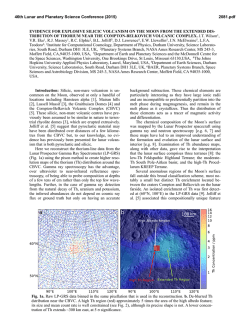
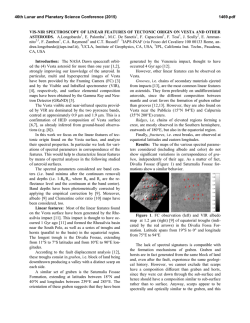
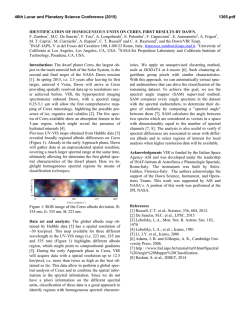
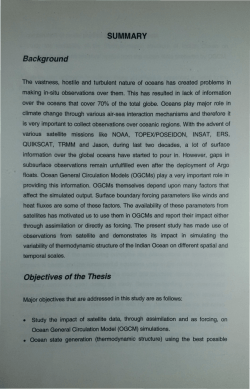
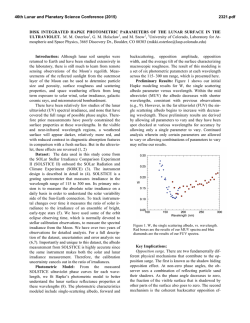
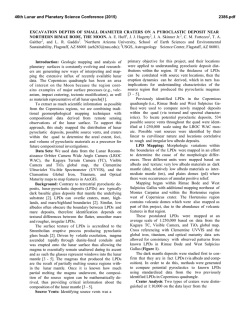
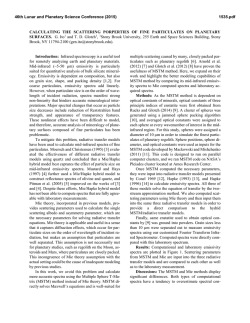
Biogeosciences, 12, 557–565, 2015
www.biogeosciences.net/12/557/2015/
doi:10.5194/bg-12-557-2015
© Author(s) 2015. CC Attribution 3.0 License.
Global analysis of radiative forcing from fire-induced shortwave
albedo change
G. López-Saldaña, I. Bistinas, and J. M. C. Pereira
Centro de Estudos Florestais, Instituto Superior de Agronomia, Universidade de Lisboa, Tapada da Ajuda,
1349-017 Lisboa, Portugal
Correspondence to: G. López-Saldaña ([email protected])
Received: 30 April 2014 – Published in Biogeosciences Discuss.: 28 May 2014
Revised: 13 November 2014 – Accepted: 1 December – Published: 29 January 2015
Abstract. Land surface albedo, a key parameter to derive
Earth’s surface energy balance, is used in the parameterization of numerical weather prediction, climate monitoring
and climate change impact assessments. Changes in albedo
due to fire have not been fully investigated on a continental and global scale. The main goal of this study, therefore,
is to quantify the changes in instantaneous shortwave albedo
produced by biomass burning activities and their associated
radiative forcing.
The study relies on the MODerate-resolution Imaging
Spectroradiometer (MODIS) MCD64A1 burned-area product to create an annual composite of areas affected by fire and
the MCD43C2 bidirectional reflectance distribution function (BRDF) albedo snow-free product to compute a bihemispherical reflectance time series. The approximate day
of burning is used to calculate the instantaneous change in
shortwave albedo. Using the corresponding National Centers
for Environmental Prediction (NCEP) monthly mean downward solar radiation flux at the surface, the global radiative
forcing associated with fire was computed.
The analysis reveals a mean decrease in shortwave albedo
of −0.014 (1σ = 0.017), causing a mean positive radiative
forcing of 3.99 Wm−2 (1σ = 4.89) over the 2002–20012
time period in areas affected by fire. The greatest drop in
mean shortwave albedo change occurs in 2002, which corresponds to the highest total area burned (378 Mha) observed in
the same year and produces the highest mean radiative forcing (4.5 Wm−2 ).
Africa is the main contributor in terms of burned area, but
forests globally give the highest radiative forcing per unit
area and thus give detectable changes in shortwave albedo.
The global mean radiative forcing for the whole period stud-
ied (∼ 0.0275 Wm−2 ) shows that the contribution of fires to
the Earth system is not insignificant.
1
Introduction
Land surface conditions have a strong impact on the Earth’s
system energy balance through changes in land surface
albedo that induce a radiative forcing by perturbing the
shortwave radiation budget (Ramaswamy et al., 2001).
The total solar incoming radiation has a mean strength of
∼ 1366 Wm−2 (“solar constant”) and has an irregular cycle
of about 11 years, causing a variation of ±0.5 Wm−2 (Gray,
2010). Since, on average, the Earth absorbs energy at the rate
of (1 − A) ITS /4 (Gray, 2010), where A is the Earth’s albedo
and ITS the total solar irradiance, taking ITS = 1366 Wm−2
and a mean albedo of the Earth A = 0.3 (Prentice at al.,
2012), the solar power available to the whole Earth system is 239.05 Wm−2 . The importance of quantifying changes
in albedo arises here. The global mean concentration of
CO2 in 2005 was 379 ppm, leading to a radiative forcing of
+1.66 Wm−2 (1σ = 0.17) (Forster et al., 2007), while that
of changing the planetary albedo by as little as 0.01 can produce a change in the radiation balance of 2.39 Wm−2 , revealing that even small changes in albedo can have a substantial
impact on the Earth system.
Fire has a strong influence on climate due to the release
of atmospheric aerosols and gases and can modify surface
albedo by the removal of vegetation and deposition of ash
and charcoal (Bowman, 2009). Earlier studies aimed to quantify the impact of fires on the land surface albedo. Govaerts et
al. (2002) analysed a Meteosat albedo time series for 1996 in
Published by Copernicus Publications on behalf of the European Geosciences Union.
558
G. López-Saldaña et al.: Global analysis of radiative forcing
Northern Hemisphere Africa and, using fire-induced albedo
perturbation probabilities, estimated that fires are responsible
for a relative albedo decrease as large as 25 %. Jin and Roy
(2005) used MODIS (MODerate-resolution Imaging Spectroradiometer) data to estimate a mean 2003 instantaneous
shortwave albedo change of −0.024 over all the burned areas
in the Australian tropical savanna, which exerted a shortwave
surface radiative forcing of 6.23 Wm−2 . Several studies have
been carried out in the boreal area: Jin et al. (2012a) analysed
the sensitivity of spring albedo to the MODIS-derived difference Normalized Burn Ratio (dNBR), while Jin et al. (2012b)
found a fire-induced surface shortwave forcing (SSF) integrated over an annual cycle of −4.1 Wm−2 between southern
and northern boreal regions. However, studies over longer
time periods on a global scale are needed to improve the understanding of the influence of fire on the Earth system as an
agent of land surface alteration and its impact on the energy
balance.
No earlier studies have attempted to quantify the impact
of fire on shortwave albedo on a global scale; therefore, the
main goal of this study is to quantify the “instantaneous”
shortwave albedo change in areas affected by fire and the
corresponding radiative forcing at the surface. The radiative
forcing contributed by aerosols produced by fires is not considered, since the scope of the study is to investigate exclusively the impact of fires at the surface. We derived an albedo
time series and then calculated the difference in the pre- and
post-fire shortwave albedo only in areas affected by fire for
the 200–2012 time period. The radiative forcing exerted by
the changes in albedo was calculated using the total solar incoming radiation.
2
2.1
Data
Albedo time series generation and burned-area
identification
The shortwave albedo time series was generated using
the MODIS Collection 5 bidirectional reflectance distribution function (BRDF) albedo snow-free quality product
(MCD43C2) (Schaaf et al., 2002). It is produced on a 16-day
basis with an 8-day overlap projected to a 0.05◦ latitude–
longitude climate modelling grid (CMG). The product models the surface anisotropy using all high-quality, cloud-free,
snow-free and atmospherically corrected land surface reflectance obtained within a 16-day time period. When there
are more than seven of these observations, a so-called full
model inversion is attempted to retrieve the BRDF parameters based on the RossThickLiSparse–Reciprocal BRDF
model (Lucht et al., 2000). If there are only three to six of the
aforementioned observations over the 16-day time period, a
backup algorithm is used; it is based on an archetypal BRDF
model parameter which is defined with respect to 25 global
land cover classes and from historical high-quality retrievals
Biogeosciences, 12, 557–565, 2015
(Ju et al., 2010). Data for 11 years, 2002–2012, were downloaded from the Land Processes Distributes Active Archive
Center (LP DAAC) data pool.
In order to use only the highest-quality data, the
BRDF_Quality science data set provided with the MCD43C2
was analysed. Only pixels with the best quality (75 % or more
with best full inversions) and good quality (75 % or more
with full inversions) were kept for further processing. The
global bihemispherical reflectance (αBHR ) under isotropic illumination, also designated white-sky albedo, for every 16day time period was computed using
αBHR (λ) = fiso (λ) giso + fvol (λ) gvol + fgeo (λ) ggeo ,
(1)
where fiso , fvol and fgeo are the three BRDF model parameters: isotropic, volumetric and geometric. The integrated
coefficients have the following values: giso = 1.0; gvol =
0.189184; and ggeo = −1.377622.
Some areas can show gaps caused by a lack of high-quality
data and by the screening based on the BRDF_ Quality
flag. A linear temporal interpolation was computed to create
a synthetic, temporally and spatially continuous shortwave
albedo product. The interpolation was performed on a yearly
basis but taking into account 1 month before and after the calendar year to be able to fill gaps at the very beginning or at the
very end of the year. The final product consists of a gap-free
16-day (with an 8-day overlap) snow-free broadband shortwave albedo time series with a 0.05◦ spatial resolution for
2002–2012.
2.2
Burned-area identification
The areas affected by fire each year were derived using the
MODIS Collection 5.1 Direct Broadcast Monthly Burned
Area Product (MCD64A1) (Gilgio et al., 2009). The product
identifies post-fire burned areas using daily 500 m surface reflectance coupled with 1km MODIS active fire observations.
Twelve years of data were downloaded from (MCD64A1
burned-area product) spanning the years 2002 to 2012. The
spatial resolution of the product is 500 m and is generated on
a monthly basis. It was necessary to perform a spatial aggregation on the monthly data sets to 0.05◦ to match the CMG
spatial resolution. The proportion of the CMG pixel that was
affected by fire was calculated, thus giving a fractional burn
area estimate. When more than one date was found inside a
CMG pixel, the mode of the day of burning was set as the day
of burning. The annual burned-area data set was generated
selecting the approximate day of burned from the monthly
data sets. When more than one day was found the earliest
date was selected.
2.3
Land-use–land-cover (LULC) maps
The MODIS Collection 5.1 Land Cover Type Yearly L3
Global 0.05Deg CMG (MCD12C1) (Friedl et al., 2010)
is produced at 0.05◦ spatial resolution and provides the
www.biogeosciences.net/12/557/2015/
G. López-Saldaña et al.: Global analysis of radiative forcing
dominant land cover type and the sub-grid frequency land
cover class distribution within each 0.05◦ cell.
In order to analyse major biomes, an aggregation of the
land cover classes was performed. For every year from 2002
to 2012, the following groups were created: (1) all forest
classes (evergreen needleleaf forest, evergreen broadleaf forest, deciduous needleleaf forest, deciduous broadleaf forest,
mixed forests) were aggregated into a single “Forest” class;
(2) croplands and a cropland/natural vegetation mosaic was
aggregated into the “Croplands” class; (3) closed shrubland,
open shrublands, woody savannas, savannas, grasslands and
permanent wetlands were aggregated into the “non-forest”
class. The aggregation takes into account the confidence
level; the “majority land cover type 2” was only used when
confidence was below 60 %.
Additionally to the analysis per land cover, an analysis per
continent was be performed.
2.4
Downward shortwave solar radiation flux at the
surface
The National Centers for Environmental Prediction and the
National Center for Atmospheric Research (NCEP–NCAR)
Reanalysis 1 (Kalnay et al., 1996) provides the monthly
mean downward solar radiation flux (dswrf) at the surface in
Wm−2 in 1.8◦ by 1.8◦ grid cells from 1948 to 2013. The full
reanalysis data set was obtained from NCEP/NCAR dswrf
at the surface. A temporal subset was extracted to obtain 12
years of monthly dswrf from 2002–2012.
3
Quantification of albedo change and associated
radiative forcing
3.1
Method description
For every pixel identified as affected by fire within a calendar
year, the change in broadband shortwave albedo is calculated
as
Afire = Apost − Apre ,
(2)
where Afire is the “instantaneous” land surface shortwave
albedo change when subtracting the pre-fire albedo (Apre )
from the post-fire albedo (Apost ).
The selection of the dates to compute the change in albedo
is not straightforward, and several factors must be taken into
account.
First, the albedo time series was computed using the
BRDF model parameters, and these parameters were derived fitting a BRDF model using all high-quality observations within a 16-day time period. The assumption is that,
even when there may be day-to-day changes in land surface
condition, these high-quality observations have normally distributed random noise and can describe the BRDF (Lucht and
Lewis, 2000). However, fire affects vegetated areas, which
www.biogeosciences.net/12/557/2015/
559
generally are very reflective in the near-infrared and which,
after a burning event, show a decrease in reflectance due to
vegetation loss and deposition of charcoal and ash (Pereira,
1999; Stroppiana, 2002). Additionally, some fire events may
last more than 1 day in several areas around the globe (Chuvieco et al., 2008). Therefore, the 16-day time periods adjacent to the approximate day of burned might have used mixed
observations, burned and non-burned, to fit the BRDF model,
resulting in a smooth transition from the pre-fire to post-fire
albedo rather than a sharp change.
Second, there are uncertainties regarding the day of burning. The MCD64A1 product relies on both daily surface reflectance and daily fire masks. However, a minimum of approximately 10 days of cloud-free observations before and
after to accommodate the moving windows employed in the
change-detection process are needed; a lack of data due to
clouds or coverage gaps doubles the number of days required
(Gilgio et al., 2009). Additionally, the quality assessment
(QA) scientific data set (SDS) masks surface reflectance pixels when an active fire is detected, which increases the temporal uncertainty in the identification of the day of burned.
Given these two factors, an analysis to quantify the length
of the window was carried out, centred on the approximate
day of burning, which is needed to compute the change in
albedo was carried out. The result is that, on a global scale, it
is best to use a 32-day window. The Apre date was set, identifying the maximum albedo previous to the fire occurrence,
while the Apost date is the minimum albedo value after the
fire.
Ramaswamy et al. (2001) define radiative forcing as “the
change in net (down minus up) irradiance (solar plus longwave; in Wm−2 )”. In this study, we do not consider longwave
forcing. Once the change in albedo Afire was computed,
the shortwave radiative forcing at the surface F0 exerted
by changes in shortwave albedo due only to fire is estimated
as
↓
F0 = −dswrf0
Afire ,
↓
where −dswrf0 is the monthly mean downward solar radiation flux (dswrf) at the surface in Wm−2 ; the subscript (0 )
denotes the quantity at the surface.
4
Results
The global spatial distribution of mean radiative forcing
caused by “instantaneous” shortwave albedo changes on areas affected by fires is depicted in Fig. 1. Most fires occur in
tropical and subtropical environments. High values of radiative forcing in those areas, e.g. greater that 5 Wm−2 in those
areas, shown by dark red shading, might suggest frequent intense fire occurrence like in South Sudan, Angola and northern Australia, whereas low forcing in dark blue shades, such
as the big cluster in the Ukraine and the southwest corner
Biogeosciences, 12, 557–565, 2015
560
G. López-Saldaña et al.: Global analysis of radiative forcing
Radiative forcing (W m−2 )
5.0
Radiative forcing
4.5
4.0
3.5
3.0 2002
2004
2006
0.012
Biogeosciences, 12, 557–565, 2015
Albedo change
2012
2010
2012
2010
2012
2010
2012
0.014
0.015
0.016
0.017 2002
2004
2006
Annual burned area (Mha)
400
2008
Burned area
380
360
340
320
300
280 2002
Downward shortwave radiation (W m−2 )
of the Russian Federation, is related to frequent non-intense
fires.
Overall, the trend in burned area for the whole studied period is negative; however, the albedo change and the radiative
forcing show no significant trend (Fig. 2). The mean albedo
changes, considering the change between post-fire shortwave
albedo minus the pre-fire value, have a slight annual decrease matching the trend of the total annual area burned.
Ultimately, a fire event will decrease the shortwave albedo,
resulting in a positive radiative forcing in return. Figs. 5 and
6 show, for the Sahel and Australia, the approximate day of
burning (DoB), instantaneous shortwave albedo change, the
relative albedo change and the associated radiative forcing.
Areas in red tones indicate a large change, and areas in blue
shading indicates a small difference in the albedo changes.
Nevertheless, the consistent decrease in burned area did not
produce a significant decrease in albedo changes; this could
be explained due to alterations in fire intensity.
The global mean change in albedo is −0.014 (σ = 0.017),
causing a mean positive radiative forcing of 3.99 Wm−2 (σ =
4.89) on a global mean annual burned area of 349.48 Mha
(σ = 21.81 Mha) during the 2002–2012 time period.
In order to quantify the global or regional impact, it is necessary to normalize the forcing by the proportion of the total
area burned to the total surface. Given r = 6371007.181 m
as the radius of the idealized sphere representing the Earth,
the total global surface is 4π r 2 , ∼ 510.07 Mkm2 . Assuming
that land makes up 30 % of the planet and given the mean
radiative forcing in areas where fire occurred during 2002–
2012 is 3.99 Wm−2 , the global mean forcing only on land
is only 1.197 Wm−2 . The mean annual global area affected
by fires during the 11 years comprising the study period is
349.48 Mha or 3.4948 Mkm2 , ∼ 0.69 % of the Earth’s surface. Using again the mean radiative forcing in areas where
fire occurred during 2002–2012 (3.99 Wm−2 ) and multiplying this by the proportion of area affected by fire, the global
mean radiative forcing is 0.0275 Wm−2 . When performing
the same calculation on a regional scale, for instance, Australia, the mean radiative forcing is 5.71 Wm−2 and the mean
2010
Albedo change
0.013
Figure 1. Global mean radiative forcing caused by “instantaneous”
shortwave albedo changes in areas affected by fires during 2002–
2012. The values were normalized using a logarithmic scale.
2008
2004
2006
280
2008
Radiation
275
270
265
260 2002
2004
2006
Year
2008
Figure 2. Temporal changes in the annual global radiative forcing induced by fires and albedo change spanning the years 2002 to
2012. Bottom plots show the total annual burned area and the downward shortwave radiation fluxes at the surface. The dashed lines
depict linear trends, where changes of rate per year are, for radiative forcing, −0.016 Wm−2 ; albedo change is 9.33e-05; the burned
area is −2.15 Mha; and downward shortwave incoming radiation is
0.14 Wm−2 .
area burned is 0.502 Mkm2 , representing the 6.53 % of the
Australian territory. Therefore, the mean radiative forcing for
Australia is 0.373 Wm−2 , an order of magnitude higher than
the global number.
4.1
Interannual variability and land cover affected
On the global scale, the highest mean radiative forcing occurs
in forested areas in 2003, in 2006 and in 2010. Croplands and
non-forests have a stable interannual cycle, with the exception of 2002 and 2003, the years with the highest mean values
(Fig. 4). The main discrepancies between area burned and
radiative forcing occur in the period of 2005–2007, where
intermediate-high area burned values are associated with the
lowest values of radiative forcing in 2005 and 2007 and a
high abrupt peak in 2006.
www.biogeosciences.net/12/557/2015/
G. López-Saldaña et al.: Global analysis of radiative forcing
(a)
Mean%annual%
Radiative%forcing%
(Wm52)%
Africa%
4!
Forests!
2!
Croplands!
Non9Forests!
0!
2002!
Discussion and conclusions
We have presented a study to quantify the temporal evolution
of fire-induced albedo changes and the continental and global
annual mean forcing estimations. We used the radiative forcing here as a measure to quantify the influence in and contribution of fire to the Earth’s energy balance and showed that
fired caused a consistent decrease in the land surface shortwave albedo, leading to a positive radiative forcing.
5.1
Extreme events
Continental Europe includes Russian territories and has as
eastern borders the Ural Mountains, the Ural River and
the Caucasus Mountains, as well as the shore line of the
Caspian Sea. Therefore, the anomalous fire events in July
2010 around Moscow are included for the European continent. On an annual basis, in Russia, 90–95 % of burned
areas are located in the Asian part of Russia, with the majority (59.3 %) being forests, with the exception of the extreme event of 2010 (Shvidenko et al., 2011). The abrupt
www.biogeosciences.net/12/557/2015/
2004!
2005!
2006!
2007!
Mean%annual%
Radiative%forcing%
(Wm52)%
Mean%annual%
Radiative%forcing%
(Wm52)%
Mean%annual%
Radiative%forcing%
(Wm52)%
2010!
2011!
2012!
Forests!
5!
0!
Croplands!
Non9Forests!
2003!
2004!
2005!
(c)
2006!
2007!
2008!
2009!
2010!
2011!
2012!
N.%America%
15!
Forests!
10!
Croplands!
5!
0!
2002!
Non9Forests!
2003!
2004!
2005!
2006!
2007!
2008!
2009!
2010!
2011!
2012!
S.%America%
6!
Forests!
4!
Croplands!
2!
Non9Forests!
0!
2002!
2003!
2004!
2005!
2006!
2007!
(e)
Mean%annual%
Radiative%forcing%
(Wm52)%
2009!
Asia%
2002!
(d)
2008!
10!
2008!
2009!
2010!
2011!
2012!
Europe%
15!
Forests!
10!
Croplands!
5!
0!
2002!
Non9Forests!
2003!
2004!
2005!
(f)
2006!
2007!
2008!
2009!
2010!
2011!
2012!
Australia%
20!
Forests!
10!
0!
2002!
5
2003!
(b)
Mean%annual%
Radiative%forcing%
(Wm52%)%
The greatest drop in mean shortwave albedo change occurs in 2002, which corresponds to the highest total area
burned (3.78 Mha) observed in the same year and produces
the highest mean radiative forcing (4.5 Wm−2 ) (Fig. 2). The
lowest shortwave albedo change value in 2005 is not associated with low burned area values and similarly the lowest and
very abrupt drop of area burned in 2009 does not produce the
lowest albedo change and radiative forcing (Fig. 2).
Most fires occur in the Sahel (Fig. 5) and the Australian
savannas (Fig. 6), corresponding to an average of up to 89 %
of the total global area burned, whereas the highest radiative
forcing per unit area is located in the forests of Australia in
2003 and 2006, Europe in 2010 and Asia in 2002, with mean
continental values of 15.43, 15.26, 13.98 and 8.81 Wm−2 ,
respectively (Fig. 3). In croplands, Asia shows the greatest
oscillations, with a minimum of 2.11 Wm−2 in 2004 and a
maximum of 6.1 Wm−2 in 2008 (Fig. 3). The rest of the
continents show a low variability in cropland areas, with
the exception of Australia in 2003 showing a steep peak of
6.54 Wm−2 . In non-forests, the highest radiative forcing is
in North America in 2004, in Europe in 2007 and in Asia
in 2002 and 2010. High oscillations are also observed in
Australia, with an abrupt drop in 2010, contrasting with the
very stable interannual cycle of Africa. Figure 7 shows the
temporal evolution of burned area over northern Africa and
Australia, showing opposite behaviours. Whilst in northern
Africa the burned area tends to decrease and there is no significant trend in the associated radiative forcing, in Australia,
the burned area over the 11-year time period shows a positive
trend associated with a negative trend in the corresponding
radiative forcing; this suggests more areas affected by fire
but not necessarily associated with high burn severity.
561
Croplands!
Non9Forests!
2003!
2004!
2005!
2006!
2007!
2008!
2009!
2010!
2011!
2012!
Figure 3. The mean annual radiative forcing per land cover and
continent (a–f).
peak in 2010 in Fig. 3e corresponds to that event exactly,
with a mean annual value for forests in continental Europe
of 13.98 Wm−2 . The mean continental value is more realistic when compared to the massive maximum number of
167 Wm−2 for the same event, including aerosols in smoky
conditions, found in the literature (Chubarova et al., 2012).
Similar extreme events can be observed in Fig. 3f in 2003
and 2006 in Australia, depicting the eastern Victorian alpine
fires, which burned 1.3 Mha in 2003, and the Grampians fire
in Victoria in 2006 that burned 184 000 ha. A plausible explanation is that a weak to moderate El Niño event had a very
strong impact in Australia, causing the major 2002–2003
drought and rainfall deficiencies over the period March 2002
to January 2003 (Australian Government, 2014). Fires affected eastern New South Wales (NSW), Canberra, and the
mountainous areas of southeast NSW and forested areas in
eastern Victoria as show in Fig. 6. A radiative forcing above
Biogeosciences, 12, 557–565, 2015
!
562
Forests%
Mean%global%Radiative%forcing%(Wm52)%
(a)!
G. López-Saldaña et al.: Global analysis of radiative forcing
11!
9!
7!
5!
3!
1!
"1!
2001!
2004!
2005!
2006!
2007!
2008!
2009!
2010!
2011!
2012!
2013!
2009!
2010!
2011!
2012!
2013!
2009!
2010!
2011!
2012!
2013!
11!
9!
7!
5!
3!
1!
"1!
2001!
2002!
2003!
2004!
2005!
2006!
2007!
2008!
non5Forests%
Mean%global%Radiative%forcing%(Wm52)%
(c)
2003!
Croplands%
Mean%global%Radiative%forcing%(Wm52)%
(b)!
2002!
11!
9!
7!
5!
3!
1!
"1!
2001!
2002!
2003!
2004!
2005!
2006!
2007!
2008!
!
Figure 4. The mean annual radiative forcing per land cover (a–c) in
Wm−2 .
25 Wm−2 over northeast Victoria and the Great Dividing
Range in the Kosciuszko National Park in southern NSW,
mainly to a large shortwave albedo decrease due to forest
fires, is shown in Fig. 6. Broadly, forest has a low shortwave
albedo of ∼ 0.3 that varies with the viewing and illumination
conditions (Liang, 2000). Given the extraordinary circumstances during the 2002–2003 drought in Australia, the forest
fires dramatically altered the albedo, by a relative change of
up to 60 % in some areas (Fig. 6) during the Austral summer (pick of incoming radiation); nevertheless, changes due
to seasonality, e.g. vegetation senescence that affects surface
reflectivity, were not taken into account, and a contribution
of the decrease in albedo in the Australian summer might be
due to these non-fire-related changes.
In Fig. 3b, the highest value of radiative forcing occurs
in 2003, when the massive boreal fires in western Siberia
burned over 20 Mha and were some of the largest forest fires
on record (Sheng et al., 2004). Croplands and non-forests
follow the west Siberian event of 2003, showing the highest
mean radiative forcing value of all cropland areas (Fig. 3b).
Biogeosciences, 12, 557–565, 2015
Figure 5. The approximate day of burning; the “instantaneous”
shortwave albedo change in areas affected by fire; the relative
change in albedo in %; and the associated radiative forcing in
Wm−2 is shown for the Sahel during 2003.
In North America in 2004, the highest continental value
of mean annual radiative forcing occurs in non-forests
(9.89 Wm−2 ). The summer of 2004 was an extensive fire
season in Alaska and western Canada, with the majority of
the area burned being grasslands (including shrublands) and
forests (Turquety et al., 2007).
In South America, the 3-year intervals of increased radiative forcing might be associated with teleconnections causing extensive droughts, as in 2010 (Lewis et al., 2011), that
www.biogeosciences.net/12/557/2015/
G. López-Saldaña et al.: Global analysis of radiative forcing
563
Figure 6. The approximate day of burning; the “instantaneous” shortwave albedo change in areas affected by fire; the relative albedo change
in %; and the associated radiative forcing in Wm−2 is shown for Australia during 2003.
(a)
(b)
Figure 7. Temporal evolution of the radiative forcing and burned areas. Panel (a) shows the profiles for Africa, panel (b) for Australia.
www.biogeosciences.net/12/557/2015/
Biogeosciences, 12, 557–565, 2015
564
G. López-Saldaña et al.: Global analysis of radiative forcing
increase fire incidence in forests and savannas, but it may
also be associated with anthropogenic activities (Aragão and
Shimabukuro, 2010).
5.2
Concluding remarks
Changes in shortwave albedo are not the only source of radiative forcing when fires affect the land surface. According
to the Intergovernmental Panel on Climate Change (IPCC)
Fourth Assessment Report, biomass burning accounts for
75 % of the direct radiative forcing from organic aerosols,
and it is estimated at −0.5 ± 0.5 Wm−2 for the period of
1750–2005 (Forster et al., 2007). In the tropics, where incident solar radiation is larger than at higher latitudes, it can
enhance the radiative effect from aerosols (Holben et al.,
2001). Ross et al. (1998) found a radiative forcing of about
−15 ± 5 Wm−2 during the 1995 Amazon fire season. Total
black carbon emissions from biomass burning (3.3 TgC yr−1 )
represent 40 % of the total black carbon emissions, with an
additional 4.6 TgC yr−1 contributed by fossil fuel and biofuel combustion (Bond et al., 2004). Although the overall radiative forcing of smoke aerosol particles is negative,
black carbon can produce positive radiative forcing. The
global radiative forcing of total black carbon was estimated
at +0.2 Wm−2 in the IPCC Third Assessment Report (Ramaswamy et al., 2001) and 0.55 Wm−2 in the IPCC Fourth
Assessment Report (Forster et al., 2007).
A global mean radiative forcing estimation of
0.0275 Wm−2 quantifies the contribution of fire to the
Earth’s system, in which forest fires show the most dramatic
impact per area unit. Large extreme events can be detected
on an annual basis and show abrupt changes in shortwave
albedo and its associated radiative forcing. Although the
fire incidence in Africa is the highest, with little interannual
oscillations, the biggest changes in annual radiative forcing
are caused by the extreme fire events in Australia, Europe
and North America.
Anomalous fire events in continental Australia along with
the boreal forests drive the global annual extremes of mean
radiative forcing and show an excellent opportunity for future
research efforts in that field.
Acknowledgements. The research leading to these results has
received funding from the European Community’s Seventh
Framework Programme (FP7 2007–2013) under grant agreement
no. 238366. For all our colleagues at LDRAG, thank you for your
support. Duarte Oom: SMA&D&N. Haifa and Dominik, Gerannis
loves you.
Edited by: A. J. Dolman
Biogeosciences, 12, 557–565, 2015
References
Aragão, L. E. O. C. and Shimabukuro, Y. E.: The incidence of fire
in Amazonian forests with implications for REDD, Science, 328,
1275–1278, 2010.
Australian Government: http://www.bom.gov.au/climate/enso/
enlist/, last access: 30 April 2014.
Boisier, J. P., de Noblet-Ducoudré, N., and Ciais, P.: Inferring past
land use-induced changes in surface albedo from satellite observations: a useful tool to evaluate model simulations, Biogeosciences, 10, 1501–1516, doi:10.5194/bg-10-1501-2013, 2013.
Bond, T. C., Streets, D., Yarber, K. F., Nelson, S. M., Woo, J.H., and Klimont, Z.: A technology-based global inventory of
black and organic carbon emissions from combustion, J. Geophys. Res., 109, D14203, doi:10.1029/2003JD003697, 2004.
Bowman, D. M. J. S., Balch, J. K., Artaxo, P., Bond, W. J., Carlson,
J. M., Cochrane, M. A., D’Antonio, C. M., Defries, R. S., Doyle,
J. C., Harrison, S. P., Johnston, F. H., Keeley, J. E., Krawchuk,
M. A., Kull, C. A., Marston, J. B., Moritz, M. A., Prentice, I. C.,
Roos, C. I., Scott, A. C., Swetnam, T. W., van der Werf, G. R.,
and Pyne, S. J.: Fire in the Earth system, Science, 324, 481–484,
2009.
Chubarova, N., Nezval’, Y., Sviridenkov, I., Smirnov, A., and
Slutsker, I.: Smoke aerosol and its radiative effects during extreme fire event over Central Russia in summer 2010, Atmos.
Meas. Tech., 5, 557–568, doi:10.5194/amt-5-557-2012, 2012.
Chuvieco, E., Giglio, L., and Justice, C.: Global characterization of
fire activity: toward defining fire regimes from Earth observation
data, Glob. Chang. Biol., 14, 1488–1502, 2008.
Friedl, M. A., Sulla-Menashe, D., Tan, B., Schneider, A., Ramankutty, N., Sibley, A., and Huang, X.: MODIS Collection 5
global land cover: Algorithm refinements and characterization of
new datasets, Remote Sens. Environ., 114, 168–182, 2010.
Forster, P., Ramaswamy, V., Artaxo, P., Berntsen, T., Betts, R., Fahey, D. W., Haywood, J., Lean, J., Lowe, D. C., Myhre, G.,
Nganga, J., Prinn, R., Raga, G., Schulz, M., and Van Dorland,
R.: Changes in Atmospheric Constituents and in Radiative Forcing, in: Climate Change 2007: The Physical Science Basis. Contribution of Working Group I to the Fourth Assessment Report
of the Intergovernmental Panel on Climate Change, edited by:
Solomon, S., Qin, D., Manning, M., Chen, Z., Marquis, M., Averyt, K. B., Tignor, M., and Miller, H. L., Cambridge University
Press, Cambridge, United Kingdom and New York, NY, USA,
129–234, 2007.
Giglio, L., Loboda, T., Roy, D. P., Quayle, B., and Justice, C. O.: An
active-fire based burned area mapping algorithm for the MODIS
sensor, Remote Sens. Environ., 113, 408–420, 2009.
Govaerts, Y. M., Pereira, J. M., Pinty, B., and Mota, B.: Impact of
fires on surface albedo dynamics over the African continent, J.
Geophys. Res., 107, 4629, doi:10.1029/2002JD002388, 2002.
Gray, L. J., Beer, J., Geller, M., Haigh, J. D., Lockwood, M.,
Matthes, K., Cubasch, U., Fleitmann, D., Harrison, G., Hood,
L., Luterbacher, J., Meehl, G. A., Shindell, D., van Geel, B.,
and White, W.: Solar Influences on Climate, Rev. Geophys., 48,
RG4001, doi:10.1029/2009RG000282, 2010.
Holben, B. N., Smirnov, A., Eck, T. F., Slutsker, I., Abuhassan, N.,
Newcomb, W. W., Schafer, J. S., Tanre, D., Chatenet, B., and
Lavenu, F.: An emerging ground-based aerosol climatology –
Aerosol optical depth from AERONET, J. Geophys. Res., 106,
12067–12097, 2001.
www.biogeosciences.net/12/557/2015/
G. López-Saldaña et al.: Global analysis of radiative forcing
Jin, Y. and Roy, D. P.: Fire-induced albedo change and its radiative
forcing at the surface in northern Australia, Geophys. Res. Lett.,
32, L13401, doi:10.1029/2005GL022822, 2005.
Jin, Y., Randerson, J. T., Goetz, S. J., Beck, P. S. A., Loranty, M. M.,
and Goulden, M. L.: The influence of burn severity on postfire
vegetation recovery and albedo change during early succession in
North American boreal forests, J. Geophys. Res., 117, G01036,
doi:10.1029/2011JG001886, 2012a.
Jin, Y., Randerson, J. T., Goulden, M. L., and Goetz, S. J.: Postfire changes in net shortwave radiation along a latitudinal gradient in boreal North America, Geophys. Res. Lett., 39, L13403,
doi:10.1029/2012GL051790, 2012b.
Ju, J., Roy, D. P., Shuai, Y., and Schaaf, C.: Development of an approach for generation of temporally complete daily nadir MODIS
reflectance time series, Remote Sens. Environ., 114, 1–20, 2010.
Kalnay, E., Kanamitsu, M., Kistler, R., Collins, W., Deaven, D.,
Gandin, L., Iredell, M., Saha, S., White, G., Woollen, J., Zhu, Y.,
Leetmaa, A., Reynolds, R., Chelliah, M., Ebisuzaki, W., Higgins,
W., Janowiak, J., Mo, K. C., Ropelewski, C., Wang, J., Jenne, R.,
and Joseph, D.: The NCEP/NCAR 40-Year Reanalysis Project,
B. Am. Meteorol. Soc., 77, 437–471, 1996.
Lewis, S. L., Brando, P. M., Phillips, O.L., van der Heijden, G. M.
F., and Nepstad, D.: The 2010 Amazon drought, Science, 331,
554, doi:10.1126/science.1200807, 2011.
Liang, S.: Narrowband to broadband conversions of land surface
albedo I Algorithms, Remote Sens. Environ., 76, 213–238, 2001.
Lucht, W. and Lewis, P.: Theoretical noise sensitivity of BRDF and
albedo retrieval from the EOS-MODIS and MISR sensors with
respect to angular sampling, Int. J. Remote Sens., 21, 81–98,
2000.
Lucht, W., Schaaf, C. B., and Strahler, A. H.: An algorithm for the
retrieval of albedo from space using semiempirical BRDF models, IEEE Trans. Geosci. Remote Sens., 38, 977–998, 2000.
MCD64A1 burned area product: ftp://fuoco.geog.umd.edu/db/
MCD64A1/, last access: 24 April 2014.
NCEP/NCAR dswrf at the surface: ftp://ftp.cdc.noaa.gov/Datasets/
ncep.reanalysis.derived/surfacegauss/dswrf.sfc.mon.mean.nc,
last access: 24 April 2014.
Pereira, J. M.: A comparative evaluation of NOAA/AVHRR vegetation indexes for burned surface detection and mapping, IEEE
Trans. Geosci. Remote Sens., 37, 217–226, 1999.
Prentice, I. C., Baines, P. G., Scholze, M., and Wooster, M. J.: Fundamentals of climate change science, in: Understanding the Earth
System: Global Change Science for Application, edited by: CornellS. E., Prentice, I. C., House, J. I., and Downy, C. J., Cambridge University Press, 39–71, 2012.
www.biogeosciences.net/12/557/2015/
565
Ramaswamy, V., Boucher, O., Haigh, J. D., Hauglustaine, D., Haywood, J., Myhre, G., Nakajima, T., Shi, G. Y., and Solomon, S.:
Radiative Forcing of Climate Change, in: Climate Change 2001:
The Scientific Basis. Contribution of Working Group I to the
Third Assessment Report of the Intergovernmental Panel on Climate Change, edited by: Houghton, J. T., Ding, Y., Griggs, D.
J., Noguer, M., van der Linden, P. J., Dai, X., Maskell, K., and
Johnson, C. A., Cambridge University Press, Cambridge, UK and
New York, NY, USA, 349–416, 2001.
Schaaf, C. B., Gao, F., Strahler, A. H., Lucht, W., Li, X., Tsang,
T., Strugnell, N. C., Zhange, X., Jin, Y., Muller, J. P., Lewis, P.,
Barnsley, M., Hobson, P., Disney, M., Roberts, G., Dunderdale,
M., Doll, C., d’Entremont, R. P., Hu, B., Liang, S., Privett, J. L.,
and Roy, D.: First operational BRDF, albedo nadir reflectance
products from MODIS, Rem. Sens. Environ., 83, 135–148, 2002.
Sheng, Y., Smith, L. C., MacDonald, G. M., Kremenetski, K.
V., Frey, K. E., Velichko, A. A., Lee, M., Beilman, D. W.,
and Dubinin, P.: A high-resolution GIS-based inventory of the
west Siberian peat carbon pool, Global Biogeochem. Cy., 18,
GB3004, doi:10.1029/2003GB002190, 2004.
Shvidenko, A. Z., Shchepashchenko, D. G., Vaganov, E. A.,
Sukhinin, A. I., Maksyutov, S. S., McCallum, I., and Lakyda,
I. P.: Impact of wildfire in Russia between 1998–2010 on ecosystems and the global carbon budget, Dokl. Earth Sci., 441, 1678–
1682, 2011.
Stroppiana, D., Pinnock, S., Pereira, J. M., and Grégoire, J.-M.:
Radiometric analysis of SPOT-VEGETATION images for burnt
area detection in Northern Australia, Remote Sens. Environ., 82,
21–37, 2002.
Turquety, S., Logan, J. A., Jacob, D. J., Hudman, R. C., Leung, F.
Y., Heald, C. L., Yantosca, R. M., Wu, S., Emmons, L. K., Edwards, D. P., and Sachse, G. W.: Inventory of boreal fire emissions for North America in 2004: Importance of peat burning
and pyroconvective injection, J. Geophys. Res., 112, D12S03,
doi:10.1029/2006JD007281, 2007.
Van der Werf, G. R., Randerson, J. T., Giglio, L., Collatz, G. J., Mu,
M., Kasibhatla, P. S., Morton, D. C., DeFries, R. S., Jin, Y., and
van Leeuwen, T. T.: Global fire emissions and the contribution of
deforestation, savanna, forest, agricultural, and peat fires (1997–
2009), Atmos. Chem. Phys., 10, 11707–11735, doi:10.5194/acp10-11707-2010, 2010.
Biogeosciences, 12, 557–565, 2015
© Copyright 2026