
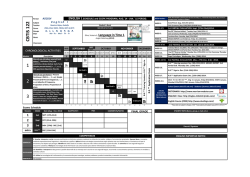
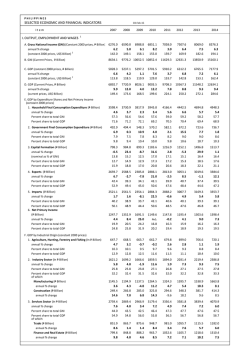
Table 0. SUMMARY OF INDICATORS Year-on-year percentage
Table 0. SUMMARY OF INDICATORS
Year-on-year percentage change except as indicated
Last Quarters
Activity
GDP volume (QNA)(2)(**)
- Domestic demand contribution (2)
- Net exports contribution (2)
Composite Activity Indicator (sca)
Large Firms Sales (3)
Economic Sentiment Indicator
Electric power consumption (4)
IPI calendar adjusted
Industrial Confidence Indicator (5)
Cement Apparent Consumption
Industry capacity utilization %
Domestic Demand
Consumer Goods. Apparent cons.(*)
Retail sales index (3)
Passenger car registrations (6)
Consumer confidence indicator (5)
Capital Goods. Apparent cons.(*)
Truck registrations (6)
Private Sector Financing (def.)
External Demand (Custom Basis)
Export of goods: Value.
Volume.
Import of goods: Value.
Volume.
Trade balance. Value(Million €) (7)
Labour Market
Labour force
Employment
Unemployment
- Unemployment rate % of lab.force
Registered unemployment
SS covered workers
Prices and Wages
CPI
Core CPI (8)
CPI differential eurozone (9)
Producer prices
Wages Collective bargaining (10)
Total labour cost per worker
Net borrowing (-) %GDP (11)
Monetary and Financial Sector (12)
Latest
data
2013
2014(1)
I.14
II.14
III.14
-2.1
-4.3
2.2
-1.6
-6.0
89.2
-2.2
-6.7
-17.5
-33.6
72.9
-1.2
-2.7
1.4
0.2
-2.9
93.2
-2.2
-1.5
-13.9
-20.7
72.5
1.2
1.9
-0.7
2.2
2.4
102.9
-0.2
1.4
-7.1
-0.3
75.9
0.7
1.2
-0.5
1.9
1.5
101.0
-0.3
1.5
-9.1
-3.2
75.6
1.3
2.2
-0.9
2.1
2.4
102.5
0.9
2.6
-8.2
-3.5
75.4
1.6
2.5
-0.9
2.4
2.2
103.7
0.3
0.7
-5.7
2.9
75.8
2.5
3.8
104.4
-1.7
0.4
-5.3
4.0
76.8
3.1
104.2
-1.1
0.9
-4.0
5.1
-
4.5
105.6
-2.5
-0.1
-5.8
2.7
-
Q.3. 14
Q.3. 14
Q.3. 14
Q.4. 14
Nov. 14
Dec. 14
Dec. 14
Nov. 14
Dec. 14
Nov. 14
Q.4. 14
-7.6
-7.2
-12.1
-31.7
-13.1
-24.2
-5.5
-1.8
-3.8
4.1
-25.3
-3.5
-0.4
-9.2
7.1
0.5
18.8
-8.9
7.5
26.1
-5.6
6.9
-0.1
12.0
-11.8
10.6
29.4
-6.2
9.7
0.7
23.6
-6.1
7.7
31.3
-5.7
4.8
0.3
13.5
-7.9
4.3
15.5
-5.1
7.6
1.5
24.9
-9.6
7.9
27.4
-5.0
4.1
0.7
23.3
-11.8
2.6
17.4
-5.2
7.6
2.3
23.2
-7.1
7.9
28.9
-4.8
Oct. 14
Nov. 14
Dec. 14
Dec. 14
Oct. 14
Dec. 14
Nov. 14
3.8
1.7
-2.8
-7.1
-2563
5.2
5.4
-1.3
3.1
-1330
2.1
3.0
6.2
8.8
-2109
3.2
3.0
7.0
12.7
-2818
-2.0
-1.1
3.7
4.0
-2155
4.8
6.2
7.3
9.7
-1827
4.1
6.6
7.7
9.9
-2240
9.6
8.1
7.5
11.5
-2374
4.1
6.6
7.7
9.9
-2240
Oct. 14
Oct. 14
Oct. 14
Oct. 14
Oct. 14
0.0
-4.3
15.9
24.8
10.9
-3.4
-1.1
-2.8
4.1
26.1
2.6
-3.3
-1.3
0.8
-7.0
24.7
-5.6
1.6
-1.8
-0.5
-5.5
25.9
-4.2
0.4
-1.0
1.1
-7.0
24.5
-6.4
1.5
-1.0
1.6
-8.7
23.7
-5.9
2.0
-5.8
2.3
-6.2
2.5
-5.4
2.6
Q.3. 14
Q.3. 14
Q.3. 14
Q.3. 14
Dec. 14
Dec. 14
2.4
1.6
-0.1
3.8
1.2
-0.6
1.4
1.4
0.1
0.6
0.5
0.2
-0.1
0.0
-0.6
-1.1
-0.3
0.0
0.1
-0.7
-2.2
0.6
-0.2
0.2
0.1
-0.4
-0.1
0.5
-0.1
-0.3
0.0
-0.8
-0.9
0.6
-0.4
-0.2
-0.1
-0.7
-1.3
0.6
-
-0.1
-0.1
-0.6
-1.2
0.6
-
-0.4
-0.1
-0.8
-1.5
0.6
-
Nov. 14
Nov. 14
Nov. 14
Nov. 14
Nov. 14
Q.3. 14
Public sector. State operations
September
-4.18
-4.32
-3.34
2013
-3.47
2014
-3.11
IV.14(1)
Previous
data
2012
October
2013
-3.48
2014
-2.90
2014
Dec.
0.05
0.08
0.33
1.78
114
1.23
3.66
Date
November
2013
-3.78
2014
-3.34
Sep.
Oct.
Nov.
25-Dec
1-Jan
8-Jan
Eurozone intervention rate (13)
0.75
0.25
0.05
0.05
0.05
0.05
0.05
0.05
0.05
3M Interbank rate.Euribor
0.57
0.22
0.21
0.10
0.08
0.08
0.01
0.08
0.07
1Y Interbank rate. Euribor
1.11
0.54
0.48
0.36
0.34
0.33
0.33
0.33
0.32
10Y Gov.Bond yield Spain
5.87
4.58
2.74
2.23
2.15
2.09
1.67
1.61
1.68
Differential Spain - Germany
430
295
150
123
128
130
108
107
117
Exchange rate ($/€)
1.29
1.33
1.33
1.29
1.27
1.25
1.22
1.21
1.18
Stock exchange Madrid IBEX-35 (14)
-4.62
21.42
3.66
9.16
5.66
8.61
5.70
0.00
-1.60
Memorandum Items
EE.UU Intervention rate.(13)
0.25
0.25
0.25
0.25
0.25
0.25
0.25
0.25
0.25
0.25
Brent oil Price $ per barrel
111.75
108.69
99.07
97.43
87.46
78.81
62.86
58.05
55.57
51.13
(1) Available period data. (2) Adjusted for seasonal and calendar effects; contributions in percentage points. (3) Calendar adjusted data (4) Adjusted for
calendar and temperature effects. (5) Balances in %.(sa). (6) DGT estimation. (7) Monthly average. (8) CPI excluding energy and unprocessed food.
(9) Difference between Spanish and Euro zone harmonized CPI. (10) Accumulated figure; annual data include the application of wage revision
clauses. (11) Accumulated data since January. (12) Period averages. (13) Level at the end of the period. (14) Percentage change accumulated since
the beginning of the year. (*) New methodology applied to the published data. (**)(ESA 2010 new base 2010).
Source: S. G. de Análisis Coyuntural y Previsiones Económicas. from different sources.
D. G. de Análisis Macroeconómico y Economía Internacional
S. G. de Análisis Coyuntural y Previsiones Económicas
09/01/2015
Graph 0. SUMMARY INDICATORS
6
GDP AND COMPONENTS (Adjusted Data)
y-o-y % change
DOMESTIC DEMAND: COMPONENTS (Adjusted Data)
y-o-y % change
17
0
0
-6
Domestic Demand (contrib.)
-17
Households Cons.Exp.
GDP
2009
10
GFCF Equip.and others
Net exports (contrib.)
-12
2010
2011
2012
2013
2014
INDUSTRY: PRODUCTION AND CONFIDENCE
y-o-y % change and balances
GFCF Construction
-34
2009
2010
2011
2012
2013
2014
ACTIVITY INDICATORS
y-o-y % change
10
110
0
90
0
-10
-20
70
-10
Large Firms Sales (left)
-30
Elect.Power Con (left)
ICl
-40
2009
30
Econ.Sent.I.(right)
IPI calendar adjusted
2010
2011
2012
50
-20
2013
2014
IMPORTS AND EXPORTS. CUSTOMS
y-o-y % change (volume)
2009
2010
2011
2012
2013
2014
CONSUMER GOODS. APPARENT CONSUMPTION
y-o-y % change
20
15
0
0
-20
Consumer goods (adjusted)
-15
Imports
Capital goods (adjusted)
Exports
-40
-30
2009
2010
2011
2012
2013
2014
2009
EMPLOYMENT (y-o-y % change)
4
4
2010
2011
2012
2013
2014
CONSUMER PRICES (y-o-y % change)
Employment LFS
Social Security covered workers
3
0
1
-4
-1
CPI
Core inflation
-2
-8
2009
2010
2011
2012
2013
D. G. de Análisis Macroeconómico y Economía Internacional
S. G. de Análisis Coyuntural y Previsiones Económicas
2014
2009
2010
2011
2012
2013
2014
09/01/2015


© Copyright 2026