
ISOTOPICALLY-EXTREME INCLUSIONS AND ISOTOPIC
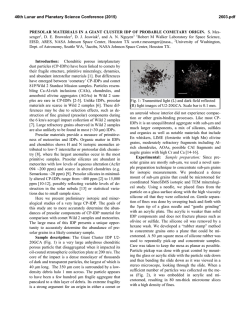
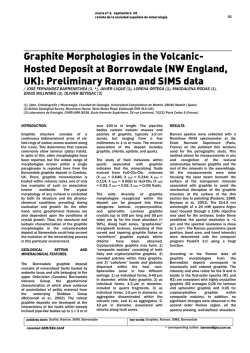
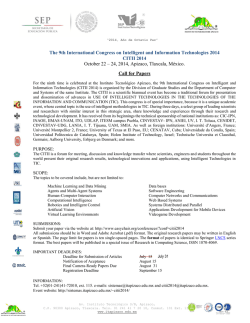
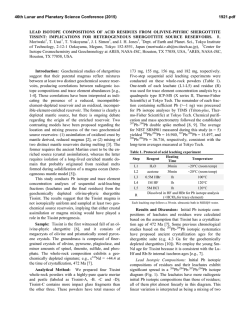
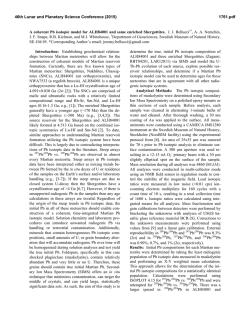
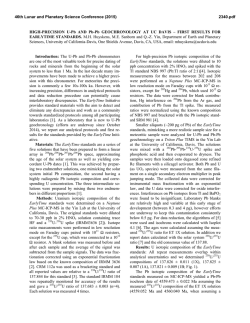
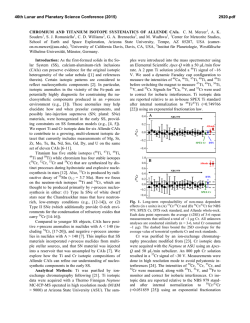
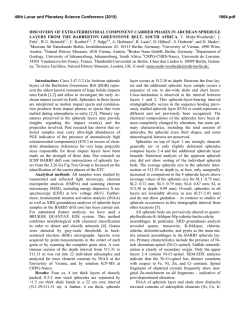
46th Lunar and Planetary Science Conference (2015)
2489.pdf
ISOTOPICALLY-EXTREME INCLUSIONS AND ISOTOPIC HETEROGENEITY IN SUPERNOVA
GRAPHITIC SPHERULES. T. K. Croat and F. Gyngard, Laboratory for Space Sciences and Department of Physics, Washington University, St. Louis, MO 63130, USA, [email protected].
Introduction: Isotopic measurements of refractory
grains captured within graphitic spherules often exhibit
extreme anomalies, which in some cases lead to a different understanding of the stellar origin of the assemblage (e.g., the presence of type-C SiC grains of massive star origin in high-density graphites [1]).
NanoSIMS imaging measurements also show isotopic
heterogeneities, as a function of both spatial distribution and depth, which can reveal complex condensation
histories of supernova (SN) graphite spherules [2].
However, the interpretation of data from SN assemblages is complicated by isotopic dilution/exchange
and by their multiphase nature -each spherule can contain hundreds of small refractory grains. Here we present NanoSIMS data from cross-sections of SN graphite spherules, and examine the isotopic heterogeneity of
both the host graphites and their internal refractory
grains.
Experimental: Graphitic spherules from the Murchison KE3 (1.65-1.72 g cm-3, >2 µm [3]) and Orgueil
OR1d (1.75-1.92 g cm-3, >1 µm [4]) density and size
separates were selected for ultramicrotomy based on
NanoSIMS bulk measurements indicative of a SN
origin. The ultramicrotomed graphite cross-sections
were studied in the TEM, primarily using imaging,
EDXS, and electron diffraction. Selected graphite
cross-sections were then measured in NanoSIMS imaging mode for various species of interest, including 12C,13C-,16O-, 17O-, 18O-, 12C14N-, 12C15N-, 28Si-, 29Si-, and
30 Si . The NanoSIMS standards used include finegrained Murchison matrix, synthetic SiC, and carboncoated TEM grids, and the reported 2σ errors include
reproducibility variations in the standards. In a few
cases, graphite cross-sections that happened to fall on
TEM gridbars were measured, and here the TiC locations are apparent based on the high initial 16O- yield
from TiCs [5].
Results: Internal TiC grains from SN graphites often show significant 15N and 18O enrichments, typically
larger than the host graphite (Fig. 1). Even without
prior knowledge of their locations, the TiCs are apparent in the earlier layers of 16O images, due to differences in initial secondary ion yields (Fig.1). The TiCs
in Fig. 1 are 130 and 80 nm in diameter, although they
appear ~50% larger in NanoSIMS images due to lower
spatial resolution in the ion probe compared to the
TEM. The average sizes of TiCs vary among different
SN graphites, but these range from 30-250 nm [6].
Only the smallest TiC (<50 nm) are difficult to detect
Fig. 1. TEM image of a KE3e15 SN graphite crosssection containing two TiC grains with corresponding
16
O image and ratio images of 18O/16O and 15N/14N
showing hotspots at the same TiC locations. The TiCs
have significantly larger 18O and 15N enrichments than
their graphite host (see inset data table with 2σ errors).
Fig. 2. 12C/13C vs. 16O/18O plots of TiC inclusions
(open symbols of various sizes) and their graphite host
(closed symbols and range indicated by ellipses) from
nine SN graphite spherules. The TiC symbols share
the same color as their graphite host and are scaled to
reflect the sizes of each TiC inclusion measured.
and measure; here ion counts from the surrounding ~70
nm thick graphite cross-section begin to obscure any
isotopic differences between the TiCs and the host
graphite. Fig. 2 shows 12C/13C and 16O/18O ratios from
46th Lunar and Planetary Science Conference (2015)
nine different OR1d and KE3 SN graphite crosssections along with measurements from their TiC inclusions (each TiC is plotted in same color as its host).
The TiC plot symbols are scaled relative to the TiC’s
size, and measurements of the smaller subgrains are
more greatly affected by contributions from surrounding graphite (i.e., pulled towards host graphite isotopic
range). Graphitic carbon regions are isotopically heterogeneous and the ellipses in Fig. 1 show the isotopic
range of TiC-free areas. In most cases, the TiCs are
clearly more 18O enriched than their graphite host, but
are similar in 12C/13C (irrespective of TiC size). Only
the smallest single TiC grains, such as those in
graphites e11 and e3 (Fig. 2) are isotopically indistinguishable from graphite. However, even in those cases, the aggregate isotopic anomalies from TiCs (i.e.,
computed by combining counts from ~10 TiCs) exceeds those of their host graphite.
Fig. 3 shows the 12C/13C and 16O/18O ratios as a
function of radial distance from the graphite’s center
from various representative SN spherules (with the
innermost to outermost shells computed separately).
The 16O/18O ratios typically show radial isotopic zoning, with the innermost region being most anomalous
and the outermost shell showing closer to solar ratios.
The 12C/13C ratios sometimes show similar isotopic
zoning patterns, but are generally much less affected.
No features such as the 18O-enriched shell in [2] were
seen, but other radial trends are often seen that indicate
changing condensation condition in the gas (e.g., in
chemical composition and/or number of TiCs captured
[6]). We also find some evidence for isotopic hetero-
Fig. 3. 12C/13C and 16O/18O isotopic zoning profiles
from various TiC-free cross-sections taken near each
spherule’s center. The inner region gives the spherule’s core composition and the remaining three data
points are from concentric shells further outward.
2489.pdf
geneity among TiCs from the same graphitic spherule
(e.g., e10 in Fig. 2).
Discussion: The SN TiCs have significant N distributed throughout the grains (up to 10 at. %) and have
O concentrated at their surfaces [7], and so are more
accurately described as Ti-carbonitriles. The large 15N
and 18O anomalies in TiCs are both consistent with
formation in regions dominated by material from the
He/C SN zone [2], rather than having an origin from
deep within the SN [8]. Ca-Ti isotopic measurements
(looking for 44Ca or 49Ti excesses) are being pursued to
further constrain their origins.
The isotopic differences between TiCs and their
host graphite raise the possibility that they have condensed from different environments. A more likely
explanation, though, is that the graphitic carbon is
more greatly affected by isotopic dilution and exchange
of minor elements (e.g., N and O) than TiC, as suggested by the isotopic zoning patterns (Fig. 3). Such
isotopic exchange occurs to an even greater degree in
high-density graphites, which often retain only the C
anomalies that are embedded into the graphene sheets
that comprise their structures, but lose N and O that is
more loosely bound at the edges of these sheets [1].
The anomalous N and O species appear to be better
retained by the Ti-carbonitrile phase. Further, some
evidence for the co-formation of TiCs and their host
graphites in the same environment is apparent in their
microstructures. For example, in some cases the TiC
grains captured in a graphitic spherule are larger at
greater radial distance from the graphite’s center,
which suggests continued TiC growth in the same environment where the spherules are growing [6].
The isotopic heterogeneity within graphitic
spherules and the presence of more isotopically anomalous inclusions illustrate the difficulties in characterizing these multiphase assemblages. Here, measurements from ultramicrotomed cross-sections have a
clear advantage over bulk measurements. Along with
providing samples for TEM analyses, the crosssections also allow a less ambiguous determination of
the isotopic composition of the spherule’s core, which
more closely reflects its original true composition.
Acknowledgments: We thank S. Amari, M.
Jadhav, and E. Groopman for assistance in preparation
and characterization of the Murchison and Orgueil lowdensity graphite samples.
References: [1] Croat T.K. et al. (2010), AJ, 139,
2159. [2] Groopman E. et al. (2014) ApJ, 790: 9. [3]
Amari S. et al. (2014) GCA, 133, 479. [4] Jadhav M. et
al. (2013) GCA, 133, 193. [5] Stadermann F.J. et al.
(2005) GCA, 69, 177. [6] Croat T.K. et al. (2003),
GCA, 67, 4705. [7] Daulton T.L. et al. (2012) LPSC
53, # 2247. [8] Lodders K. ApJ, 647, L37.


© Copyright 2026