
2173
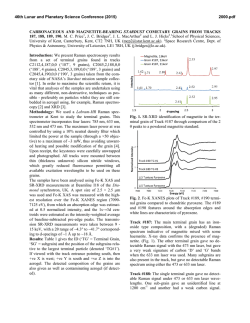
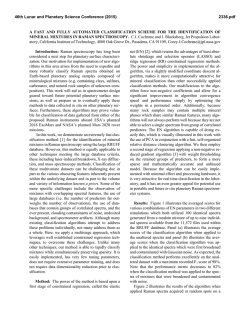
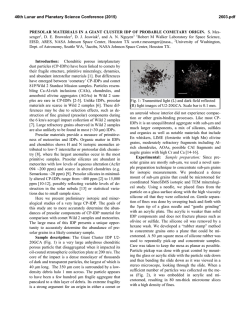
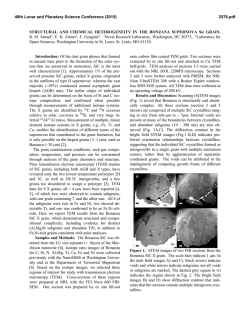
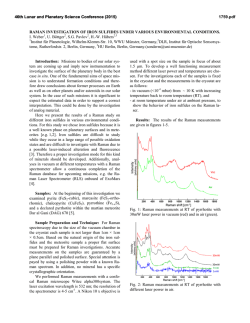
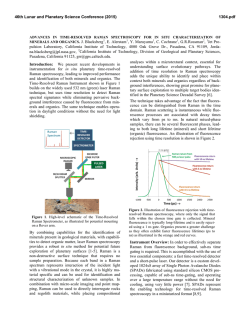
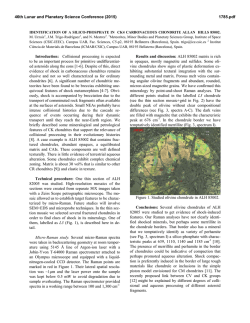
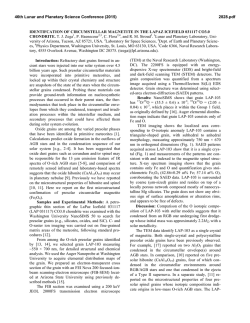
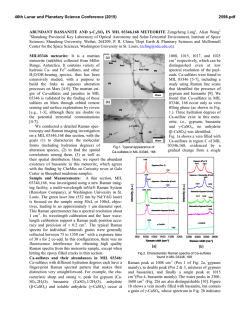
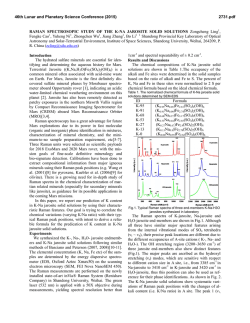
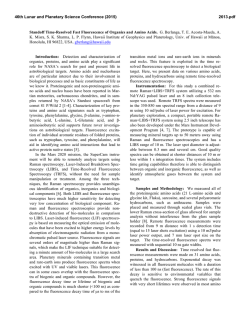
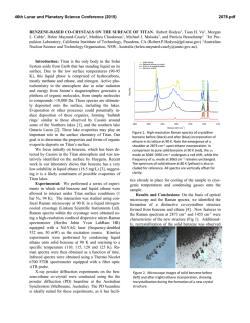
46th Lunar and Planetary Science Conference (2015)
2173.pdf
CORRELATION BETWEEN RAMAN PEAK SHIFTS AND ISOTOPIC COMPOSITIONS OF SUBMICRON PRESOLAR SIC GRAINS. N. Liu1, A. Steele2, L. R. Nittler1 and C. M. O’D. Alexander1 1Department
of Terrestrial Magnetism, Carnegie Institution of Washington, Washington, DC 20015, USA (Email:
[email protected]); 2Geophysical Laboratory, Carnegie Institution of Washington, Washington, DC 20015,
USA.
Introduction: Silicon carbide is a particularly interesting phase because more than a hundred different
polytypes can be formed in the laboratory. The formation of these polytypes depends strongly on growth
conditions (e.g., temperature, pressure). Daulton et al.
[1] used TEM to study the microstructures of ~500
presolar SiC grains in an acid residue of the Murchison
meteorite (KJB fraction of [2], mean diameter of 0.49
µm). They found that cubic SiC (β-SiC) is the dominant polytype for presolar SiCs (~80%). Previous Raman studies of large SiC grains (>3 µm) showed that
Raman spectra can be diagnostic for distinguishing
between non-cubic (hexagonal or rhombohedral, αSiC) and cubic SiC structures [3,4]. However, the
grains in the previous Raman studies were of unusually
large size and it is therefore of interest to study the SiC
microstructural distributions in smaller, more typical
size fractions with Raman microscopy. Furthermore,
Ivanov et al. [5] showed that the Raman peak positions
of synthetic isotope-enriched SiCs are shifted with
respect to those of the same polytype but with normal
isotope ratios. It is therefore intriguing to investigate
whether Raman peak positions correlate with the corresponding C and Si isotope ratios in presolar SiCs,
which could potentially provide a new, nondestructive, method to find rare type SiC grains with
extremely anomalous C and/or Si isotope ratios (e.g.,
highly 13C-enriched A+B grains [6]).
Samples and Methods: The SiC grains in this
study were extracted from the Murchison meteorite
using the isolation method described in [7] and dispersed on a high purity Au mount. Raman spectra were
acquired first with a WiTeC multi-function scanning
probe microscope, which includes near-field optical
microscopy and confocal imaging Raman microscopy
(532 nm frequency-doubled Nd:YAG laser). Its typical
spatial resolution is ~400 nm at low power. Spectral
images were obtained in four areas on the presolar SiC
mount (each area ~50×50 µm), where each pixel contains a full Raman spectrum (~0.1Δcm-1 spectral resolution). After Raman measurements, we further verified the chemical compositions of Raman-identified
SiC grains by EDS analysis with a JEOL 6500F fieldemission SEM. High-resolution Raman spectra were
then acquired on single SiC grains for comparison with
previous Raman scanning spectra to see if SiC Raman
peaks are shifted due to the electron beam damage.
Finally, the C, N and Si isotopic compositions of these
SiC grains were simultaneously measured with the
Carnegie NanoSIMS 50L ion microprobe using a Cs+
beam and standard methods.
Results: We performed Raman and isotopic measurements on 30 presolar SiC grains. The grain sizes
range from 0.2 to 2.2 µm (mean ~0.8 µm), which is
similar to the size distribution of the KJD fraction of [2]
(mean 0.81 µm). We succeeded in obtaining correlated
data for 13 mainstream SiC grains. The C, N and Si
isotopic compositions of the 30 presolar SiC grains are
in good agreement with the literature data [8]. We did
not see any evidence of peak shifts due to electron
beam damage arising from the EDS analysis. Two of
the 13 grains are hexagonal and the remainder are all
cubic. This is consistent with the SiC microstructural
distribution found in [1]. All the Raman and isotopic
data are summarized in Table 1.
Figure 1 shows high-resolution Raman spectra of
one 6H- and one 3C-SiC standard, and two presolar
grains. The β-SiC (e.g., 3C) has two first-order Raman
active phonon modes, a TO mode at 796 cm−1 and an
LO mode at 972 cm−1. The LO mode is absent in the
3C-SiC STD spectrum, probably due to the crystal
orientation. In contrast, the TO mode of the α-SiC (e.g.,
4H, 6H) splits into several modes. For instance, in Figure 1, the 6H-SiC standard has two TO modes at 764
and 785 cm−1 [9]. Thus, different SiC polytypes can be
easily distinguished based on their Raman spectra.
A1-3
A1-6
785 (TO)
963 (LO)
764 (TO)
6H-SiC STD
796 (TO)
3C-SiC STD
Raman Peak Shift (cm-1)
Figure 1. Raman spectra of standards (bottom two
traces) and presolar SiC grains (top two traces).
46th Lunar and Planetary Science Conference (2015)
2173.pdf
Table 1. Raman TO peak shifts and isotopic compositions of C, N and Si (1σ errors) for presolar SiC grains
Grain
A1_1
A1_2
A1_3
A1_4
A1_5
A1_6
A1_7
A2_1
A2_3
A2_4
A3_2
A4_2
A4_3
Size
(µm)
1.0
0.2
1.4
0.8
0.5
0.6
0.9
0.9
0.6
0.5
1.2
2.2
1.0
TO Peak
(cm-1)
776, 795
796
793
793
792
766,782
789
780
781
785
787
790
789
Type
4H
3C
3C
3C
3C
6H
3C
3C
3C
3C
3C
3C
3C
12
C/13C
46±2
108±5
54±2
93±2
73±2
60±2
62±2
26.4±0.1
15.8±0.1
63.1±0.5
53±2
64±2.1
58±2
12
13
C/ C
mainstream 3C-SiC
linear fitting line
95% confidence band
-1
Raman TO Peak Shift (cm )
Figure 2. Plot of 12C/13C ratios versus Raman TO phonon peak shifts in 11 mainstream 3C-SiCs.
Discussion: Table 1 shows that the 796 cm-1 TO
phonon peak is shifted to varying degrees in the 11 3CSiC grains. The Raman peak position is sensitive to
polytype variety, disorder, stress and density of charge
carriers. As C and Si are the major components of the
mineral SiC, rare isotopes (13C, 29Si, 30Si) may be considered as isomorphic impurities to cause possible peak
shifts. Ivanov et al. [5] recently reported shifts of up to
20 cm-1 in Raman peak positions for 13C-enriched 4HSiC samples (12C/13C=1). Thus, we compared the TO
peak shifts of the 11 3C-SiCs with their corresponding
12 13
C/ C ratios in Figure 2. Clearly, there exists a positive correlation between the 12C/13C ratio and the Raman TO peak shift, with eight of the 11 grains (~70%)
falling within the 95% confidence bands for the fitting
line. This indicates that the Raman peak shift of main-
14
N/15N
δ(29Si/28Si) δ(30Si/28Si)
(‰)
(‰)
2673±447
-33±11
-21±13
1827±457
238±133
64±146
1684±148
86±3
93±4
913±119
9±25
-2.1±30
1344±56
42±9
66±10
2588±199
9.3±14
8.0±16
674±25
23±10
13±12
586±14
52±7
42±8
717±21
1±13
23±16
1579±100
52±8
35±9
1408±100
119±8
72±9
460±9
47±4
28±4
423±8
21±4
12±5
stream SiC grains is mainly caused by the isotope effect. However, the peak shifts of two grains with
12 13
C/ C ratios of ~60 do not follow the linear correlation. Their Raman shifts, therefore, could be dominantly caused by other effects, e.g., crystal impurities (varying trace element abundances).
No correlation is observed between the peak shift
and the N or Si isotopic compositions because (1) N is
present in presolar SiCs as a trace element, and (2) the
Si isotope ratios in mainstream SiC grains are within
±200‰, which is two orders of magnitude lower than
the corresponding C isotope variation. Therefore, in
most cases, Raman peak shifts appear to be dominated
by the C isotope variations in mainstream SiC grains.
Conclusion: This work demonstrates a clear correlation between Raman spectra and C-isotopic composition for sub-µm to µm-sized presolar SiC grains, indicating that Raman microscopy should be useful for
searching for rare types of grains. Raman microscopy
is relatively easy and less time-consuming than NanoSIMS analysis and since it is non-destructive, it can
also preserve grains for destructive analysis with other
instruments (e.g., heavy element isotope measurements
by CHILI [10]) to better understand their stellar origins. Additional correlated measurements will be done
to better characterize the relationship between isotopic
composition and Raman spectra of presolar SiC.
References: [1] Daulton T. L. (2003) GCA, 67,
4743–4767. [2] Amari et al. (1994) GCA 58, 459-470.
[3] Virag A. et al. (1992) GCA, 56, 1715-1733.
[4] Wopenka B. (2010) LPS XLI, Abstract#1390. [5]
Ivanov et al. (2014) Mater. Sci. Forum 778-780, 471474. [6] Amari et al. (2001) ApJ 559, 463-483. [7] Alexander C. M. O’D. & Nittler (1999) ApJ 519, 222-235.
[8] Zinner (2014) Treatise on Geochemistry 1, 181-213.
[9] Zhang et al. (1992) J. Appl. Phys. 72, 4469-4471.
[10] Stephan et al. (2014) LPS XLV, Abstract#2242.
© Copyright 2026