
Raman Spectroscopic Study of the K
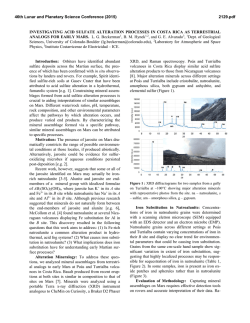
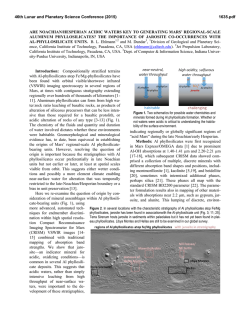
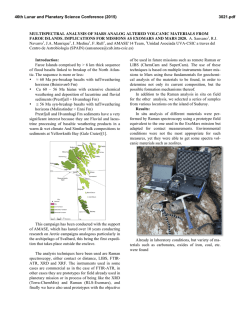
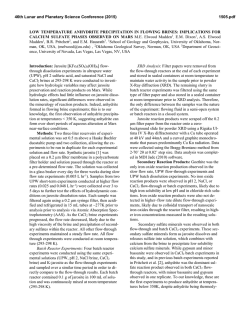
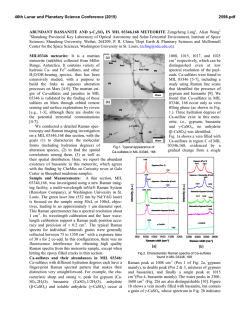
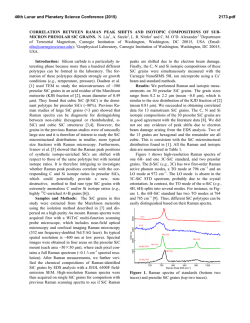
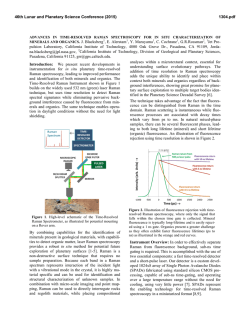
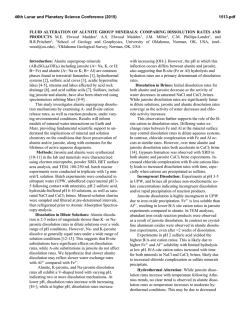
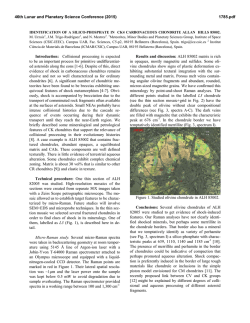
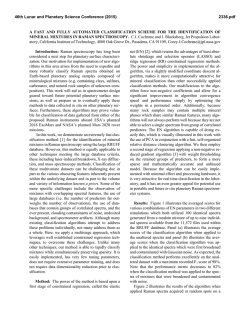
46th Lunar and Planetary Science Conference (2015)
2731.pdf
RAMAN SPECTROSOPIC STUDY OF THE K-NA JAROSITE SOLID SOLUTIONS Zongcheng Ling1,
Fengke Cao1, Yuheng Ni1, Zhongchen Wu1, Jiang Zhang1, Bo Li1 1 Shandong Provincial Key Laboratory of Optical
Astronomy and Solar-Terrestrial Environment, Institute of Space Sciences, Shandong University, Weihai, 264209, P.
R. China ([email protected])
Introduction
The hydrated sulfate minerals are essential for identifying and determining the aqueous history for Mars.
Terrestrial Jarosite ((K,Na,H3O)Fe3(SO4)2(OH)6) is a
common mineral often associated with acid-mine waste
on Earth. For Mars, Jarosite is the first definitely discovered sulfate mineral phases by Mossbauer spectrometer aboard Opportunity rover [1], indicating an acidic
water-limited chemical weathering environment on this
planet [2]. Jarosite has also been remotely detected as
patchy exposures in the northern Mawrth Vallis region
by Compact Reconnaissance Imaging Spectrometer for
Mars (CRISM) aboard Mars Reconnaissance Orbiter
(MRO)[3,4].
Raman spectroscopy has a great advantage for future
Mars explorations due to its power in fast molecular
(organic and inorganic) phase identification in mixtures,
characterization of mineral chemistry, and the minimum-to-no sample preparation requirement, etc[5-7].
Three Raman units were selected as scientific payloads
for 2018 ExoMars and 2020 Mars rover, with the mission goals of fine-scale definitive mineralogy and
bio-signature detection. Calibrations have been done to
extract compositional information from major igneous
minerals using their Raman peak positions (e.g. Wang et
al. (2001)[8] for pyroxene, Kuebler et al. (2006)[9] for
olivine). There is a growing need for in-depth study of
Raman spectra in the chemical characterization of martian related minerals (especially for secondary minerals
like jarosite), as guidance for its possible applications in
the coming Mars missions.
In this paper, we report our prediction of K content
in K-Na jarosite solid solutions by using their characteristic Raman features. Our goal is trying to correlate the
chemical variations (varying K/Na ratio) with their typical Raman peak positions, with intent to derive a reliable formula for the predication of K content in K-Na
jarosite solid solutions.
Experiments
We synthesized the K-, Na-, H3O- jarosite endmembers and K-Na jarosite solid solutions following similar
methods of Basciano and Peterson (2007, 2008)[10-11].
The elemental concentration (K, Na, Fe etc) of the samples are determined by the energy dispersive spectrometer (EDS, Oxford Aztec Xmax50) on the scanning
electron microscopy (SEM, FEI Nova NanoSEM 450).
The Raman measurements are performed on the newly
installed state-of-art inVia® Raman System (Renishaw
Company) in Shandong University, Weihai. The green
laser (532 nm) is applied with a 50X objective during
measurements, yielding spectral resolution better than
1cm-1 and spectral repeatability of ± 0.2 cm-1.
Results and Discussions
The chemical compositions of K-Na jarosite solid
solutions are shown in Table 1.The occupancy of the
alkali and Fe sites were determined in the solid samples
based on the ratio of alkali and Fe to S. The percent of
K, Na and Fe in these sites were normalized to 2 S per
chemical formula based on the ideal chemical formula.
Table 1. The normalized chemical formula of K-Na jarosite solid
solutions determined by SEM-EDS
ID
K-95
K-91
K-68
K-53
K-27
K-13
K-0
Formula
(K0.95Na0.05)Fe2.81(SO4)2(OH)6
(K0.91Na0.09)Fe2.74(SO4)2(OH)6
(K0.68Na0.27)Fe3.17(SO4)2(OH)6
(K0.53Na0.44)Fe2.85(SO4)2(OH)6
(K0.27Na0.67)Fe2.9(SO4)2(OH)6
(K0.13Na0.8)Fe2.78(SO4)2(OH)6
(K0.00Na0.95)Fe2.82(SO4)2(OH)6
Fig.1. Typical Raman spectra of three end-members K-Na-H3O
jarosites synthesized in laboratory
The Raman spectra of K-jarosite, Na-jarosite and
H3O-jarsoite end-members are shown in Fig.1. Although
all three have similar major spectral features arising
from the internal vibrational modes of SO4 tetrahedra
(ν1 ~ v4), their precise peak locations are different due to
the different occupancies of A-site cations ( K-, Na- and
H3O-). The OH stretching region (3200~3650 cm-1) of
three jarosite end-members also show distinct features
(Fig.1). The major peaks are ascribed as the hydroxyl
stretching (νs) modes, which are sensitive with respect
to different cation size in A site, i.e., from 3385 cm-1 in
Na-jarosite to 3410 cm-1 in K-jarosite and 3420 cm-1 in
H3O-jarsoite, thus this position can also be used as reference for their phase identifications. As shown in Fig. 2.
The K-Na jarosite solid solutions show systematic variations of Raman peak positions with the changes of alkali content (i.e. K/Na ratio) in A site. The peak 1 (ν1,
46th Lunar and Planetary Science Conference (2015)
~1010cm-1), Peak 2(ν3, ~1110cm-1) and Peak 3 (ν2,
~440cm-1) have the largest variations due to the varying
K/Na ratio, i.e., Peak 1 (∆=5cm-1 from 1006 to
1011cm-1), Peak 2 (∆=11cm-1 from 1100 to 1111cm-1)
and Peak 3 (∆=10cm-1 from 434 to 444 cm-1).
2731.pdf
tionship between each other (with Pearson's correlation
coefficients > 0.99). This indicates they are good candidate parameters for the evaluation of chemical variations of K-Na jarosite solid solutions. Based on multiple
linear regression of these parameters, we can derive the
calculation formula as follows,
K − content = 9.37 × Peak1 − 0.32 × Peak 2 − 13.32 × Peak 3 − 3195
(1)
Where the K-number is the molar ratio
K/(K+Na)×100 of K-Na jarosite solid solutions, Peak1
(~1010cm-1), Peak2 (~1110cm-1) and Peak3 (~440 cm-1)
are Raman peak positions of K-Na jarosite solid solutions in the unit of Raman shift (cm-1). As shown in Fig.
4, the data points of measured and predicted K-number
of K-Na jarosite solid solutions distribute equally along
the 1:1 line, suggesting a good model of K-number has
been achieved. The standard deviation between measured and predicted K-number is ±4. This formula can be
used as the first principle for the prediction of K contents in K-Na jarosite solid solution series.
Fig. 2. Raman spectra of K-Na jarosite solid solutions
Fig. 4. The scatter plot of measured K-number versus predicted
K-number by using equation 1.
Fig. 3. The 3D scatter plot of peak 1, peak 2 and peak 3 for K-Na
jarosite solid solutions.
The precise peak positions of Peak 1, Peak 2 and
Peak 3 were obtained by spectral deconvolution using
the Renishaw WiRE 3.4 software package with a mixed
Gaussian–Lorentzian algorithm. As shown in the 3D
scatter plot for K-Na jarosite solid solutions (Fig. 3), the
Peak 1, Peak 2 and Peak 3 have very good linear rela-
Conclusions and Future work
We have synthesized the endmember K-jarosite,
Na-jarosite and H3O-jarosite and the K-Na jarosite solid
solutions in laboratory. The Raman peak positions of
Na-K jarosites show systematic variations in concert
with the K-content for the solid solutions. We derived a
formula applicable for the prediction of K content in
jarosite, which is meaningful for the future Raman
payloads of Mar's missions. Future work will focus on
the refinement of the K-number formula and we will
extend our calibration work to the ternary K-Na-H3O
jarosite solid solutions.
Acknowledgements: This work was supported by the
National Natural Science Foundation of China
(41473065, 41373068, U1231103).
References: [1] Klingelhöfer G. et al. (2004) Science, 306, 1740.
[2] Madden M. E. et al. (2004) Nature, 431, 821-823. [3] Farrand W.H.
et al. (2009) Icarus, 204, 478-488. [4] Michalski J.R. et al. (2013)
Icarus, 226, 816-840. [5] Wang A. et al. (2003) JGR, 108(E1), 5005.
[6] Sharma S.K. et al. (2003) Spectrochim. Acta Part A, 59(10),
2391-2407. [7] Rull F. et al. (2014) GeoRaman, 11th, 5056. [8] Wang
A. et al. (2001) Am. Miner., 86,790-806. [9] Kuebler K.E. et al. (2006)
GCA, 70(24), 6201-6222. [10] Basciano L.C. and Peterson R.C. (2007)
Am. Miner., 92, 1464-1473. [11] Basciano L.C. and Peterson R.C.
(2008) Am. Miner., 93, 853-862.
© Copyright 2026