
Carbonaceous and Magnetite-Bearing Stardust Cometary Grains
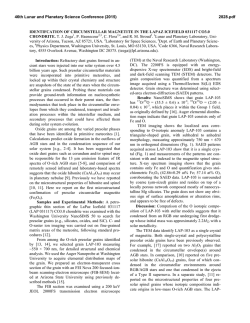
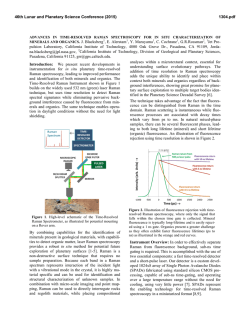
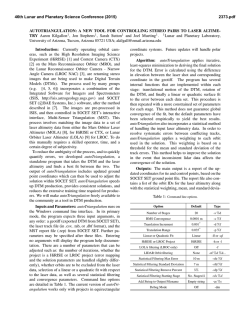
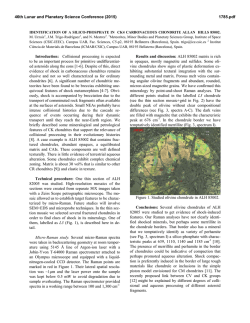
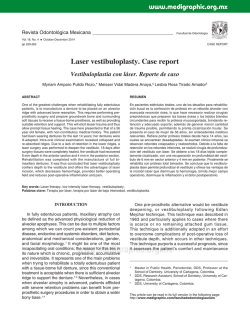
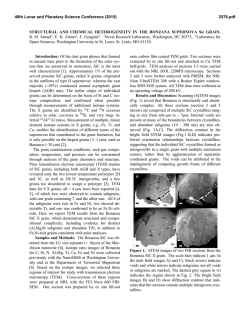
46th Lunar and Planetary Science Conference (2015)
2000.pdf
CARBONACEOUS AND MAGNETITE-BEARING STARDUST COMETARY GRAINS FROM TRACKS
187, 188, 189, 190. M. C. Price1, J. C. Bridges2, J. L. MacArthur2 and L. J. Hicks2.1School of Physical Sciences,
University of Kent, Canterbury, Kent, CT2 7NH, UK ([email protected]). 2Space Research Centre, Dept. of
Physics & Astronomy, University of Leicester, LE1 7RH, UK ([email protected]).
Introduction: We present Raman spectroscopy results
from a set of terminal grains found in tracks
C2112,4,187,0,0 (‘187’, 9 grains), C2045,2,188,0,0
(‘188’, 4 grains), C2045,3,189,0,0 (‘189’, 3 grains) and
C2045,4,190,0,0 (‘190’, 3 grains) taken from the cometary side of NASA’s Stardust mission sample collector [1]. In order to maximise the scientific return, it is
vital that analyses of the samples are undertaken using
as many different, non-destructive, techniques as possible - preferably on particles whilst they are still embedded in aerogel using, for example, Raman spectroscopy [2] and XRD [3].
Methodology: We used a Labram-HR Raman spectrometer at Kent to study the terminal grains. This
spectrometer incorporates four lasers: 785 nm, 633 nm,
532 nm and 473 nm. The maximum laser power at was
controlled by using a 10% neutral density filter which
limited the power at the sample (through a ×50 objective) to a maximum of ~3 mW, thus avoiding unwanted heating and possible modification of the grain [4].
Upon receipt, the keystones were carefully unwrapped
and photographed. All tracks were mounted between
thin (thickness unknown) silicon nitride windows,
which greatly reduced fluorescence permitting all
available excitation wavelengths to be used on these
grains.
The samples have been analysed using Fe-K XAS and
SR-XRD measurements at Beamline I18 of the Diamond synchrotron, UK. A spot size of 2.5 × 2.5 µm
was used and Fe-K XAS was measured with the highest resolution over the Fe-K XANES region (70907125 eV), from which an absorption edge was estimated at 0.5 normalized intensity, and the 1s→3d centroids were estimated as the intensity-weighted average
of baseline-subtracted pre-edge peaks. The transmission SR-XRD measurements were taken between 9 15 keV, with a 2θ range of ~4.3° to ~41.7° corresponding to d-spacings of ~1 Å up to ~18 Å.
Results: Table 1 gives the ID (‘TG’ = Terminal Grain,
‘SG’ = subgrain) and the position of the subgrains relative to the largest terminal particle (denoted ‘TG#1’).
If viewed with the track entrance pointing south, then
+ve X is west; +ve Y is south and +ve Z is into the
aerogel. The detected composition of the grains are
also given as well as contaminating aerogel (if detected).
Fig. 1. SR-XRD identification of magnetite in the terminal grain of Track #187 through comparison of the 2
θ peaks to a powdered magnetite standard.
Fig. 2. Fe-K XANES plots of Track #189, #190 terminal grains compared to chondritic pyroxene. The #189
and #190 features around the absorption edges and
white lines are characteristic of pyroxene.
Track #187: The main terminal grain has an ironoxide type composition, with a (degraded) Raman
spectrum indicative of magnetite mixed with some
haematite. X-ray data confirms the presence of magnetite. (Fig. 1). The other terminal grain gave no detectable Raman signal with the 473 nm laser, but gave
a very weak signature of carbon ‘D’ and ‘G’ bands
when the 633 nm laser was used. Many subgrains are
also present in the track, but gave no detectable Raman
spectrum using either the 473 or 633 nm laser.
Track #188: The single terminal grain gave no detectable Raman signal under 473 or 633 nm laser wavelengths. One sub-grain gave an unidentified line at
1200 cm-1 and another had a weak carbon signal.
46th Lunar and Planetary Science Conference (2015)
Track #189: The main terminal grain gave no Raman
signal from the 473 nm laser, but a weak detection of
‘D’ and ‘G’ carbon lines was made with the 633 nm
laser and confirmed with the 523 nm laser. No other
Raman signals were detected from any of the other
grains using 473, 532 or 633 nm wavelength lasers.
However, Fe-K XANES (Fig. 2) is consistent with a
pyroxene identity.
Track #190: Terminal grains gave no detectable signal
under any laser wavelength. One sub-grain gave a
weak carbon signal with the 633 nm wavelength laser.
Fe-K XANES (Fig. 2) of the main terminal grain is
consistent with a pyroxene identity.
It should be noted that tracks #189 and #190 are very
closely spaced (separated by ~200 μm) and seem to
have impacted the front surface of the aerogel at an
angle of 10° from the normal.
2000.pdf
Conclusions:
1) A combination of SR-XRD, XANES and Raman
reveals pyroxenes, magnetite and carbonaceous
material in these terminal grains. There is increasing evidence that Wild-2 was magnetite rich, suggesting that the parent body underwent at least
limited water-rock reactions [3]. Carbonaceous
material seems to be concentrated around the
bulb(s), possibly indicative of the (organic?)
‘glue’ that held the aggregate impactor together.
2) A range of different laser excitation wavelengths
are needed to maximise the chances of identifying
the composition of grains. More data need to be
acquired using all four available laser wavelengths
to maximise the chances of detecting the terminal
and subgrain compositions.
3) Laser heating is a potential problem [5], and care
has to be taken. A temperature calibration for olivine (and other minerals) is needed using
Stokes/Anti-Stokes line ratios.
References: [1] Brownlee D. E. et al. (2006). Science, 314,
1711. [2] Wopenka B. (2012). MAPS, 47.4, 565. [3] Bridges
et al. (2014). 45th LPSC, abstract #2015. [4] Price M. C. et
al. (2014). 45th LPSC abstract # 1252. [5] Hibbert R. et al.
(2014). 45th LPSC abstract #1350.
Table 1: Raman analyses results from grains from tracks #187, #188, #189 and #190 (see text for description).
Grain ID
X, Y, Z (µm)
Composition
Grain ID
X, Y, Z (μm)
Composition
#187 TG #1
(0,0,0)
Possible magnetite/ haematite
spectrum (mix?)
#188 TG #1
(0,0,0)
No detectable Raman
signal
#187 TG #2
(+48.9,+64.5,-31.5)
Very weak carbon
#188 SG ‘a’
(-12.5,+355.9,+60.2)
Weak line at 1200
cm-1
#187 SG ‘a’
(+42.3, +131.6,-24.0)
No detectable
Raman signal
with 473 nm laser
#188 SG ‘b’
(-16.8,+408.5,+53.1)
Weak carbon bands
#187 SG ‘b’
(+22.0,+147.8, -32.4)
“
#188 SG ‘c’
(+6.6, +445.8, +56.8)
#187 SG ‘c’
(-6.0, +12.0, +9.1)
“
#189 TG #1
(0,0,0)
Very weak hint of
Carbon with 532nm
laser
#187 SG ‘d’
(-3.3, +30.2, +6.1)
“
#189 TG #2
(+38.1,+129.1,+71.4)
Weak hint of Carbon
with 633nm laser
#187 SG ‘e’
(+4.1, +138.1, -13.0)
“
#189 TG #3
(-50.9, +172.1,+42.7)
No detectable signal
with any laser
#187 SG ‘f’
(+26.8, +198.6,-10.4)
“
#190 TG #1
(0, 0, 0)
No detectable signal
#187 SG ‘g’
(+58.4, +97.0, -31.9)
“
#190 SG ‘a’
(+75.9, +42.5, +3.45)
#190 SG ‘b’
(+85.7, +617.2, +24.8) Weak carbon
“
Aerogel C-H lines


© Copyright 2026