
ABUNDANCES OF O-RICH PRESOLAR GRAINS IN THE ACFER
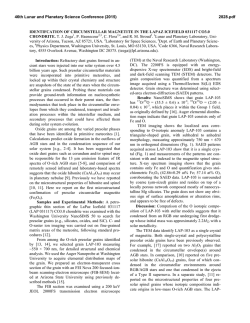
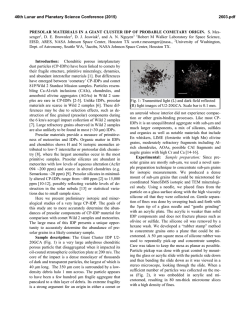
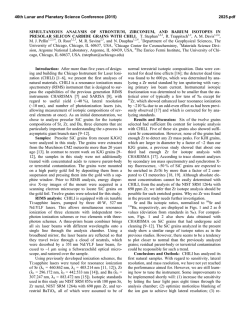
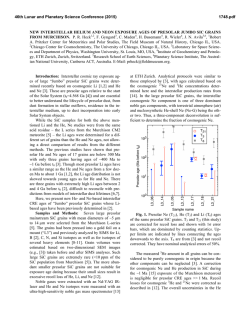
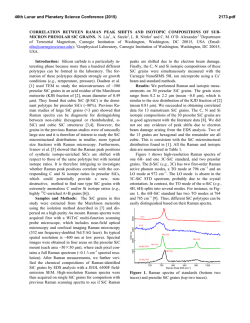
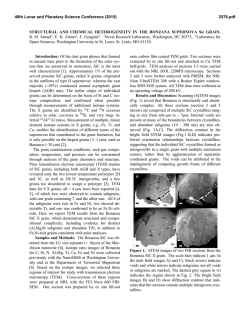
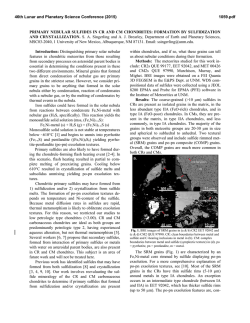
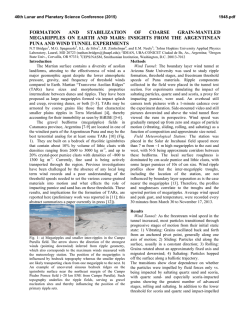
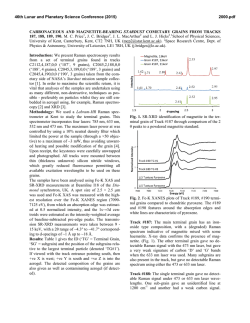
46th Lunar and Planetary Science Conference (2015) 1315.pdf ABUNDANCES OF O-RICH PRESOLAR GRAINS IN THE ACFER 094 METEORITE REVISITED. P. Hoppe1, J. Leitner1, and J. Kodolányi1, 1Max Planck Institute for Chemistry, P.O. Box 3060, 55020 Mainz, Germany ([email protected]). Introduction: Primitive Solar System materials contain small quantities of presolar grains that formed in the winds of evolved stars or in the ejecta of stellar explosions [1]. Relative contributions of grains from supernovae (SNe) vary with mineralogy and are ~11% (according to data in Washington University presolar grain data base [2]) for the most abundant stardust minerals, the silicates. The majority of identified Orich SN grains exhibit supra-solar 18O/16O and a range of 17O/16O ratios [3-5]. This is surprising because the O-rich zones in Type II SNe show large isotopic overabundances in 16O [6]. Up to date only two oxide grains with large 16O enrichments were found [7,8]. In a previous study [9] we reported results from a high-resolution NanoSIMS oxygen ion imaging survey (50 nm primary ion beam size) of matrix material in the Acfer 094 meteorite, known to host large amounts of presolar O-rich dust. The primary goal of that study was finding previously unrecognized small (< 100 nm) SN silicates. Visual inspection of ion images and a simple statistical approach, based on O isotope ratios of 420,000 grid elements, each 78 x 78 nm2 in size, gave no evidence for a large number of unrecognized SN silicates in the size range 70-100 nm. Here, we report on a refined approach to identify small presolar grains: Instead of calculating O isotope ratios for square-sized grid elements in the Acfer 094 ion images we developed a data reduction algorithm that permits to search for isotope anomalies of continuous, irregular-shaped regions in a fully automated way. In order to determine the significance level at which presolar O-rich grains can be identified with high confidence in automated searches we conducted a highresolution O ion imaging survey on a terrestrial rhodochrosite (MnCO3). Methods: The experimental details of our highresolution NanoSIMS O ion imaging survey of 2700 m2 fine-grained matrix material in Acfer 094 are given in [9]. The same experimental setup was used to scan 500 m2 on our rhodochrosite standard. Scanned areas are comparatively small because of smaller ion image sizes (5 x 5 m2) and longer integration times (130 min per image) compared to what is usually used in conventional (i.e., with 100 nm primary ion beam size) NanoSIMS ion imaging surveys. The automated search for isotopically anomalous regions consists of 3 steps: (i) Conversion of O isotope ratio images to sigma images, in which each pixel is represented by a significance level, based on counting statistics, for the deviation from the solar O isotope composition. (ii) Search for local minima and maxima in smoothed sigma images. (iii) Finding the 50% contour lines around identified minima/maxima and calculation of significance levels using the method of [10] and of O isotope ratios for objects with anomalies >4.26 (corresponds to probability of 2x10 -5). Figure 1. Negative secondary ion images of 18O/16O in a terrestrial rhodochrosite sample (left) and of 17O/16O in Acfer 094 (right). Fields of view: 5 x 5 m2. The circle in the left image indicates an isotope anomaly at the 5.27 level. Figure 2. 17O and 18O values of regions (120 nm diameter on average) in rhodochrosite with isotope anomalies at a significance level >4.26. Results and Discussion: The fully automated processing of O isotope ion images for rhodochrosite revealed several regions (average size 120 nm) with isotope anomalies >4.26 up to a maximum of 5.27 (Figs. 1 and 2). From statistics alone we would not have expected to find 120 nm-sized objects at the >4.3 level. Generally, 4 anomalies, based on counting statistics, are considered a reliable limit for the 46th Lunar and Planetary Science Conference (2015) identification of presolar grains [e.g., 5]. However, our work suggests that a significance level of 4 is not sufficient for a safe identification of presolar grains and for the interpretation of the Acfer 094 data we will use a significance level of 5.3 instead. If we apply the automated anomaly search to the ion images of Acfer 094 then 11 O-rich presolar grains (ten silicates, one oxide) with median size of 160 nm (inferred from the ion images) are identified (the largest grain is shown in Fig. 1, right. From this an abundance estimate for O-rich presolar dust calculates to 138 (+55, -41) ppm. Their O isotope ratios are shown in Fig. 3. Three grains belong to Group 1, four to Group 3, three to Group 4, and one is unclassified (for a definition of Groups see [4]), an usual distribution in view of existing data of presolar grains. None of these 11 likely presolar grains shows a strong excess in 16O, as expected for the majority of SN grains. Nevertheless, the fraction of 18O-rich SN grains is 27 (+26, -14) %, higher than what was inferred before (4% for chemically separated oxides, 11% for silicates). When we apply the fully automated image processing to lower resolution (i.e., 100 nm primary beam size) O isotope data of Acfer 094 from our laboratory [14,15], then we obtain abundances of presolar O-rich grains (37 silicates, one oxide; median size: 220 nm) of 182 ± 30 ppm. This number is somewhat higher than the values inferred from visual inspection of Acfer 094 ion images [3,5,14,15] (weighted mean: 155 ± 21 ppm). About 10% of all presolar silicate grains from Acfer 094 (and also from other meteorites) listed in the WU presolar grain data base [2] do not meet our 5.3 criterion, which, if enforced, would make the difference slightly larger. The high abundances of Group 3 and 4 silicate grains from high-resolution ion imaging are not seen in the low-resolution ion imaging data (Fig. 3) which may be due to the lower spatial resolution of these studies. More high-resolution ion imaging work is clearly needed to confirm this finding from our high-resolution imaging survey. It is remarkable that four of the likely presolar silicate grains (all of which belong to Group 3) identified by high-resolution ion imaging plot along a line with slope 0.25 defined by chemically separated presolar oxide grains [e.g., 4], which provide the most reliable O isotope data, and measurements of the present-day interstellar medium (ISM) which, on average, has a higher than solar 17O/18O ratio [11,12]. This raises the question whether the four Group 3 silicate grains of this study represent dust that formed in the ISM, and not stellar dust. This would require that the presolar ISM had essentially the same 17O/18O ratio as the present-day ISM. However, there are two arguments 1315.pdf against this view: (i) Based on a Monte Carlo simulation Nittler [13] showed that the O-isotopic ratios of Group 3 grains are well explained by low-mass parent stars with solar-like 17O/18O ratios. (ii) Most of the grains along the slope 0.25 line are refractory oxides which are very unlikely to have formed at low temperatures in the ISM [11]. This does not completely rule out the possibility that the four silicates formed in the ISM while the oxides are stellar condensates, but this would require different 17O/18O ratios in the presolar ISM and in the parent stars of Group 3 oxide grains, a scenario that appears difficult to achieve. Acknowledgements: We thank Antje Sorowka and Joachim Huth for SEM analyses and Elmar Gröner for support on the NanoSIMS. Figure 3. O-isotopic ratios of presolar O-rich grains from this work (Acfer 094 high-resolution (HR) and lowresolution (LR) ion imaging) in comparison with literature data (chemically separated oxides; in-situ silicates) from the the WU presolar grain data base [2], and a line representing the 17O/18O ratio of the present day ISM [11]. References: [1] Zinner E. (2014) Presolar Grains. In Meteorites and Cosmochemical Processes, Vol. 1 (ed. A. M. Davis), pp. 181-213, Elsevier. [2] Hynes K. M. and Gyngard F. (2009) LPSC, 40, #1398. [3] Nguyen A. N. et al. (2007) ApJ, 656, 1223. [4] Nittler L. R. et al. (2008) ApJ, 682, 1450. [5] Vollmer C. et al. (2009) GCA, 73, 7127. [6] Rauscher T. et al. (2002) ApJ, 576, 323. [7] Gyngard F. et al. (2010) ApJ, 717, 107. [8] Nittler L. R. et al. (1998) Nature, 393, 222. [9] Hoppe P. et al. (2013) LPSC, 44, #1038. [10] Gehrels N. (1986) ApJ, 303, 336. [11] Nittler L. R. and Gaidos E. (2012) MAPS, 47, 2031. [12] Wouterloot J. G. A. et al. (2008) A&A, 487, 237. [13] Nittler L. R. (2009) PASA, 26, 271. [14] Kodolányi J. et al. (2014) GCA, 140, 577. [15] Leitner J. et al. (2013) LPSC, 44, #2273.

© Copyright 2026