
CEDAR FAIR -LP - TheStreet.com
February 1, 2015
NYSE: FUN
CEDAR FAIR -LP
BUY
A+
A
A-
HOLD
B+
B
Annual Dividend Rate
$2.80
B-
C+
C
Annual Dividend Yield
5.16%
SELL
C-
D+
D
Beta
1.07
E+
E
E-
F
BUY
Market Capitalization
$3.0 Billion
Sector: Consumer Goods & Svcs
FUN BUSINESS DESCRIPTION
Cedar Fair, L.P. owns and operates amusement and
water parks in the United States and Canada. As of
March 3, 2014, the company operated 11
amusement parks, 3 outdoor water parks, 1 indoor
water park, and 5 hotels.
D-
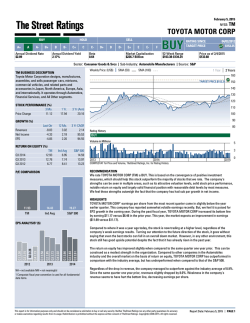
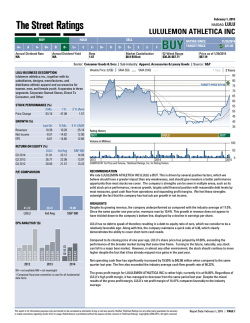
Weekly Price: (US$)
52-Week Range
$42.75-$55.77
Sub-Industry: Leisure Facilities
SMA (50)
RATING SINCE
TARGET PRICE
08/19/2013
$62.61
Price as of 1/29/2015
$54.21
Source: S&P
SMA (100)
1 Year
2 Years
65
TARGET
PRICE
$62.61
TARGET
TARGETPRICE
PRICE$62.61
$62.61
TARGET
PRICE
$62.61
60
55
50
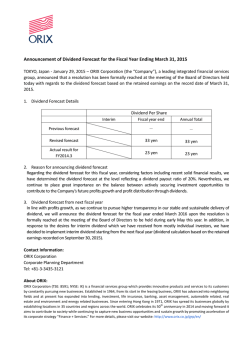
STOCK PERFORMANCE (%)
3 Mo.
Price Change
14.85
1 Yr.
10.04
3 Yr (Ann)
28.25
Last Qtr
0.54
-14.98
-14.96
12 Mo.
1.17
-14.02
-14.63
3 Yr CAGR
3.94
120.17
124.48
RETURN ON EQUITY (%)
FUN
Q3 2014
66.28
Q3 2013
61.57
Q3 2012
59.24
Ind Avg
79.72
2,715.46
34.74
S&P 500
14.59
13.97
13.23
45
40
GROWTH (%)
Revenues
Net Income
EPS
35
30
Rating History
BUY
HOLD
BUY
Volume in Millions
2013
3
2014
2015
0
COMPUSTAT for Price and Volume, TheStreet Ratings, Inc. for Rating History
P/E COMPARISON
RECOMMENDATION
We rate CEDAR FAIR -LP (FUN) a BUY. This is driven by a few notable strengths, which we believe should
have a greater impact than any weaknesses, and should give investors a better performance opportunity than
most stocks we cover. The company's strengths can be seen in multiple areas, such as its revenue growth,
attractive valuation levels, good cash flow from operations, expanding profit margins and notable return on
equity. We feel these strengths outweigh the fact that the company has had sub par growth in net income.
29.95
32.26
19.08
FUN
Ind Avg
S&P 500
2012
2013
Q2 0.79
Q3 2.90
Q1 -1.51
Q4 -0.37
Q2 0.85
Q3 3.41
Net operating cash flow has increased to $259.48 million or 10.70% when compared to the same quarter last
year. The firm also exceeded the industry average cash flow growth rate of -31.28%.
Q1 -1.95
Q4 -0.19
Q3 2.52
Q2 0.66
Q1 -1.18
EPS ANALYSIS¹ ($)
HIGHLIGHTS
The revenue growth came in higher than the industry average of 10.8%. Since the same quarter one year
prior, revenues slightly increased by 0.5%. This growth in revenue does not appear to have trickled down to
the company's bottom line, displayed by a decline in earnings per share.
2014
The gross profit margin for CEDAR FAIR -LP is rather high; currently it is at 62.13%. Regardless of FUN's high
profit margin, it has managed to decrease from the same period last year. Despite the mixed results of the
gross profit margin, FUN's net profit margin of 27.19% significantly outperformed against the industry.
The return on equity has improved slightly when compared to the same quarter one year prior. This can be
construed as a modest strength in the organization. In comparison to other companies in the Hotels,
Restaurants & Leisure industry and the overall market on the basis of return on equity, CEDAR FAIR -LP has
underperformed in comparison with the industry average, but has greatly exceeded that of the S&P 500.
NA = not available NM = not meaningful
1 Compustat fiscal year convention is used for all fundamental
data items.
This report is for information purposes only and should not be considered a solicitation to buy or sell any security. Neither TheStreet Ratings nor any other party guarantees its accuracy
or makes warranties regarding results from its usage. Redistribution is prohibited without the express written consent of TheStreet Ratings. Copyright(c) 2006-2015. All rights reserved.
Report Date: February 1, 2015
PAGE 1
February 1, 2015
NYSE: FUN
CEDAR FAIR -LP
Sector: Consumer Goods & Svcs Leisure Facilities Source: S&P
Annual Dividend Rate
$2.80
Annual Dividend Yield
5.16%
PEER GROUP ANALYSIS
350%
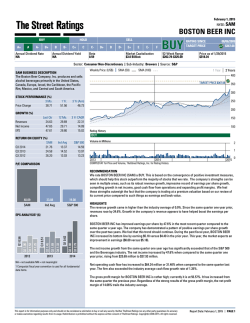
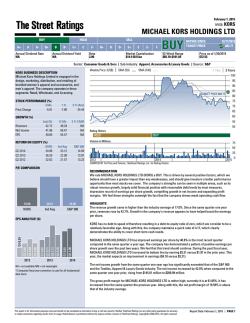
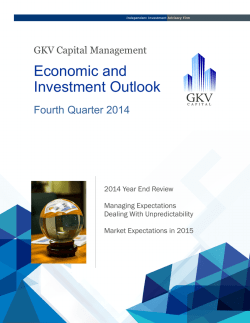
REVENUE GROWTH AND EBITDA MARGIN*
MYCC
V
FA
AB
OR
RICK
BWL.A CLUB TRK
LE
AB
-50%
R
VO
FA
Revenue Growth (TTM)
LE
UN
MTN
-60%
SIX
LTM
ISCA
FUN
SEAS 60%
EBITDA Margin (TTM)
Companies with higher EBITDA margins and
revenue growth rates are outperforming companies
with lower EBITDA margins and revenue growth
rates. Companies for this scatter plot have a market
capitalization between $55.6 Million and $4.1 Billion.
Companies with NA or NM values do not appear.
*EBITDA – Earnings Before Interest, Taxes, Depreciation and
Amortization.
350%
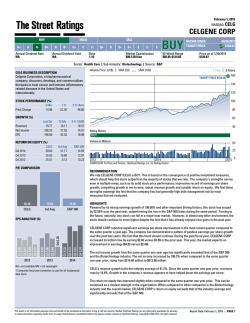
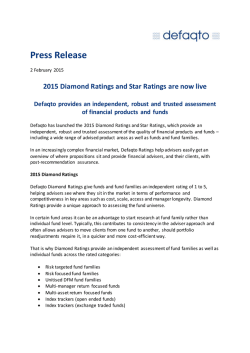
REVENUE GROWTH AND EARNINGS YIELD
MYCC
Beta
1.07
Market Capitalization
$3.0 Billion
52-Week Range
$42.75-$55.77
Price as of 1/29/2015
$54.21
INDUSTRY ANALYSIS
The hotels, restaurant, and leisure industry consists of hotels, restaurants, casinos, cruise lines, resorts, and
theme parks. Demand is driven by a fairly consistent group of factors throughout the whole of the industry:
personal income levels, total employment, and consumer confidence. In recent years, catastrophic weather,
fear of terrorism, and health epidemics directly impacted the industry in a material way. The industry is
capital, marketing, personnel, energy, maintenance, and technology intensive. Major players include
Intercontinental Hotels Group (IHG), Marriott International Inc. (MAR), Las Vegas Sands (LVS), MGM Resorts
International (MGM), McDonald’s (MCD), and Yum! Brands (YUM).
The foodservice industry employs more than 12 million people, making it America’s second largest employer
after the U.S. government. Not only is the industry huge, it’s growing, as factors - such as a rise in
two-income households - have been leading to increasing levels of dining out. In recent years, restaurant
sales have risen roughly 5% annually according to National Restaurant Association estimates. However,
despite its growth rate, the industry should be seen as mature. Companies within the industry generally earn
thin margins and face stiff competition. As a result, M&A activity is frequent as competitors look to spread
fixed costs across more locations.
Both tourism and business travel remain vital to the industry, and as a result, U.S. GDP growth, consumer
confidence, and corporate earnings remain vital to the industry’s success. The expansion in capital spending
has been in response to projected demand. However, overdevelopment in certain areas is a concern. Looking
forward, any prolonged low occupancy rates could threaten hotels that are heavily leveraged. As for metrics,
occupancy, average daily room rate, and revenue per available room should be considered when analyzing
the industry or a player within the industry.
Casinos generate roughly $68 billion in revenues annually, and typically, 50% of a casino hotel’s revenues
come from gaming, 20% from hotel rooms, 15% from food and beverages, and 15% from retail stores, shows,
and other entertainment offerings. Expansion and consolidation have been recent trends of note. In 2005
alone, MGM Resorts International purchased Mandalay Resort Group for close to $8 billion and Harrah’s
bought Caesars for over $9 billion. Recent years have also seen a good amount of new casino construction in
the $700 million range as competitors jockey to attract visitors by providing more elaborate offerings. Looking
ahead, further capacity expansion may threaten margins. Meanwhile, most of the industry’s top-line growth
has come from Native American casinos, which at present generate roughly $16 billion in revenues annually.
V
FA
AB
OR
PEER GROUP: Hotels, Restaurants & Leisure
LE
AB
-50%
R
VO
FA
Revenue Growth (TTM)
LE
UN
MTN
ISCA
LTM
CLUB BWL.A SIX FUN
SEAS
-5%
RICK
TRK
12.5%
Earnings Yield (TTM)
Companies that exhibit both a high earnings yield
and high revenue growth are generally more
attractive than companies with low revenue growth
and low earnings yield. Companies for this scatter
plot have revenue growth rates between -4.6% and
336.9%. Companies with NA or NM values do not
appear.
Ticker
FUN
TRK
BWL.A
SIX
MTN
LTM
CLUB
SEAS
ISCA
MYCC
RICK
Recent
Company Name
Price ($)
CEDAR FAIR -LP
54.21
SPEEDWAY MOTORSPORTS INC
22.80
BOWL AMERICA INC
14.84
SIX FLAGS ENTERTAINMENT CORP 43.85
VAIL RESORTS INC
89.96
LIFE TIME FITNESS INC
55.69
TOWN SPORTS INTL HOLDINGS
6.76
SEAWORLD ENTERTAINMENT INC 17.64
INTL SPEEDWAY CORP
30.07
CLUBCORP HOLDINGS INC
17.29
RCI HOSPITALITY HLDGS INC
9.83
Market
Cap ($M)
3,028
942
56
4,105
3,267
2,179
164
1,588
1,419
1,114
102
Price/
Earnings
29.95
10.60
54.96
35.65
85.68
18.63
NM
24.50
20.88
NM
8.86
Net Sales
TTM ($M)
1,137.88
482.42
22.66
1,146.30
1,259.52
1,266.40
458.03
1,385.23
651.94
851.18
129.17
Net Income
TTM ($M)
101.78
94.49
1.37
123.45
37.58
118.56
-6.00
61.86
67.38
-50.49
11.24
The peer group comparison is based on Major Leisure Facilities companies of comparable size.
This report is for information purposes only and should not be considered a solicitation to buy or sell any security. Neither TheStreet Ratings nor any other party guarantees its accuracy
or makes warranties regarding results from its usage. Redistribution is prohibited without the express written consent of TheStreet Ratings. Copyright(c) 2006-2015. All rights reserved.
Report Date: February 1, 2015
PAGE 2
February 1, 2015
NYSE: FUN
CEDAR FAIR -LP
Sector: Consumer Goods & Svcs Leisure Facilities Source: S&P
Annual Dividend Rate
$2.80
Annual Dividend Yield
5.16%
COMPANY DESCRIPTION
Cedar Fair, L.P. owns and operates amusement and
water parks in the United States and Canada. As of
March 3, 2014, the company operated 11 amusement
parks, 3 outdoor water parks, 1 indoor water park, and 5
hotels. Its amusement parks include Cedar Point located
on Lake Erie between Cleveland and Toledo in Sandusky,
Ohio; Kings Island near Cincinnati, Ohio; Canada's
Wonderland near Toronto, Canada; Dorney Park &
Wildwater Kingdom located near Allentown in South
Whitehall Township, Pennsylvania; Valleyfair located
near Minneapolis/St. Paul in Shakopee, Minnesota;
Michigan's Adventure located near Muskegon, Michigan;
Kings Dominion near Richmond, Virginia; Carowinds in
Charlotte, North Carolina; Worlds of Fun located in
Kansas City, Missouri; Knott's Berry Farm located near
Los Angeles in Buena Park, California; and California's
Great America located in Santa Clara, California. The
company also manages and operates Gilroy Gardens
Family Theme Park in Gilroy, California; and owns and
operates the Castaway Bay Indoor Waterpark Resort in
Sandusky, Ohio. Cedar Fair Management, Inc. serves as
the general partner of Cedar Fair, L.P. The company was
founded in 1983 and is based in Sandusky, Ohio.
CEDAR FAIR -LP
One Cedar Point Drive
Sandusky, OH 44870
USA
Phone: 419-626-0830
http://www.cedarfair.com
Beta
1.07
Market Capitalization
$3.0 Billion
52-Week Range
$42.75-$55.77
Price as of 1/29/2015
$54.21
STOCK-AT-A-GLANCE
Below is a summary of the major fundamental and technical factors we consider when determining our
overall recommendation of FUN shares. It is provided in order to give you a deeper understanding of our
rating methodology as well as to paint a more complete picture of a stock's strengths and weaknesses. It is
important to note, however, that these factors only tell part of the story. To gain an even more comprehensive
understanding of our stance on the stock, these factors must be assessed in combination with the stock’s
valuation. Please refer to our Valuation section on page 5 for further information.
FACTOR
SCORE
4.0
Growth
out of 5 stars
weak
Measures the growth of both the company's income statement and
cash flow. On this factor, FUN has a growth score better than 70% of
the stocks we rate.
strong
4.5
Total Return
out of 5 stars
weak
Measures the historical price movement of the stock. The stock
performance of this company has beaten 80% of the companies we
cover.
strong
3.5
Efficiency
out of 5 stars
weak
Measures the strength and historic growth of a company's return on
invested capital. The company has generated more income per dollar of
capital than 60% of the companies we review.
strong
4.5
Price volatility
out of 5 stars
weak
Measures the volatility of the company's stock price historically. The
stock is less volatile than 80% of the stocks we monitor.
strong
2.0
Solvency
out of 5 stars
weak
Measures the solvency of the company based on several ratios. The
company is more solvent than 30% of the companies we analyze.
strong
5.0
Income
out of 5 stars
weak
Measures dividend yield and payouts to shareholders. The company's
dividend is higher than 90% of the companies we track.
strong
THESTREET RATINGS RESEARCH METHODOLOGY
TheStreet Ratings' stock model projects a stock's total return potential over a 12-month period including both
price appreciation and dividends. Our Buy, Hold or Sell ratings designate how we expect these stocks to
perform against a general benchmark of the equities market and interest rates. While our model is
quantitative, it utilizes both subjective and objective elements. For instance, subjective elements include
expected equities market returns, future interest rates, implied industry outlook and forecasted company
earnings. Objective elements include volatility of past operating revenues, financial strength, and company
cash flows.
Our model gauges the relationship between risk and reward in several ways, including: the pricing drawdown
as compared to potential profit volatility, i.e.how much one is willing to risk in order to earn profits; the level of
acceptable volatility for highly performing stocks; the current valuation as compared to projected earnings
growth; and the financial strength of the underlying company as compared to its stock's valuation as
compared to projected earnings growth; and the financial strength of the underlying company as compared
to its stock's performance. These and many more derived observations are then combined, ranked, weighted,
and scenario-tested to create a more complete analysis. The result is a systematic and disciplined method of
selecting stocks.
This report is for information purposes only and should not be considered a solicitation to buy or sell any security. Neither TheStreet Ratings nor any other party guarantees its accuracy
or makes warranties regarding results from its usage. Redistribution is prohibited without the express written consent of TheStreet Ratings. Copyright(c) 2006-2015. All rights reserved.
Report Date: February 1, 2015
PAGE 3
February 1, 2015
NYSE: FUN
CEDAR FAIR -LP
Sector: Consumer Goods & Svcs Leisure Facilities Source: S&P
Annual Dividend Rate
$2.80
Annual Dividend Yield
5.16%
Consensus EPS Estimates² ($)
IBES consensus estimates are provided by Thomson Financial
-0.09
2.15 E
3.02 E
Q4 FY14
2014(E)
2015(E)
Beta
1.07
Market Capitalization
$3.0 Billion
52-Week Range
$42.75-$55.77
Price as of 1/29/2015
$54.21
FINANCIAL ANALYSIS
CEDAR FAIR -LP's gross profit margin for the third quarter of its fiscal year 2014 is essentially unchanged
when compared to the same period a year ago. Even though sales increased, the net income has decreased.
CEDAR FAIR -LP has average liquidity. Currently, the Quick Ratio is 1.16 which shows that technically this
company has the ability to cover short-term cash needs. The company's liquidity has decreased from the
same period last year.
During the same period, stockholders' equity ("net worth") has decreased by 20.11% from the same quarter
last year. Together, the key liquidity measurements indicate that it is relatively unlikely that the company will
face financial difficulties in the near future.
STOCKS TO BUY: TheStreet Quant Ratings has identified a handful of stocks that can potentially TRIPLE in the
next 12-months. To learn more visit www.TheStreetRatings.com.
INCOME STATEMENT
Net Sales ($mil)
EBITDA ($mil)
EBIT ($mil)
Net Income ($mil)
Q3 FY14
595.32
314.03
255.79
161.90
Q3 FY13
592.08
317.31
259.81
190.42
Q3 FY14
189.37
2,117.08
1,568.85
153.56
Q3 FY13
183.48
2,101.05
1,530.03
192.22
Q3 FY14
62.13%
52.74%
42.97%
0.54
4.80%
66.28%
Q3 FY13
63.48%
53.59%
43.88%
0.54
5.63%
61.57%
Q3 FY14
1.43
0.91
21.86
11.70
Q3 FY13
1.46
0.89
25.68
10.12
Q3 FY14
56
0.70
2.90
2.75
NA
234,952
Q3 FY13
56
0.63
3.41
3.45
NA
176,396
BALANCE SHEET
Cash & Equiv. ($mil)
Total Assets ($mil)
Total Debt ($mil)
Equity ($mil)
PROFITABILITY
Gross Profit Margin
EBITDA Margin
Operating Margin
Sales Turnover
Return on Assets
Return on Equity
DEBT
Current Ratio
Debt/Capital
Interest Expense
Interest Coverage
SHARE DATA
Shares outstanding (mil)
Div / share
EPS
Book value / share
Institutional Own %
Avg Daily Volume
2 Sum of quarterly figures may not match annual estimates due to
use of median consensus estimates.
This report is for information purposes only and should not be considered a solicitation to buy or sell any security. Neither TheStreet Ratings nor any other party guarantees its accuracy
or makes warranties regarding results from its usage. Redistribution is prohibited without the express written consent of TheStreet Ratings. Copyright(c) 2006-2015. All rights reserved.
Report Date: February 1, 2015
PAGE 4
February 1, 2015
NYSE: FUN
CEDAR FAIR -LP
Sector: Consumer Goods & Svcs Leisure Facilities Source: S&P
Annual Dividend Rate
$2.80
Annual Dividend Yield
5.16%
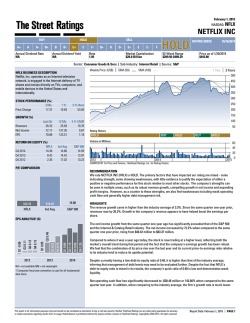
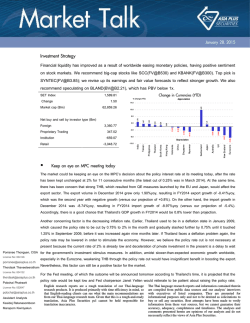
RATINGS HISTORY
Our rating for CEDAR FAIR -LP has not changed
since 8/19/2013. As of 1/29/2015, the stock was
trading at a price of $54.21 which is 2.8% below its
52-week high of $55.77 and 26.8% above its 52-week
low of $42.75.
1
2
3
premium
$50
52-Week Range
$42.75-$55.77
4
5
FUN 29.95
Peers 32.26
• Average. An average P/E ratio can signify an
industry neutral price for a stock and an average
growth expectation.
• FUN is trading at a valuation on par with its peers.
Price/Projected Earnings
1
2
3
premium
From
Hold
Buy
Buy
To
Buy
Hold
Buy
4
5
FUN 17.96
Peers 29.74
• Discount. A lower price-to-projected earnings ratio
than its peers can signify a less expensive stock or
lower future growth expectations.
• FUN is trading at a discount to its peers.
Price/Book
(as of 1/29/2015)
47.87% Buy - We believe that this stock has the
opportunity to appreciate and produce a total return of
more than 10% over the next 12 months.
29.29% Hold - We do not believe this stock offers
conclusive evidence to warrant the purchase or sale of
shares at this time and that its likelihood of positive total
return is roughly in balance with the risk of loss.
22.83% Sell - We believe that this stock is likely to
decline by more than 10% over the next 12 months, with
the risk involved too great to compensate for any
possible returns.
1
2
3
premium
4
5
Price/Sales
1
2
premium
3
4
5
Price to Earnings/Growth
4
5
discount
1
2
3
premium
4
5
discount
FUN 2.77
Peers 1.36
• Premium. The PEG ratio is the stock’s P/E divided by
the consensus estimate of long-term earnings
growth. Faster growth can justify higher price
multiples.
• FUN trades at a significant premium to its peers.
Earnings Growth
1
2
3
4
lower
5
higher
FUN -14.63
Peers 301.68
• Lower. Elevated earnings growth rates can lead to
capital appreciation and justify higher
price-to-earnings ratios.
• However, FUN is expected to significantly trail its
peers on the basis of its earnings growth rate.
Sales Growth
discount
FUN 2.66
Peers 3.27
• Discount. In the absence of P/E and P/B multiples,
the price-to-sales ratio can display the value
investors are placing on each dollar of sales.
• FUN is trading at a discount to its industry on this
measurement.
3
FUN 9.49
Peers 19.22
• Discount. The P/CF ratio, a stock’s price divided by
the company's cash flow from operations, is useful
for comparing companies with different capital
requirements or financing structures.
• FUN is trading at a significant discount to its peers.
discount
FUN 19.72
Peers 20.92
• Average. A lower price-to-book ratio makes a stock
more attractive to investors seeking stocks with
lower market values per dollar of equity on the
balance sheet.
• FUN is trading at a valuation on par with its peers.
2
premium
discount
Price reflects the closing price as of the date listed, if available
RATINGS DEFINITIONS &
DISTRIBUTION OF THESTREET RATINGS
1
Price/CashFlow
discount
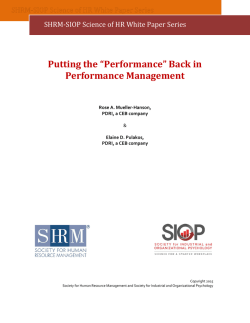
2014
MOST RECENT RATINGS CHANGES
Date
Price
Action
8/19/13
$43.49
Upgrade
5/9/13
$42.44 Downgrade
1/29/13
$37.15 No Change
Price as of 1/29/2015
$54.21
VALUATION
BUY. CEDAR FAIR -LP's P/E ratio indicates a discount compared to an average of 32.26 for the Hotels,
Restaurants & Leisure industry and a significant premium compared to the S&P 500 average of 19.08. For
additional comparison, its price-to-book ratio of 19.72 indicates a significant premium versus the S&P 500
average of 2.69 and a discount versus the industry average of 20.92. The price-to-sales ratio is well above the
S&P 500 average, but well below the industry average. Upon assessment of these and other key valuation
criteria, CEDAR FAIR -LP proves to trade at a discount to investment alternatives within the industry.
Price/Earnings
$40
2013
Market Capitalization
$3.0 Billion
$60
BUY: $43.49
HOLD: $42.44
BUY: $37.15
2 Year Chart
Beta
1.07
1
2
3
lower
4
5
higher
FUN 1.17
Peers 19.37
• Lower. A sales growth rate that trails the industry
implies that a company is losing market share.
• FUN significantly trails its peers on the basis of
sales growth
DISCLAIMER:
TheStreet Ratings
14 Wall Street, 15th Floor
New York, NY 10005
www.thestreet.com
The opinions and information contained herein have been obtained or derived from sources believed to be reliable, but
TheStreet Ratings cannot guarantee its accuracy and completeness, and that of the opinions based thereon. Data is provided
via the COMPUSTAT® Xpressfeed product from Standard &Poor's, a division of The McGraw-Hill Companies, Inc., as well as
other third-party data providers.
Research Contact: 212-321-5381
Sales Contact: 866-321-8726
TheStreet Ratings is a division of TheStreet, Inc., which is a publisher. This research report contains opinions and is provided
for informational purposes only. You should not rely solely upon the research herein for purposes of transacting securities or
other investments, and you are encouraged to conduct your own research and due diligence, and to seek the advice of a
qualified securities professional, before you make any investment. None of the information contained in this report constitutes,
or is intended to constitute a recommendation by TheStreet Ratings of any particular security or trading strategy or a
determination by TheStreet Ratings that any security or trading strategy is suitable for any specific person. To the extent any of
the information contained herein may be deemed to be investment advice, such information is impersonal and not tailored to the
investment needs of any specific person. Your use of this report is governed by TheStreet, Inc.'s Terms of Use found at
http://www.thestreet.com/static/about/terms-of-use.html.
This report is for information purposes only and should not be considered a solicitation to buy or sell any security. Neither TheStreet Ratings nor any other party guarantees its accuracy
or makes warranties regarding results from its usage. Redistribution is prohibited without the express written consent of TheStreet Ratings. Copyright(c) 2006-2015. All rights reserved.
Report Date: February 1, 2015
PAGE 5

© Copyright 2026