
CELGENE CORP - TheStreet.com
February 1, 2015
NASDAQ: CELG
CELGENE CORP
BUY
A+
A
A-
HOLD
B+
B
Annual Dividend Rate
NA
B-
C+
C
Annual Dividend Yield
NA
SELL
C-
D+
Beta
1.10
Sector: Health Care
CELG BUSINESS DESCRIPTION
Celgene Corporation, a biopharmaceutical
company, discovers, develops, and commercializes
therapies to treat cancer and immune-inflammatory
related diseases in the United States and
internationally.
STOCK PERFORMANCE (%)
3 Mo.
Price Change
14.96
D
D-
E+
E
E-
F
BUY
Market Capitalization
$96.5 Billion
Sub-Industry: Biotechnology
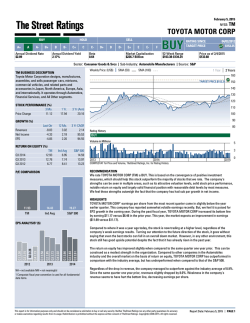
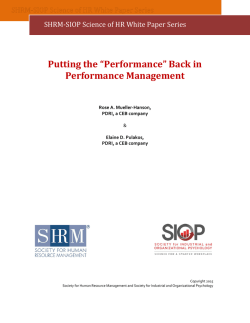
Weekly Price: (US$)
SMA (50)
52-Week Range
$66.85-$124.60
RATING SINCE
TARGET PRICE
04/29/2011
$158.64
Price as of 1/29/2015
$120.87
Source: S&P
SMA (100)
1 Year
2 Years
160
TARGET
TARGET
TARGETPRICE
PRICE
PRICE$158.64
$158.64
$158.64
TARGET
140
120
100
1 Yr.
52.55
3 Yr (Ann)
48.80
Last Qtr
18.77
186.33
196.00
12 Mo.
18.11
37.93
42.43
3 Yr CAGR
16.57
14.91
18.98
RETURN ON EQUITY (%)
CELG
Q4 2014
30.65
Q4 2013
25.93
Q4 2012
25.57
Ind Avg
21.71
19.68
0.12
S&P 500
14.59
13.97
13.23
80
GROWTH (%)
60
Revenues
Net Income
EPS
40
Rating History
BUY
Volume in Millions
50
25
2013
2014
2015
0
COMPUSTAT for Price and Volume, TheStreet Ratings, Inc. for Rating History
P/E COMPARISON
RECOMMENDATION
We rate CELGENE CORP (CELG) a BUY. This is based on the convergence of positive investment measures,
which should help this stock outperform the majority of stocks that we rate. The company's strengths can be
seen in multiple areas, such as its solid stock price performance, impressive record of earnings per share
growth, compelling growth in net income, robust revenue growth and notable return on equity. We feel these
strengths outweigh the fact that the company has had generally high debt management risk by most
measures that we evaluated.
50.36
79.56
19.08
CELG
Ind Avg
S&P 500
HIGHLIGHTS
Powered by its strong earnings growth of 196.00% and other important driving factors, this stock has surged
by 52.55% over the past year, outperforming the rise in the S&P 500 Index during the same period. Turning to
the future, naturally, any stock can fall in a major bear market. However, in almost any other environment, the
stock should continue to move higher despite the fact that it has already enjoyed nice gains in the past year.
EPS ANALYSIS¹ ($)
2012
2013
Q4 0.74
Q3 0.61
Q2 0.72
Q1 0.33
Q3 0.44
Q2 0.56
Q1 0.45
Q4 0.31
Q3 0.49
Q2 0.41
Q1 0.45
Q4 0.25
CELGENE CORP reported significant earnings per share improvement in the most recent quarter compared to
the same quarter a year ago. The company has demonstrated a pattern of positive earnings per share growth
over the past two years. We feel that this trend should continue. During the past fiscal year, CELGENE CORP
increased its bottom line by earning $2.40 versus $1.69 in the prior year. This year, the market expects an
improvement in earnings ($4.83 versus $2.40).
2014
NA = not available NM = not meaningful
1 Compustat fiscal year convention is used for all fundamental
data items.
The net income growth from the same quarter one year ago has significantly exceeded that of the S&P 500
and the Biotechnology industry. The net income increased by 186.3% when compared to the same quarter
one year prior, rising from $214.40 million to $613.90 million.
CELG's revenue growth trails the industry average of 41.2%. Since the same quarter one year prior, revenues
rose by 18.8%. Growth in the company's revenue appears to have helped boost the earnings per share.
The return on equity has improved slightly when compared to the same quarter one year prior. This can be
construed as a modest strength in the organization. When compared to other companies in the Biotechnology
industry and the overall market, CELGENE CORP's return on equity exceeds that of the industry average and
significantly exceeds that of the S&P 500.
This report is for information purposes only and should not be considered a solicitation to buy or sell any security. Neither TheStreet Ratings nor any other party guarantees its accuracy
or makes warranties regarding results from its usage. Redistribution is prohibited without the express written consent of TheStreet Ratings. Copyright(c) 2006-2015. All rights reserved.
Report Date: February 1, 2015
PAGE 1
February 1, 2015
NASDAQ: CELG
CELGENE CORP
Sector: Health Care Biotechnology Source: S&P
Annual Dividend Rate
NA
Annual Dividend Yield
NA
PEER GROUP ANALYSIS
V
FA
350%
AB
OR
INCY
R
VO
FA
LE
AB
-100%
UN
Revenue Growth (TTM)
LE
REGN
-30%
52-Week Range
$66.85-$124.60
Price as of 1/29/2015
$120.87
Medical spending is expected to grow significantly in the coming quarters due to an aging population,
increasing obesity and demand for quality treatment. Healthcare service providers have shown a willingness
to incur higher costs to treat diseases and this supports margin expansion for successful treatments. US
healthcare spending for the next decade is expected to be around $4.2 trillion or 20% of GDP.
GILD
BMRN
Market Capitalization
$96.5 Billion
INDUSTRY ANALYSIS
The biotechnology industry employs biological and biochemical knowledge to develop, manufacture and
trade products and processes for the diagnosis and treatment of diseases and ailments. It also develops
genetically modified plant and animal species and food varieties. The industry has a noncyclical growth
profile, which is insensitive to overall economic conditions. The industry focuses on specialty markets with
primary sales and efforts targeted towards specialists such as hematologists, oncology physicians,
rheumatologists and dermatologists. Consequently, the industry is highly reliant on research and
development (R&D). US biotech companies dominating the market include larger players like Amgen (AMGN),
Gilead (GILD) and Biogen (BIIB).
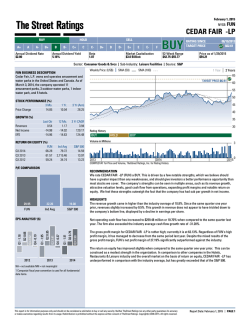
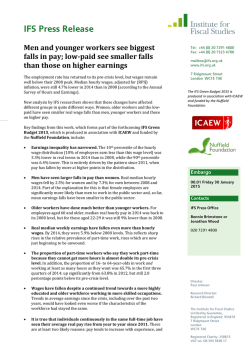
REVENUE GROWTH AND EBITDA MARGIN*
PCYC
Beta
1.10
70%
The biotechnology pipeline has become an important consideration for the pharmaceutical industry and its
suppliers. The industry has witnessed an increase in financing and multi-billion-dollar mergers and
acquisitions. R&D spending remains robust. The US continues to dominate in R&D spending, with
approximately 81 cents of global expenditures being domestic.
EBITDA Margin (TTM)
Companies with higher EBITDA margins and
revenue growth rates are outperforming companies
with lower EBITDA margins and revenue growth
rates. Companies for this scatter plot have a market
capitalization between $12.7 Billion and $157.2
Billion. Companies with NA or NM values do not
appear.
*EBITDA – Earnings Before Interest, Taxes, Depreciation and
Amortization.
PEER GROUP: Biotechnology
350%
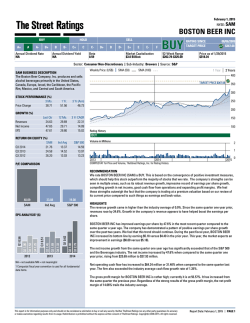
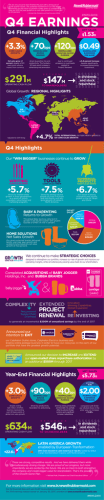
REVENUE GROWTH AND EARNINGS YIELD
V
FA
PCYC
AB
OR
R
VO
FA
VRTX
INCY
REGN
ALXN BIIB
CELG AMGN GRFS
LE
AB
-100%
UN
Revenue Growth (TTM)
LE
GILD
BMRN
-3%
An average drug takes about 10 to 15 years from pre-clinical development to market approval. According to
the FDA, for every 20 drugs that enter the clinical testing stage, only a few pass trial and gain approval. The
traditional sales and profit metrics do not completely reveal the biotech companies’ otherwise lengthy,
cost-intensive product-development periods. It is essential for investors to consider the number of products
the biotech companies have in their pipeline, the time necessary for development and the potential market
size of drugs. Patents held, effectiveness of these patents to protect market share, cash position, and current
leverage position all impact biotech company outlook. Finally, R&D effectiveness, management competency
and potential synergies from new or proposed M&A activities are important factors for investors to consider.
6%
Ticker
CELG
BIIB
REGN
ALXN
VRTX
GILD
BMRN
INCY
GRFS
PCYC
AMGN
Recent
Company Name
Price ($)
CELGENE CORP
120.87
BIOGEN IDEC INC
353.25
REGENERON PHARMACEUTICALS 414.64
ALEXION PHARMACEUTICALS IN 188.05
VERTEX PHARMACEUTICALS INC 114.14
GILEAD SCIENCES INC
104.18
BIOMARIN PHARMACEUTICAL INC 99.65
INCYTE CORP
81.34
GRIFOLS SA
34.61
PHARMACYCLICS INC
167.47
AMGEN INC
156.37
Market
Cap ($M)
96,539
83,422
41,336
37,288
27,595
157,173
15,666
13,742
13,520
12,651
118,841
Price/
Earnings
50.36
28.51
140.08
57.68
NM
18.37
NM
NM
22.19
153.64
23.34
Net Sales
TTM ($M)
7,670.40
9,703.32
2,627.64
2,233.73
580.42
20,695.56
667.06
484.59
4,086.63
563.09
20,063.00
Net Income
TTM ($M)
1,999.90
2,934.78
334.70
656.91
-738.56
9,405.69
-126.16
-54.41
542.77
86.88
5,158.00
The peer group comparison is based on Major Biotechnology companies of comparable size.
Earnings Yield (TTM)
Companies that exhibit both a high earnings yield
and high revenue growth are generally more
attractive than companies with low revenue growth
and low earnings yield. Companies for this scatter
plot have revenue growth rates between -52.1% and
305.9%. Companies with NA or NM values do not
appear.
This report is for information purposes only and should not be considered a solicitation to buy or sell any security. Neither TheStreet Ratings nor any other party guarantees its accuracy
or makes warranties regarding results from its usage. Redistribution is prohibited without the express written consent of TheStreet Ratings. Copyright(c) 2006-2015. All rights reserved.
Report Date: February 1, 2015
PAGE 2
February 1, 2015
NASDAQ: CELG
CELGENE CORP
Sector: Health Care Biotechnology Source: S&P
Annual Dividend Rate
NA
Annual Dividend Yield
NA
Beta
1.10
Market Capitalization
$96.5 Billion
52-Week Range
$66.85-$124.60
Price as of 1/29/2015
$120.87
COMPANY DESCRIPTION
Celgene Corporation, a biopharmaceutical company,
discovers, develops, and commercializes therapies to
treat cancer and immune-inflammatory related diseases
in the United States and internationally. The company's
commercial stage products include REVLIMID, an oral
immunomodulatory drug for the treatment of multiple
myeloma, myelodysplastic syndromes (MDS), and mantle
cell lymphoma; VIDAZA, a pyrimidine nucleoside analog
to treat intermediate-2 and high-risk MDS, and chronic
myelomonocytic leukemia, as well as acute myeloid
leukemia (AML); ABRAXANE, a solvent-free
chemotherapy product for the treatment of breast,
non-small cell lung, pancreatic, and gastric cancers; and
POMALYST/IMNOVID for the treatment of multiple
myeloma. Its commercial stage products also comprise
THALOMID for the patients with multiple myeloma and
for the acute treatment of the cutaneous manifestations
of erythema nodosum leprosum; ISTODAX to treat
cutaneous T-cell lymphoma; and FOCALIN, FOCALIN XR,
and RITALIN LA products. The company's pre clinical and
clinical stage products consist of OTEZLA for the
treatment of psoriatic arthritis, psoriasis, and ankylosing
spondylitis; CC-122 and CC-220 to treat hematological
and solid tumor cancers; cellular therapies, such as
PDA-001 and PDA-002 for Crohn's and peripheral arterial
diseases; CC-486, to treat MDS, AML, and solid tumors;
Sotatercept and ACE-536 for the treatment of anemia in
patients with rare blood disorders; CC-223 and CC-115
for lymphomas, hepatocellular, and prostate cancers; and
CC-292 for the treatment of chronic lymphocytic
leukemia and lymphomas. It has strategic drug discovery
collaboration with Abide Therapeutics to enhance the
treatment paradigm for patients with immune disorders;
strategic collaboration with Sutro Biopharma, Inc. to
discover and develop antibodies and antibody drug
conjugates; and strategic alliance with Forma
Therapeutics. Celgene Corporation was founded in 1980
and is headquartered in Summit, New Jersey.
STOCK-AT-A-GLANCE
Below is a summary of the major fundamental and technical factors we consider when determining our
overall recommendation of CELG shares. It is provided in order to give you a deeper understanding of our
rating methodology as well as to paint a more complete picture of a stock's strengths and weaknesses. It is
important to note, however, that these factors only tell part of the story. To gain an even more comprehensive
understanding of our stance on the stock, these factors must be assessed in combination with the stock’s
valuation. Please refer to our Valuation section on page 5 for further information.
CELGENE CORP
86 Morris Avenue
Summit, NJ 07901
USA
Phone: 908-673-9000
Fax: 908-673-9001
http://www.celgene.com
THESTREET RATINGS RESEARCH METHODOLOGY
FACTOR
SCORE
5.0
Growth
out of 5 stars
weak
Measures the growth of both the company's income statement and
cash flow. On this factor, CELG has a growth score better than 90% of
the stocks we rate.
strong
5.0
Total Return
out of 5 stars
weak
Measures the historical price movement of the stock. The stock
performance of this company has beaten 90% of the companies we
cover.
strong
5.0
Efficiency
out of 5 stars
weak
Measures the strength and historic growth of a company's return on
invested capital. The company has generated more income per dollar of
capital than 90% of the companies we review.
strong
4.5
Price volatility
out of 5 stars
weak
Measures the volatility of the company's stock price historically. The
stock is less volatile than 80% of the stocks we monitor.
strong
5.0
Solvency
out of 5 stars
weak
Measures the solvency of the company based on several ratios. The
company is more solvent than 90% of the companies we analyze.
strong
0.5
Income
out of 5 stars
weak
Measures dividend yield and payouts to shareholders. This company
pays no dividends.
strong
TheStreet Ratings' stock model projects a stock's total return potential over a 12-month period including both
price appreciation and dividends. Our Buy, Hold or Sell ratings designate how we expect these stocks to
perform against a general benchmark of the equities market and interest rates. While our model is
quantitative, it utilizes both subjective and objective elements. For instance, subjective elements include
expected equities market returns, future interest rates, implied industry outlook and forecasted company
earnings. Objective elements include volatility of past operating revenues, financial strength, and company
cash flows.
Our model gauges the relationship between risk and reward in several ways, including: the pricing drawdown
as compared to potential profit volatility, i.e.how much one is willing to risk in order to earn profits; the level of
acceptable volatility for highly performing stocks; the current valuation as compared to projected earnings
growth; and the financial strength of the underlying company as compared to its stock's valuation as
compared to projected earnings growth; and the financial strength of the underlying company as compared
to its stock's performance. These and many more derived observations are then combined, ranked, weighted,
and scenario-tested to create a more complete analysis. The result is a systematic and disciplined method of
selecting stocks.
This report is for information purposes only and should not be considered a solicitation to buy or sell any security. Neither TheStreet Ratings nor any other party guarantees its accuracy
or makes warranties regarding results from its usage. Redistribution is prohibited without the express written consent of TheStreet Ratings. Copyright(c) 2006-2015. All rights reserved.
Report Date: February 1, 2015
PAGE 3
February 1, 2015
NASDAQ: CELG
CELGENE CORP
Sector: Health Care Biotechnology Source: S&P
Annual Dividend Rate
NA
Annual Dividend Yield
NA
Consensus EPS Estimates² ($)
IBES consensus estimates are provided by Thomson Financial
Market Capitalization
$96.5 Billion
52-Week Range
$66.85-$124.60
Price as of 1/29/2015
$120.87
FINANCIAL ANALYSIS
CELGENE CORP's gross profit margin for the fourth quarter of its fiscal year 2014 is essentially unchanged
when compared to the same period a year ago. The company has grown its sales and net income during the
past quarter when compared with the same quarter a year ago, and although its growth in net income has
outpaced the industry average, its revenue growth has not.
During the same period, stockholders' equity ("net worth") has increased by 16.72% from the same quarter last
year.
1.05
Q1 FY15
Beta
1.10
4.83 E
6.21 E
2015(E)
2016(E)
STOCKS TO BUY: TheStreet Quant Ratings has identified a handful of stocks that can potentially TRIPLE in the
next 12-months. To learn more visit www.TheStreetRatings.com.
INCOME STATEMENT
Net Sales ($mil)
EBITDA ($mil)
EBIT ($mil)
Net Income ($mil)
Q4 FY14
2,085.50
NA
789.40
613.90
Q4 FY13
1,755.90
511.10
417.50
214.40
Q4 FY14
7,546.70
17,340.10
6,871.60
6,524.80
Q4 FY13
5,687.00
13,378.20
4,741.30
5,589.90
Q4 FY14
92.00%
NA
37.85%
0.44
11.53%
30.65%
Q4 FY13
96.30%
29.10%
23.78%
0.49
10.83%
25.93%
Q4 FY14
NA
0.51
51.70
15.27
Q4 FY13
3.88
0.46
30.10
13.87
Q4 FY14
800
0.00
0.74
8.16
NA
5,130,265
Q4 FY13
819
0.00
0.25
6.82
NA
4,805,477
BALANCE SHEET
Cash & Equiv. ($mil)
Total Assets ($mil)
Total Debt ($mil)
Equity ($mil)
PROFITABILITY
Gross Profit Margin
EBITDA Margin
Operating Margin
Sales Turnover
Return on Assets
Return on Equity
DEBT
Current Ratio
Debt/Capital
Interest Expense
Interest Coverage
SHARE DATA
Shares outstanding (mil)
Div / share
EPS
Book value / share
Institutional Own %
Avg Daily Volume
2 Sum of quarterly figures may not match annual estimates due to
use of median consensus estimates.
This report is for information purposes only and should not be considered a solicitation to buy or sell any security. Neither TheStreet Ratings nor any other party guarantees its accuracy
or makes warranties regarding results from its usage. Redistribution is prohibited without the express written consent of TheStreet Ratings. Copyright(c) 2006-2015. All rights reserved.
Report Date: February 1, 2015
PAGE 4
February 1, 2015
NASDAQ: CELG
CELGENE CORP
Sector: Health Care Biotechnology Source: S&P
Annual Dividend Rate
NA
Annual Dividend Yield
NA
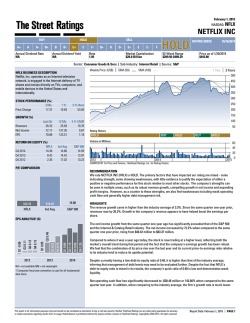
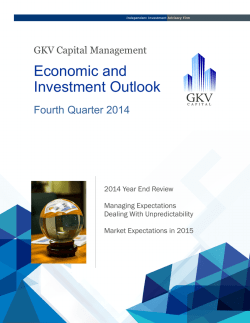
RATINGS HISTORY
Our rating for CELGENE CORP has not changed
since 4/29/2011. As of 1/29/2015, the stock was
trading at a price of $120.87 which is 3.0% below its
52-week high of $124.60 and 80.8% above its
52-week low of $66.85.
2 Year Chart
Beta
1.10
BUY: $49.60
$125
Price/Earnings
$75
$50
2014
MOST RECENT RATINGS CHANGES
Date
Price
Action
1/29/13
$49.60 No Change
1
2
3
premium
Price reflects the closing price as of the date listed, if available
RATINGS DEFINITIONS &
DISTRIBUTION OF THESTREET RATINGS
(as of 1/29/2015)
1
2
3
29.29% Hold - We do not believe this stock offers
conclusive evidence to warrant the purchase or sale of
shares at this time and that its likelihood of positive total
return is roughly in balance with the risk of loss.
22.83% Sell - We believe that this stock is likely to
decline by more than 10% over the next 12 months, with
the risk involved too great to compensate for any
possible returns.
TheStreet Ratings
14 Wall Street, 15th Floor
New York, NY 10005
www.thestreet.com
Research Contact: 212-321-5381
Sales Contact: 866-321-8726
5
4
5
CELG 19.46
Peers 27.85
• Discount. A lower price-to-projected earnings ratio
than its peers can signify a less expensive stock or
lower future growth expectations.
• CELG is trading at a discount to its peers.
Price/Book
1
2
3
4
5
1
2
premium
3
4
5
3
4
5
discount
CELG NA
Peers 30.14
• Neutral. The P/CF ratio is the stock’s price divided
by the sum of the company's cash flow from
operations. It is useful for comparing companies
with different capital requirements or financing
structures.
• Ratio not available.
Price to Earnings/Growth
1
2
3
premium
4
5
discount
CELG 1.16
Peers 0.70
• Premium. The PEG ratio is the stock’s P/E divided by
the consensus estimate of long-term earnings
growth. Faster growth can justify higher price
multiples.
• CELG trades at a significant premium to its peers.
Earnings Growth
1
2
3
4
lower
5
higher
CELG 42.43
Peers 44.37
• Average. Elevated earnings growth rates can lead
to capital appreciation and justify higher
price-to-earnings ratios.
• CELG is expected to keep pace with its peers on the
basis of earnings growth.
Sales Growth
discount
CELG 12.61
Peers 194.39
• Discount. In the absence of P/E and P/B multiples,
the price-to-sales ratio can display the value
investors are placing on each dollar of sales.
• CELG is trading at a significant discount to its
industry on this measurement.
2
premium
discount
CELG 14.82
Peers 12.21
• Premium. A higher price-to-book ratio makes a
stock less attractive to investors seeking stocks
with lower market values per dollar of equity on the
balance sheet.
• CELG is trading at a premium to its peers.
Price/Sales
1
Price/CashFlow
discount
premium
47.87% Buy - We believe that this stock has the
opportunity to appreciate and produce a total return of
more than 10% over the next 12 months.
Price as of 1/29/2015
$120.87
discount
premium
To
Buy
4
CELG 50.36
Peers 79.56
• Discount. A lower P/E ratio than its peers can
signify a less expensive stock or lower growth
expectations.
• CELG is trading at a significant discount to its
peers.
Price/Projected Earnings
From
Buy
52-Week Range
$66.85-$124.60
VALUATION
BUY. The current P/E ratio indicates a significant discount compared to an average of 79.56 for the
Biotechnology industry and a significant premium compared to the S&P 500 average of 19.08. For additional
comparison, its price-to-book ratio of 14.82 indicates a significant premium versus the S&P 500 average of
2.69 and a significant premium versus the industry average of 12.21. The price-to-sales ratio is well above the
S&P 500 average, but well below the industry average. The valuation analysis reveals that, CELGENE CORP
seems to be trading at a discount to investment alternatives within the industry.
$100
2013
Market Capitalization
$96.5 Billion
1
2
3
lower
4
5
higher
CELG 18.11
Peers 73.15
• Lower. A sales growth rate that trails the industry
implies that a company is losing market share.
• CELG significantly trails its peers on the basis of
sales growth
DISCLAIMER:
The opinions and information contained herein have been obtained or derived from sources believed to be reliable, but
TheStreet Ratings cannot guarantee its accuracy and completeness, and that of the opinions based thereon. Data is provided
via the COMPUSTAT® Xpressfeed product from Standard &Poor's, a division of The McGraw-Hill Companies, Inc., as well as
other third-party data providers.
TheStreet Ratings is a division of TheStreet, Inc., which is a publisher. This research report contains opinions and is provided
for informational purposes only. You should not rely solely upon the research herein for purposes of transacting securities or
other investments, and you are encouraged to conduct your own research and due diligence, and to seek the advice of a
qualified securities professional, before you make any investment. None of the information contained in this report constitutes,
or is intended to constitute a recommendation by TheStreet Ratings of any particular security or trading strategy or a
determination by TheStreet Ratings that any security or trading strategy is suitable for any specific person. To the extent any of
the information contained herein may be deemed to be investment advice, such information is impersonal and not tailored to the
investment needs of any specific person. Your use of this report is governed by TheStreet, Inc.'s Terms of Use found at
http://www.thestreet.com/static/about/terms-of-use.html.
This report is for information purposes only and should not be considered a solicitation to buy or sell any security. Neither TheStreet Ratings nor any other party guarantees its accuracy
or makes warranties regarding results from its usage. Redistribution is prohibited without the express written consent of TheStreet Ratings. Copyright(c) 2006-2015. All rights reserved.
Report Date: February 1, 2015
PAGE 5
© Copyright 2026