
Focus - BMO Nesbitt Burns
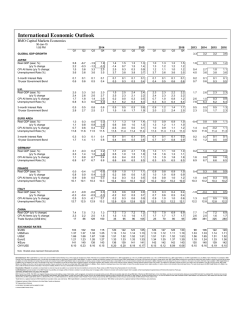
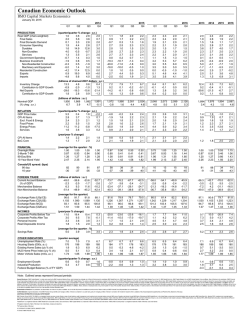
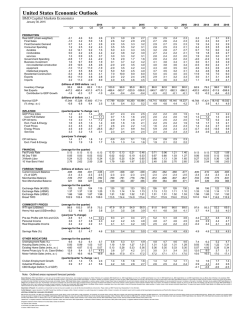
Douglas Porter, CFA, Chief Economist, BMO Financial Group January 30, 2015 Feature Article Page 6 Oil and the Economy in Nine Charts U.S. Real GDP Slows (Q4) — but Consumer Spending Jumps the Most in 8 Years Loonie Can’t Fly… Falls to 78 Cents (US) More Central Banks Ease… Russia, Denmark, Singapore New Zealand Turns Dovish Greece’s New PM to Meet Eurogroup Chair BMO Capital Markets Economics www.bmocm.com/economics 1-800-613-0205 Please refer to page 15 for important disclosures Our Thoughts Page 2 of 15 Focus — January 30, 2015 The January Defect L ast week’s tirade concluded with the wistful hope that our 2015 target for the loonie wouldn’t be breached within the next week. Wishful thinking. After plunging 3.6% last week on the Bank of Canada’s shock rate cut, the beleaguered loonie tumbled almost another 3% this week to 78.3 cents by Friday morning (or $1.278/US$) before bouncing. Simply put, the currency just cannot catch a break so far in 2015, falling a cannonading 9% already this year. To put that into perspective, there has only been one year when the Canadian dollar has dropped by more than 9% (2008), let alone a month. The currency has been walloped by a series of unfortunate events, both external (strong US$, weak oil prices) and domestic. In fact, here is a list of the economic news that has faced Canadians just since the start of the year (and I won’t fall back on that tired cliché of a Top 10 list): Oil prices collapse further, and now threaten Alberta with recession. In turn, Ottawa delays the timing of this year’s budget. As well, the Bank of Canada responds with a shock interest rate cut. In response, the Canadian dollar falls out of bed, down 9% in a month. Accordingly, bond yields plunge to record lows of 1.3% for 10-years. And, layoffs sweep through the energy sector, with unrelated industries piling on with job cuts (including Tim Hortons). Target piles on, abruptly deciding to leave Canada and its 17,000 employees. This follows job losses in the final two months of 2014… and then StatsCan knocks another 64,000 jobs off last year’s gain in a significant revision. And, real GDP drops 0.2% in November, dragged down by manufacturing, the sector that was supposed to benefit from the weak C$ and lower energy prices. Playing their part, the Leafs score about 2 goals in an 8-game losing skid. Now take a deep breath. Yes, that is a very ugly list of events; and, understandably, this has cast some serious doubts on the Canadian outlook for 2015. However, many items on that list are not clear-cut negatives for growth, and many carry important offsets. The budget delay was a direct response to a major shift in a key variable (oil), while the rate cut and the drop in bond yields (and even the drop in the C$) could support growth. Even with another trim, we are still looking for 2% GDP growth this year, with a tailwind from an improving U.S. economy (on track for 3% growth) partly countering the oil drag. We would also make the point that—and contrary to media reports—a falling currency does not necessarily equal economic doom. True, the limping loonie is making southbound travel suddenly much more expensive, and will also put some serious upward pressure on core inflation. But, the currency also acts as a buffer against big changes in the price of Canada’s exports, and it is responding about in line with the steep fall in oil, copper and iron ore. Finally, note that, despite the list of unfortunate news, the TSX is about flat so far in 2015. It’s a funny old world when we are looking to equities to be the calm voice of reason in turbulent times. Douglas Porter, CFA Chief Economist [email protected] 416-359-4887 Our Thoughts Page 3 of 15 Focus — January 30, 2015 Fed Will Remain Patient Longer as Inflation Trumps Growth T he U.S. economy slowed somewhat late last year amid cooler investment and exports, but it’s still in decent shape now that consumers have grabbed the spending baton from businesses. GDP growth downshifted to 2.6% in Q4, as expected, due to a retracement of surging defense spending and falling imports the previous quarter. After a show of strength, business spending slowed, likely in response to collapsing energy capex and supply disruptions stemming from congestion at the West Coast ports. Disappointing factory orders suggest investment will weaken further in Q1. Exports also slowed due to the strong dollar and weak global demand. While residential construction strengthened in Q4, recent housing indicators are mixed. New home sales leaped 12% in December and mortgage applications have sprinted higher recently, but resale transactions fell 3.7% in December and the homeownership rate plumbed two-decade lows. Clearly, the wounds from the housing bust run deep, with record-low mortgage rates acting only as a partial salve. Sal Guatieri Senior Economist [email protected] 416-359-5295 Thus, a lot is riding on the backs of consumers; and, thankfully, they didn’t disappoint last quarter, spending at the fastest clip in eight years (4.3%). Strong job growth and big fuel savings helped, and explain why consumer confidence hit 10-year highs in January. As well, new jobless claims hit 15-year lows. Overall, with consumers in better financial shape, the economy should grow near 3% this year, its average rate of the past 1½ years, despite the strong dollar and downturn in energy capex. However, we did trim our Q1 growth estimate to 2.3% after the soft factory orders report. We also lowered our outlook for core inflation a few notches due to the soaring greenback and some pass-through of lower energy costs. The trade-weighted dollar’s 10% y/y rise will restrain import costs, while the impact of lower oil prices on transportation and supply costs could shave about 0.5%. In fact, in the past six months core inflation has risen at the slowest annual rate in four years (1.1%). We now expect it to fall from 1.6% in December to 1.3% in the spring, before edging higher later in the year as wage growth picks up in response to falling unemployment. Lower core inflation means that “solid” economic growth and “strong” employment, as depicted in the FOMC’s statement, won’t test the Fed’s patience for a while. Accordingly, we pushed out our call on rate liftoff from June to September. The risks remain toward a further delay if the dollar rises sharply further, equities sag, or a political showdown over Keystone, the budget or the debt ceiling leads to a government shutdown this year. Central Bank Rate Cuts Drive Currency Wars A nother week passes, and yet more central banks cut rates. This week it was Russia (in the midst of a crisis) and Denmark (struggling to maintain a currency peg). The Reserve Bank of New Zealand was the outlier, holding rates steady, though it warned that policy will likely be unchanged for longer than previously expected—the next step of course is rate cuts. The Reserve Bank of Australia is up next week, along with the Bank of England, and neither is expected to move. But, the risk for the former is tilted toward easing, while the latter will likely talk down the potential for eventual hikes. This comes after January brought a Bank of Canada rate cut and ECB QE. Benjamin Reitzes Senior Economist [email protected] 416-359-5628 Our Thoughts Page 4 of 15 Focus — January 30, 2015 The common theme here is easier monetary policy, as central bankers scratch and claw for any modicum of growth. The unsurprising consequence of all this easing is a weakening currency, which is a potentially easy avenue to export growth. Unfortunately, when everyone is playing the same game, beggar-thy-neighbour currency depreciation doesn’t work so well. The Fed is the only major central bank that seems to be headed in the opposite direction, and the greenback is surging. The seismic shift in currencies will benefit America’s trading partners, as U.S. consumers suck in imports. Canada should be one of the main beneficiaries. While the Canadian dollar has plummeted nearly 20% since the start of Governor Poloz’s reign, the Bank of Canada is poised to weaken the currency further by cutting policy rates further. Sentiment is now so globally negative on Canada, it won’t take much for continued hammering of the loonie. Perhaps it’s time to ask Governor Poloz: how weak is weak enough for the C$? Much of the loonie’s drop is attributable to the plunge in energy prices, which is how the currency acts as a shock absorber for the economy. Whether the BoC needs to grease the currency’s slide with lower rates is questionable, especially given already highly leveraged households suggest rate cuts will have only a marginal impact. These misgivings likely won’t keep the BoC from easing again in March, pointing to lower yields and an even lower loonie. Stronger Dollar Clips Earnings Growth O ne glaring nugget in the U.S. GDP report was that net exports carved a full percentage point from growth in Q4, and cut into activity in three of four quarters in 2014. Real exports managed to grind 2.0% y/y higher last year, but import volumes jumped a much stronger 5.3% alongside the surging U.S. dollar. The strong currency also weighed on Q4 earnings. According to Bloomberg’s tally, consensus expectations are now for S&P 500 earnings to rise 5.5% y/y in the latest three-month reporting period, down from a 9% pace in the prior three months. Revenue growth is also on track to be cut in half to just 2.2% y/y. True, oil & gas has sapped earnings momentum, with profits in the sector down 17% y/y, while financial-sector earnings have also weakened. But, the momentum loss extends to sectors with exposure to overseas sales. Consumer goods are now likely to see earnings fall almost 5% y/y after posting near-3% growth in the prior period, as revenues dip. For example, Colgate-Palmolive cut its earnings guidance in part due to the dollar, while Procter & Gamble spoke of “unprecedented currency devaluations” in foreign markets—it no longer expects any sales growth this year. Meantime, some technology and health care bellwethers, such as Microsoft and Pfizer, also appeared to catch the dollar bug in their latest quarter. A few quick takeaways: First, the latest results and tone from the corporate sector tend to confirm what the economic data are saying—the surging U.S. dollar is going to be a drag on economic growth in the year ahead. However, for equity investors, earnings expectations are coming down quickly, which means the bar for future quarters is already that much lower, and we remain very optimistic on the performance of the domestic U.S. economy. Robert Kavcic Senior Economist [email protected] 416-359-8329 Recap Page 5 of 15 Focus — January 30, 2015 Jennifer Lee Senior Economist [email protected] 416-359-4092 Canada Good News Ottawa’s Budget Deficit narrowed to $3.3 bln (Apr.to-Nov.)—from $13.4 bln a year ago Real GDP at Basic Prices -0.2% (Nov.) Employment -11,300 (Dec. R)—and downward revisions to all of 2014 Conference Board’s Consumer Confidence Index +9.8 pts to 102.9 (Jan.)—highest since August 2007 S&P Case Shiller Home Price Index +0.7% (Nov.) New Home Sales +11.6% to 481,000 a.r. (Dec.) Initial Claims -43k to 265k (Jan. 24 week) Chicago PMI +0.6 pts to 59.4 (Jan.) Real GDP slowed to +2.6% a.r. (Q4 A) Durable Goods Orders -3.4% (Dec.) Pending Home Sales -3.7% (Dec.) Employment Cost Index +0.6% (Q4)—wages & salaries slowed Trade Deficit narrowed to ¥661 bln (Dec.)—exports jumped +12.9% y/y Jobless Rate –0.1 ppts to 3.4% (Dec.) Industrial Production +1.0% (Dec. P) Retail Sales -0.3% (Dec.) Household Spending -3.4% y/y (Dec.) Core Consumer Prices slowed to +2.5% y/y (Dec.) Eurozone—Private Sector Credit -1.6% y/y (Dec.) —improving Eurozone—Economic Confidence +0.6 pts to 101.2 (Jan.) Eurozone—Jobless Rate -0.1 ppts to 11.4% (Dec.) Germany—Ifo Survey +1.2 pts to 106.7 (Jan.) Germany—Unemployment -9,000 (Jan.) Germany—Real Retail Sales +0.2% (Dec.) Germany—GfK Consumer Confidence +0.3 pts to 9.3 (Feb.) France—Consumer Spending +1.5% (Dec.) Italy—Jobless Rate -0.4 ppts to 12.9% (Dec. P) U.K.—GfK Consumer Confidence +5 pts to +1 (Jan.) U.K.—Nationwide House Prices +0.3% (Jan.) Eurozone—Consumer Prices -0.6% y/y (Jan. P) Germany—Consumer Prices -0.5% y/y (Jan. P) Germany—Producer Prices -0.7% (Dec.) France— Jobless Rate flat at 10.3% (Dec.) Italy—Industrial Orders -1.1% (Nov.) U.K.—Real GDP slowed to +2.7% y/y (Q4) Australia—NAB Business Confidence +1 pt to 2 (Dec.) Australia—Core Consumer Prices +2.2% y/y (Q4) India—Real GDP revised sharply higher to 6.9% (2013/2014)—new methodology Australia—Producer Prices +1.1% y/y (Q4)—slowed S&P downgrades Russia to BBB- (junk) BMO trims 2015 GDP call to 2.0% as the downbeat news continues Loonie tumbles to 78 cents (US)—first time since 2009 United States FOMC “patient”, sees “solid” pace of expansion, but watching “international developments” Weekly crude inventories @ 80-year highs weigh on oil Labour dispute at West Coast ports… verge of settlement Japan Government may start watching GDP deflator to gauge inflation Europe Encouraging trend in Euro Area private sector lending… but deflation deepens Greece’s Syriza Party wins election; some of their inexperienced views earn the country a downgrade warning from S&P Other China to lower 2015 growth target to around 7% RBNZ on hold, turns dovish Singapore eases by slowing pace of SGD’s appreciation Russia cuts rates to 15% Bad News Indications of stronger growth and a move toward price stability are good news for the economy. Feature Page 6 of 15 Oil and the Economy in Nine Charts Douglas Porter, CFA, Chief Economist • [email protected] • 416-359-4887 Robert Kavcic, Senior Economist • [email protected] • 416-359-8329 The plunge in oil prices of more than 55% in just over six months is the third deepest correction in such a short period of time in the past 45 years. Focus — January 30, 2015 Chart 1 Crude Prices Collapse (US$/bbl) Crude Oil — WTI 40-year average price in today’s dollars: US$57 forecast 2 160 120 Our economic forecast now assumes that prices will remain on the defensive through the first half of this year and average just $52 (WTI) in 2015. While we see a partial rebound next year, our working assumption has been trimmed to $65 for 2016. 80 Real 1 40 These levels compare with an average price of $57 over the past 40 years, measured in today’s dollars. Nominal 0 70 75 80 85 90 95 00 05 10 15 ¹ January 2015 US$ ² [nominal] half-year averages While a variety of factors have conspired to undercut prices, including a roaring U.S. dollar, the dominant factor has been on the supply side. Chart 2 Global Oil Production: Gathering Speed Crude Oil (mmbpd) Supply Global supply rose by 2.0% last year, above the long-run average growth rate of 1.6%. Average growth =1.6%/yr 100 Notable gains have come from the U.S. (again the world’s largest producer), Canada (now the fourth largest) and Iraq (reaching record levels of 4 million bpd by December). 80 Other 60 Fully 8 of the top 10 producers are now reporting output well above their own 20-year trend. Only Iran and Mexico have seen production declines. 40 U.S. 20 Russia Canada OPEC forecast 0 93 1 Softer-than-expected global growth has also played a role in oil’s weakness. Even with global GDP growth of just over 3% in 2014 (similar to what is expected in 2015), oil demand only rose 0.8%. 00 07 includes products 14 Top Producers ¹ US Russia Saudi Arabia Canada China Iraq Iran UAE Kuwait Mexico 2014 11.7 10.4 9.7 4.3 4.1 3.3 2.8 2.8 2.8 2.8 19932013 Average 8.1 8.2 7.8 3.0 3.5 1.8 3.3 2.1 2.1 3.3 Global 2014 93.2 +2.0% Source: International Energy Agency Chart 3 Global Oil Demand: Losing Momentum Crude Oil (mmbpd) Top Consumers Demand That divergence between 2% supply growth and 0.8% demand growth swung the overall oil market from a balanced (or even tight) market a year ago, to an over-supplied market of more than 1% (i.e., more than 1 million bpd). 100 80 What caught the market completely off guard, and thus the steep plunge in prices, was the fact that OPEC (i.e., Saudi Arabia) refused to step in to balance the market. Recall that prices were still around $75 prior to the late-November OPEC meeting. 60 Other 40 Asia ex China China Europe 20 U.S. 0 93 1 98 03 Former Soviet Union 08 13 19932013 2014 Average US 19.0 19.2 Europe 13.5 14.9 Other Asia 12.2 8.3 China 10.3 6.1 Middle East 8.1 5.8 Latin America 6.8 5.2 Russia 1 4.8 4.1 Africa 4.0 2.8 92.5 +0.8% Global 2014 Source: International Energy Agency Feature Page 7 of 15 Focus — January 30, 2015 Zeroing in on just the past four years reveals the crux of the issue for the oil market, and the mismatch between supply and demand. Chart 4 U.S. production has seen an amazing turnaround, with output surging nearly 4 million bpd, taking it back to levels not seen since the early 1970s and reversing more than three decades of declining production. Crude Oil US Other Asia Meantime, Canada has been quietly churning out solid gains as well, which in fact have been underway since the early 1980s. Saudi Arabia China Canada Africa Iraq Latin America Kuwait Middle East What Has Changed? (2010-14 chng : mmbpd) Supply On the flip side, demand growth remains muted and confined to the emerging markets. Note that oil consumption is now lower in the industrial world than it was 20 years ago. 0 1 2 3 Demand 4 0 1 2 3 4 Source: International Energy Agency The net effect on the global economy of the deep dive in oil prices is still a matter of debate. While we would agree that it is, on balance, a positive for global growth, the benefits may be a bit more tempered this cycle because: 1) most major central banks don’t have room to cut interest rates meaningfully (which normally provides the positive second-round effects); and, 2) a number of oil producers will face immediate strains. The most obvious strain will be on Russia, which is facing a very serious recession in 2015. On the flip side, almost all of the industrialized world will benefit from the oil price slide, especially the big importers in Japan, India and China. Canada and Norway are the outliers on this front. Chart 5 Winners and Losers of Low Oil Net Trade in Oil & Products — 2014 est. Losers: Net Exporters Turkey 6.2 Saudi Arabia 42.9 Japan 5.1 Venezuela 36.4 India 5.1 Russia 13.5 Eurozone 3.0 Iran 13.1 China 2.8 Norway 9.8 United States 1.2 Canada 3.5 United Kingdom 0.6 Mexico 1.0 The decline in oil prices is a net negative for the Canadian economy, likely cutting 0.5 ppts from real GDP growth in 2015. Chart 6 Oil & gas extraction directly accounts for just over 6% of GDP, and roughly 2% of total employment. But, the true footprint is larger after accounting for support activities and spinoffs to other related sectors (manufacturing, transportation, etc.) Share of Total — 2014 estimates Capital spending in the oil patch will feel the most direct hit, with many 2015 budgets slashed by 20%-to-30%. This accounts for a third of all private non-housing related capex. Lower oil prices mean lower incomes and corporate profits, which will cut Ottawa’s tax revenues by about $5 billion. (% of GDP) Winners: Net Importers Oil Industry — How Big? (percent) Oil & Gas Extraction Est. Net Capital GDP GDP Employment ¹ Spending ² Impact ³ Canada 6.2 2.2 34 -0.5 Alberta 24 7.4 64 -3.0 Saskatchewan 15 5.0 30 -1.0 Nfld. and Labrador 22 7.1 23 -2.0 1.7 0.7 8 +0.5 United States 1 Natural 3 resources sector 2 Private non-res. business investment Impact over the next year Feature Page 8 of 15 Focus — January 30, 2015 The most dramatic impact may well be the reshaping of the regional economic growth landscape. Chart 7 Oil & gas directly accounts for 24% of GDP in Alberta, 22% in Newfoundland & Labrador and 15% in Saskatchewan. (y/y % chng) Growth in Alberta is expected to stall (0.5% in 2015) after a strong outperformance in recent years. Interprovincial migration flows to the province are likely to be cut by about two thirds from recent levels, while Calgary’s housing market is already in the grips of a correction. The fiscal impact in these provinces is likely in the $8 bln range. Most other provinces benefit from lower oil prices and the associated weakness in the Canadian dollar. Ontario GDP growth should top the national average for only the 2nd time in 13 years. After cutting interest rates 25 bps, Governor Poloz said that, “the drop in oil prices is unambiguously negative for the Canadian economy”. The cut was sold as an “insurance” move, should the expected offsetting positives (consumer spending, exports, business confidence) take longer to develop, or develop with less vigour. The Bank assumed $60 oil in the accompanying outlook, but sub$50 oil could trim another quarter point from growth in the first half of 2015, further delaying the closing of the output gap, which is now pegged at the end of 2016. Barring a quick rebound in oil prices or clear evidence that strong U.S. demand is lifting other sectors of the Canadian economy, another rate cut is possible in March. Regional Outlook: The Changing of the Guard Retail Sales 2 (3-mnth m.a.) (3-mnth m.a.) AB MB SK BC ON NS PE QC -0.4 NB -1.3 NL -1.9 -4 1 Dec. BC ON MB NS QC SK NB PE AB NL -1.0 6.6 6.3 5.5 4.8 4.6 4.1 4.0 3.7 2.0 1.3 4 2 Nov. Real GDP 3 0 5 3 2014 10 -4 2.6 2.5 2.3 2.1 2.1 1.9 1.6 1.6 0.5 0 4 BMO forecast Chart 8 Bank of Canada: Another Rate Cut Possible (% : as of January 30, 2015) Overnight Rate 10-year Government Bonds 6 6 forecast 5 5 4 4 2.30% [Year-end ’15] 3 3 2 2 1 1 0%-0.25% 0 0.75% A $10 move in oil prices typically swings the loonie by about 3-5 cents. 150 US Canada 1.77% 1.37% 1.90% 11 13 0 07 01 04 07 10 13 Chart 9 Diverging monetary policy prospects for the Bank of Canada (easing) and Federal Reserve (preparing to tighten) will also apply pressure. 2.4 AB BC 2.0 ON 1.7 MB 0.8 NL 0.8 NB 0.6 PE 0.3 SK QC NS 0 2014 The loonie is arguably the biggest loser from the slide in oil prices, now moving above the $1.27/USD (79 US cents) mark for the first time since the financial crisis. Barring a sudden rebound in oil, we look for the currency to weaken further to around $1.30/USD (77 US cents) by mid-year. —— 2015 —— —————— 2014 —————— Employment 1 09 15 Oil’s Impact on the Loonie (as of January 29, 2015) 1.2 forecast 125 1.1 C$ 1 (rhs) 100 1.0 C$ parity 75 0.9 WTI Oil Price 2 50 0.8 (lhs) 25 0.7 0 0.6 00 02 04 1 (US$/C$) 2 (US$/bbl) actuals: weekly averages 06 08 10 12 14 Vertical bands represent US recessions Forecast: monthly averages Economic Forecast Page 9 of 15 Focus — January 30, 2015 Economic Forecast Summary for January 30, 2015 BMO Capital Markets Economic Research 2014 2015 Annual Q1 Q2 Q3 Q4 Q1 Q2 Q3 Q4 2013 2014 2015 Real GDP (q/q % chng : a.r.) 1.0 3.6 2.8 2.0 1.1 1.8 2.0 2.2 2.0 2.4 2.0 Consumer Price Index (y/y % chng) 1.4 2.2 2.1 1.9 0.8 0.3 0.5 1.1 0.9 1.9 0.7 Unemployment Rate (percent) 7.0 7.0 7.0 6.7 6.7 6.7 6.7 6.6 7.1 6.9 6.7 176 196 199 185 184 177 183 188 189 180 Current Account Balance ($blns : a.r.) -45.0 -39.6 -33.6 -52.7 -56.3 -42.7 -70.0 CANADA Housing Starts (000s : a.r.) 178 -73.7 -76.2 -67.7 -62.5 (average for the quarter : %) Interest Rates Overnight Rate 1.00 1.00 1.00 1.00 0.67 0.50 0.50 0.50 1.00 1.00 0.54 3-month Treasury Bill 0.87 0.93 0.94 0.90 0.60 0.41 0.41 0.41 0.97 0.91 0.46 10-year Bond 2.47 2.35 2.14 1.95 1.42 1.42 1.58 1.82 2.26 2.23 1.56 34 Canada-U.S. Interest (average for the quarter : bps) Rate Spreads 90-day 82 90 91 87 58 39 31 8 91 88 10-year -30 -27 -36 -33 -37 -39 -39 -40 -9 -31 -39 -2.1 4.6 5.0 2.6 2.3 3.0 2.8 2.7 2.2 2.4 3.1 Consumer Price Index (y/y % chng) 1.4 2.1 1.8 1.2 0.0 -0.3 0.1 1.0 1.5 1.6 0.2 Unemployment Rate (percent) 6.6 6.2 6.1 5.7 5.6 5.3 5.1 4.9 7.4 6.2 5.2 0.93 0.99 1.03 1.07 1.10 1.19 1.27 1.31 0.93 1.00 1.22 Current Account Balance ($blns : a.r.) -408 -394 -401 -438 -411 -408 -421 -438 -400 -410 -420 UNITED STATES Real GDP (q/q % chng : a.r.) Housing Starts (mlns : a.r.) (average for the quarter : %) Interest Rates Fed Funds Target Rate 0.13 0.13 0.13 0.13 0.13 0.13 0.21 0.46 0.13 0.13 0.23 3-month Treasury Bill 0.05 0.03 0.03 0.02 0.02 0.02 0.10 0.33 0.06 0.03 0.12 10-year Note 2.76 2.62 2.50 2.28 1.79 1.80 1.97 2.22 2.35 2.54 1.95 EXCHANGE RATES (average for the quarter) US¢/C$ 90.6 91.7 91.8 88.1 81.6 78.9 78.7 79.5 97.1 90.6 79.7 C$/US$ 1.103 1.090 1.089 1.136 1.226 1.268 1.271 1.257 1.030 1.105 1.255 ¥/US$ 103 102 104 115 120 122 123 125 98 106 122 US$/Euro 1.37 1.37 1.32 1.25 1.13 1.14 1.14 1.13 1.33 1.33 1.14 US$/£ 1.66 1.68 1.67 1.58 1.51 1.52 1.52 1.51 1.56 1.65 1.51 Blocked areas represent BMO Capital Markets forecasts Up and down arrows indicate changes to the forecast Key for Next Week Page 10 of 15 Focus — January 30, 2015 Canada Merchandise Trade Balance Thursday, 8:30 am Dec. (e) -$1.2 bln Consensus -$1.1 bln Nov. -$0.6 bln Employment Friday, 8:30 am Jan. (e) +6,000 (+0.03%) Consensus +5,000 (+0.03%) Dec. Jan. (e) -11,300 (-0.1%) Unemployment Rate 6.7% Consensus 6.7% Dec. Jan. (e) Dec. 6.7% Average Hourly Wages +1.9% y/y +1.8% y/y Canada’s trade balance returned to deficit in October and Robert Kavcic November, and the slide in oil prices likely dragged it Senior Economist [email protected] deeper into the red in December. Look for a $1.2 billion 416-359-8329 merchandise trade deficit in the month, which would bring the Q4 tally to $2.2 billion (before any revisions—there are usually big ones), but leave a small surplus in place for all of 2014. With export volumes slumping in the prior two months, trade looks to carve more than a percentage point from real GDP growth in Q4. However, the outlook is brighter in 2015, with the weaker loonie and strong U.S. demand likely to support export volumes outside the energy sector. The speed of this response is one uncertainty faced by the Bank of Canada, but we look for a steady contribution from net exports through the year. After StatsCan’s Labour Force Survey revisions, it turns out that employment growth in Canada was quite a bit weaker than first thought in 2014, clocking in at 0.7% y/y in December. In fact, 102,000 jobs were revised away in December, which puts our quibbling over a few thousand jobs, plus or minus, in any given month into some perspective. That said, we are calling for a 6,000 increase in January employment, reflecting soft underlying conditions, but also some rebound after back-to-back monthly declines to end 2014. One area to watch will be the resource sector where we are on the verge of some negative job prints. Note that Alberta was still quite solid in December, adding 8,400 jobs and up 2.8% y/y. Rather, the late-year weakness was largely in Ontario, an economy that should, eventually, benefit from the slide in oil prices and the loonie. So, look for relative employment trends in these two provinces to flip, with the former weakening as the latter strengthens—January might give us a glimpse of this. The other wild card in January was Target’s announced exit from Canada, which will impact more than 17,000 jobs. This shouldn’t show up yet in the employment data (depending on how some respond), but there is clearly some weakness ahead in the retail sector as these stores close. The jobless rate is expected to hold steady at 6.7%. Average hourly wages will also be eyed closely after slowing to just 1.4% y/y in Q4, below the rate of inflation and the weakest clip in 16 years, and revisions trimmed annualized wage growth during the recovery by roughly a tenth of a percentage point. United States Personal Income & Consumption Monday, 8:30 am Personal Income Dec. (e) +0.3% Consensus +0.2% Nov. Personal Spending -0.2% -0.2% Dec. (e) +0.4% +0.6% Core PCE Deflator +0.1% +1.4% y/y Nov. unch Consensus unch +1.3% y/y +1.4% y/y Although households spent at the fastest rate in eight years Sal Guatieri in Q4 (4.3%), they likely cooled their jets a bit in Senior Economist December, retrenching 0.2%. Retail sales pulled back, as [email protected] 416-359-5295 lower gasoline prices gouged service station receipts and auto sales reversed from eight-year highs. However, personal income should rise a decent 0.3% due to strong job growth. Lower gas prices are also lifting spending power, notably for lower-income earners who have a high propensity to spend. Lower fuel costs will drag down the PCE price measure by 0.2%, cutting its yearly rate to 0.8%. In addition, the strong greenback should temper any increase in core prices after no change in November, keeping its yearly rate at 1.4%. We see it slipping further in coming months, keeping the Fed “patient” until September. Key for Next Week Page 11 of 15 Focus — January 30, 2015 Manufacturing ISM Monday, 10:00 am PMI Jan. (e) 54.5 Prices Paid 36.0 Dec. 38.5 Consensus 54.8 55.1 40.0 Nonmanufacturing ISM Wednesday, 10:00 am Jan. (e) 56.5 Consensus 56.5 Dec. 56.5 Goods & Services Trade Deficit Thursday, 8:30 am Dec. (e) $38.0 bln Consensus $38.0 bln Nov. $39.0 bln Nonfarm Payrolls Friday, 8:30 am Jan. (e) +230,000 Consensus +231,000 Dec. Jan. (e) +252,000 Unemployment Rate 5.6% Consensus 5.6% Dec. Jan. (e) 5.6% Average Hourly Earnings +0.3% Dec. -0.2% Consensus +0.3% Weaker regional factory surveys, including a nasty spill in the oil-rich Dallas Fed region, suggest the ISM manufacturing index retreated for a third straight month in January, possibly to 54.5. While this would still indicate moderate growth, it would also mean the sector has lost momentum after touching three-year highs in the fall, as the mighty dollar and oil downdraft weighed on business spending. By disrupting import supplies, the congestion at the West Coast ports isn’t helping. Keep an eye on the export index, which could return to negative territory for the first time since the Eurozone debt crisis flared in 2012. However, factory production should pick up this year if consumer spending strengthens. The nonmanufacturing index is also coming off multi-year highs, and likely stood still at 56.5 in January. The oil and mining sectors should retrench in the face of lower resource prices, but retail and services will benefit from lower fuel costs, and construction will get a lift from lower mortgage rates. The U.S. trade deficit is expected to decline to $38 billion in December, as the 7 million barrels of oil that the country imports each day just got a whole lot cheaper. But the improving trend won’t last, as oil prices are expected to head higher later this year. Moreover, the mighty dollar (up 10% y/y on a trade-weighted basis) and sluggish global demand will clamp down on exports, which are already slowing. Trade looks to carve about half a percentage point from GDP growth this year, fully offsetting the expected boost from lower energy costs. Following the strongest job growth (3 million) since 1999, nonfarm payrolls likely began 2015 with a little less gas. Payrolls could increase 230,000, downshifting moderately from 252,000 in December and the six-month trend of 264,000. While oil and gas drillers have yet to reduce staff, January could mark the start of a prolonged downturn. Thankfully, the sector is too small to make a meaningful dent in overall job growth. After tumbling two tenths in November as the participation rate probed 37-year lows, the unemployment rate should hold at 5.6%. Last year, nearly three times as many people found work than entered the workforce, greasing the unemployment rate’s 1.1-ppts slide to 6½-year lows. December’s quirky drop in average hourly earnings should more than retrace (or get revised away), as other wage measures have turned modestly higher. Financial Markets Update Page 12 of 15 Focus — January 30, 2015 Jan 30 ¹ Jan 23 Week Ago 4 Weeks Ago Dec. 31, 2014 (basis point change) -25 -25 -15 -15 Canadian Money Market Call Money Prime Rate 0.75 2.85 0.75 3.00 0 -15 U.S. Money Market Fed Funds (effective) Prime Rate 0.25 3.25 0.25 3.25 0 0 0 0 0 0 3-Month Rates Canada United States Japan Eurozone United Kingdom Australia 0.60 0.01 -0.01 0.05 0.56 2.56 0.60 0.02 0.00 0.05 0.57 2.65 0 -1 0 0 0 -9 -32 -1 -1 -2 0 -20 -31 -3 -1 -2 0 -22 2-Year Bonds Canada United States Canada United States Japan Germany United Kingdom Australia 0.41 0.47 1.29 1.68 0.27 0.33 1.35 2.44 0.54 0.49 1.44 1.80 0.23 0.36 1.48 2.63 -13 -1 -15 -12 4 -3 -12 -19 -59 -19 -45 -43 -5 -17 -36 -43 -60 -19 -50 -50 -5 -21 -40 -30 20.0 25 69 367 16.7 24 67 353 10-Year Bonds Risk Indicators VIX TED Spread Inv. Grade CDS Spread ² High Yield CDS Spread ² Currencies US¢/C$ C$/US$ ¥/US$ US$/€ US$/£ US¢/A$ Commodities CRB Futures Index Oil (generic contract) Natural Gas (generic contract) Gold (spot price) Equities S&P/TSX Composite S&P 500 Nasdaq Dow Jones Industrial Nikkei Frankfurt DAX London FT100 France CAC40 S&P ASX 200 ¹ = as of 10:30 am ² = One day delay 78.51 1.274 117.51 1.1303 1.502 77.58 80.52 1.242 117.77 1.1204 1.499 79.12 3.3 pts 1 2 14 2.2 pts 1 2 6 0.8 pts 3 3 10 -2.5 — -0.2 0.9 0.2 -1.9 (percent change) -7.5 — -2.5 -5.8 -2.0 -4.1 -8.8 — -1.9 -6.6 -3.6 -5.1 213.44 45.35 2.67 1,268.10 216.61 45.59 2.96 1,294.10 -1.5 -0.5 -9.7 -2.0 -6.6 -13.9 -11.1 6.6 -7.2 -14.9 -7.5 7.0 14,618 2,010 4,654 17,284 17,674 10,704 6,790 4,608 5,588 14,779 2,052 4,758 17,673 17,512 10,650 6,833 4,641 5,502 -1.1 -2.0 -2.2 -2.2 0.9 0.5 -0.6 -0.7 1.6 -0.9 -2.4 -1.5 -3.1 1.3 9.6 3.7 8.4 2.8 -0.1 -2.4 -1.7 -3.0 1.3 9.2 3.4 7.8 3.3 Global Calendar: February 2 – February 6 Japan EURO AREA Manufacturing PMI Jan. F (e) 51.0 Dec. 50.6 U.K. Manufacturing PMI Jan. F (e) 52.1 Dec. 52.0 Euro Area Monday February 2 Tuesday February 3 Wednesday February 4 Thursday February 5 Leading Index Dec. P (e) 105.4 Nov. 103.9 Composite PMI Jan. Dec. 51.9 Services PMI Jan. Dec. 51.7 Manufacturing PMI Jan. (e) 52.7 Dec. 52.5 EURO AR Producer Price Index Dec. (e) -0.7% Nov. -0.3% ITALY Consumer Price Index Jan. P (e) -2.4% Dec. unch EA -2.5% y/y -1.6% y/y -0.4% y/y -0.1% y/y Construction PMI Jan. (e) 57.0 Dec. 57.6 EURO AREA Composite PMI Jan. F (e) 52.2 Dec. 51.4 Services PMI Jan. F (e) 52.3 Dec. 51.6 Retail Sales Dec. (e) unch Nov. +0.6% +2.0% y/y +1.5% y/y EURO AREA Retail PMI Jan. Dec. 47.6 GERMANY Factory Orders Dec. (e) +1.5% +0.7% y/y Nov. -2.4% -0.4% y/y ECB Monthly Report Composite PMI Jan. (e) 55.5 Dec. 55.2 Other Bank of England Monetary Policy Meeting (Feb. 4-5) CHINA HSBC Manufacturing PMI Jan. F (e) 49.8 Dec. 49.6 AUSTRALIA Trade Deficit Dec. (e) A$850 mln Nov. A$925 mln Manufacturing PMI D Jan. (e) 50.2 Dec. 50.1 Building Approvals Dec. (e) -5.0% +5.6% y/y Nov. +7.5% +10.1% y/y Reserve Bank of Australia Monetary Policy Meeting INDIA Reserve Bank of India Monetary Policy Meeting Nonmanufacturing PMI D Jan. Dec. 54.1 = date approximate CHINA HSBC PMI Composite Services Jan. Dec. 51.4 53.4 NEW ZEALAND Employment Q4 (e) +0.8% +3.0% y/y Q3 +0.8% +3.2% y/y GERMANY Industrial Production Dec. (e) +0.4% -0.3% y/y Nov. -0.1% -0.5% y/y FRANCE Trade Deficit Dec. (e) €3.3 bln Nov. €3.2 bln Dec. (e) Nov. Services PMI Jan. (e) 56.3 Dec. 55.8 D Friday February 6 AUSTRALIA Retail Sales Dec. (e) +0.3% Nov. +0.1% Upcoming Policy Meetings | ECB: Mar. 5, Apr. 15, June 3, July 16, Sep. 3, Oct. 22, Dec. 3 Trade Deficit £9.1 bln £8.8 bln Non-EU £3.0 bln £2.6 bln North American Calendar: February 2 – February 6 Canada Monday February 2 9:30 am Jan. Dec. RBC Manufacturing PMI 53.9 Conference Board’s Consumer Confidence Index D Jan. Dec. 88.9 Tuesday February 3 8:30 am Dec. (e) Nov. Industrial Product Price Index -0.5% -0.4% Raw Materials Price Index -8.0% -5.8% Wednesday February 4 10:00 am Jan. Dec. Thursday February 5 Ivey Purchasing Managers’ 8:30 am Index (s.a.) Dec. (e) Merchandise Trade Balance -$1.2 bln 8:30 am Jan. (e) Employment +6,000 (+0.03%) 55.4 -$0.6 bln Dec. -11,300 (-0.1%) 8:30 am Jan. (e) Unemployment Rate 6.7% Consensus -$1.1 bln Nov. Auto Sales D Jan. Dec. +16.1% y/y United States Dec. (e) Personal Income +0.3% Personal Spending -0.2% Nov. +0.4% +0.6% 8:30 am Dec. (e) Core PCE Deflator +0.1% +1.4% y/y Nov. unch Consensus +0.2% Consensus unch -0.2% +1.3% y/y 7:45 am 8:55 am 9:45 am Jan. (e) Dec. Retail Economist-GS Same- 7:00 am Store Sales – Jan 31st week Jan. 30 Jan. 23 Johnson Redbook Samest Store Sales – Jan 31 week 8:15 am New York ISM 60.0 70.8 +1.4% y/y 10:00 am Factory Orders -1.5% 9:45 am Markit Manufacturing PMI Dec. (e) Consensus -2.0% (Jan. F) Nov. -0.7% 10:00 am Manufacturing ISM 10:00 am IBD/TIPP Economic PMI Prices Paid Optimism Index Jan. (e) 54.5 36.0 Feb. (e) 51.4 C Consensus 54.8 40.0 Jan. 51.5 Dec. 55.1 38.5 Total Vehicle Sales D 10:00 am Construction Spending Jan. (e) 17.0 mln a.r. Dec. (e) +0.6% Consensus +0.8% Nov. -0.3% MBA Mortgage Apps -3.2% Jan. (e) ADP National Employment Report +220,000 8:30 am Initial Claims Jan. 31 (e) 289k (+24k) C Jan. 24 265k (-43k) Dec. +241,000 Continuing Claims 10:00 am Jan. (e) Nonmanufacturing ISM 56.5 8:30 am Jan. 24 Jan. 17 8:30 am Dec. 56.5 Q4 P (e) Productivity Unit Labour Costs unch +2.0% a.r. Q3 +2.3% a.r. 8:30 am Consensus +220,000 Consensus 56.5 C = consensus D = date approximate Fed Speakers: St. Louis’ Bullard (10:00 am); Minneapolis’ Kocherlakota (11:45 am) 11:30 am 4-week bill auction 11:30 am 52-week bill auction $25.0 bln Average Hourly Wages +1.9% y/y +1.8% y/y 8:30 am Dec. (e) Nov. Building Permits +5.0% -13.8% 8:30 am Jan. (e) Nonfarm Payrolls +230,000 Dec. +252,000 8:30 am Jan. (e) Unemployment Rate 5.6% Consensus +231,000 +6.6% y/y Consensus 5.6% 5.6% 8:30 am Jan. (e) Average Hourly Earnings +0.3% Dec. -0.2% 8:30 am Dec. (e) Goods & Services Trade Deficit $38.0 bln Annual Establishment Employment Survey Revisions 3:00 pm Dec. (e) Consumer Credit +$16.0 bln Nov. $39.0 bln Nov. +$14.1 bln 9:45 am Bloomberg Consumer Comfort Index 2,385k (-71k) +1.0% a.r. -1.0% a.r. Consensus $38.0 bln Fed Speakers: Governor Powell (10:00 am); Cleveland’s Mester (12:45 pm) 8:30 am 3- & 10-year note, 30-year bond auction announcements 6.7% 8:30 am Jan. (e) Dec. Dec. Feb. 1 Jan. 25 11:00 am 4-week bill auction announcement 11:30 am 13- & 26-week bill auction $52.0 bln Challenger Layoff Report Consensus +0.9% a.r. 16.8 mln a.r. Dec. 2-year bond auction announcement 7:30 am Jan. Dec. Consensus 16.8 mln a.r. Dec. Consensus +5,000 (+0.03%) Consensus 6.7% 12:05 pm 30-year bond auction $1.4 bln (new cash $1.4 bln) 8:30 am Friday February 6 Consensus +0.3% Consensus +$15.0 bln 47.3 Fed Speaker: Boston’s Rosengren (5:00 am) 11:00 am 13- & 26-week bill auction announcements Fed Speaker: Atlanta’s Lockhart (12:45 pm) Upcoming Policy Meetings | Bank of Canada: Mar. 4, Apr. 15, May 27 | FOMC: Mar. 17-18, Apr. 28-29, June 16-17 Page 15 of 15 Focus — January 30, 2015 General Disclosure “BMO Capital Markets” is a trade name used by the BMO Investment Banking Group, which includes the wholesale arm of Bank of Montreal and its subsidiaries BMO Nesbitt Burns Inc., BMO Capital Markets Ltd. in the U.K. and BMO Capital Markets Corp. in the U.S. BMO Nesbitt Burns Inc., BMO Capital Markets Ltd. and BMO Capital Markets Corp are affiliates. Bank of Montreal or its subsidiaries (“BMO Financial Group”) has lending arrangements with, or provide other remunerated services to, many issuers covered by BMO Capital Markets. The opinions, estimates and projections contained in this report are those of BMO Capital Markets as of the date of this report and are subject to change without notice. BMO Capital Markets endeavours to ensure that the contents have been compiled or derived from sources that we believe are reliable and contain information and opinions that are accurate and complete. However, BMO Capital Markets makes no representation or warranty, express or implied, in respect thereof, takes no responsibility for any errors and omissions contained herein and accepts no liability whatsoever for any loss arising from any use of, or reliance on, this report or its contents. Information may be available to BMO Capital Markets or its affiliates that is not reflected in this report. The information in this report is not intended to be used as the primary basis of investment decisions, and because of individual client objectives, should not be construed as advice designed to meet the particular investment needs of any investor. This material is for information purposes only and is not an offer to sell or the solicitation of an offer to buy any security. BMO Capital Markets or its affiliates will buy from or sell to customers the securities of issuers mentioned in this report on a principal basis. BMO Capital Markets or its affiliates, officers, directors or employees have a long or short position in many of the securities discussed herein, related securities or in options, futures or other derivative instruments based thereon. The reader should assume that BMO Capital Markets or its affiliates may have a conflict of interest and should not rely solely on this report in evaluating whether or not to buy or sell securities of issuers discussed herein. Dissemination of Research Our publications are disseminated via email and may also be available via our web site http://www.bmonesbittburns.com/economics. Please contact your BMO Financial Group Representative for more information. Conflict Statement A general description of how BMO Financial Group identifies and manages conflicts of interest is contained in our public facing policy for managing conflicts of interest in connection with investment research which is available at http://researchglobal.bmocapitalmarkets.com/Public/Conflict_Statement_Public.aspx. ADDITIONAL INFORMATION IS AVAILABLE UPON REQUEST BMO Financial Group (NYSE, TSX: BMO) is an integrated financial services provider offering a range of retail banking, wealth management, and investment and corporate banking products. BMO serves Canadian retail clients through BMO Bank of Montreal and BMO Nesbitt Burns. In the United States, personal and commercial banking clients are served by BMO Harris Bank N.A., Member FDIC. Investment and corporate banking services are provided in Canada and the US through BMO Capital Markets. BMO Capital Markets is a trade name used by BMO Financial Group for the wholesale banking businesses of Bank of Montreal, BMO Harris Bank N.A, BMO Ireland Plc, and Bank of Montreal (China) Co. Ltd. and the institutional broker dealer businesses of BMO Capital Markets Corp. (Member SIPC), BMO Nesbitt Burns Securities Limited (Member SIPC) and BMO Capital Markets GKST Inc. (Member SIPC) in the U.S., BMO Nesbitt Burns Inc. (Member Canadian Investor Protection Fund) in Canada, Europe and Asia, BMO Capital Markets Limited in Europe, Asia and Australia and BMO Advisors Private Limited in India. “Nesbitt Burns” is a registered trademark of BMO Nesbitt Burns Corporation Limited, used under license. “BMO Capital Markets” is a trademark of Bank of Montreal, used under license. "BMO (M-Bar roundel symbol)" is a registered trademark of Bank of Montreal, used under license. ® Registered trademark of Bank of Montreal in the United States, Canada and elsewhere. TM Trademark Bank of Montreal © COPYRIGHT 2015 BMO CAPITAL MARKETS CORP. A member of BMO Financial Group
© Copyright 2026