
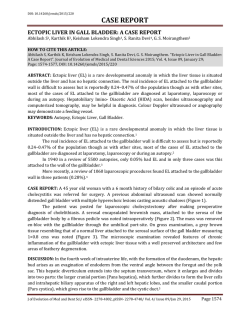
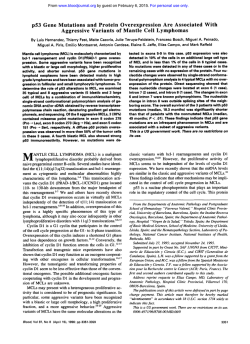
Bladder Carcinoma Data with Clinical Risk Factors and Molecular
Bladder Carcinoma Data with Clinical Risk Factors and Molecular Markers: A Cluster Analysis Enrique Redondo-Gonzalez1, Leandro Nunes de Castro2, María Luisa Maestro de las Casas3, Vicente Vera-Gonzalez4, Daniel Gomes Ferrari2§, Jesús MorenoSierra1, Juan Manuel Corchado5 1 Urology Department, Hospital Clinico San Carlos, Complutense University, Instituto de Investigacion Sanitaria San Carlos (IdISSC) Madrid, Spain 2 Natural Computing Laboratory (LCoN), Mackenzie Presbyterian University, São Paulo, Brazil 3 Clinical Analysis Department, Hospital Clinico Universitario San Carlos, Madrid, Spain 4 Odontology School, Complutense University, Madrid, Spain 5 Biomedical Research Institute of Salamanca/BISITE Research Group, University of Salamanca, Edificio I+D+i, 37008 Salamanca, Spain *These authors contributed equally to this work § Corresponding author Email addresses: ERG: [email protected] LNC: [email protected] MLMC: [email protected] VVG: [email protected] DGF: [email protected] JMS: [email protected] JMC: [email protected] -1- Abstract A bladder cancer is the one that occurs in the epithelial lining of the urinary bladder. It is known to be amongst the most common types of cancer in humans, killing thousands of people a year around the world. The present paper is based on the hypothesis that the use of clinical and histopathological data together with information about the concentration of various molecular markers in patients is useful for the prediction of outcomes and the design of treatments of nonmuscle invasive bladder carcinoma (NMIBC). To achieve that, a subpopulation of 45 patients with a new diagnosis of NMIBC was selected out of a previous dataset of bladder carcinoma (BC). Patients with benign prostatic hyperplasia (BPH), muscle invasive bladder carcinoma (MIBC), carcinoma in situ (CIS) and NMIBC recurrent tumors were not included due to their different clinical behavior. The clinical history was obtained by means of anamnesis and physical examination, and preoperative imaging and urine cytology were carried out for all patients. Then, the patients underwent conventional transurethral resection (TURBT) and some analyses were performed in the proteomic laboratory to quantify the biomarkers (p53, neu, and EGFR). A standard postoperative follow-up was performed in order to detect relapse and progression. Then, a hierarchical clustering exploratory data analysis tool was used to find the intrinsic grouping in this set of data with clinical, molecular markers, histopathological prognostic factors, and statistics about recurrence, progression, and overall survival of patients with NMIBC. The hierarchical clustering analyses performed allowed us to, among other things, group the patients into four groups according to tumor sizes, risk of relapse or progression, and biological behavior. Outlier patients were also detected and categorized according to their clinical characters and biological behavior. As a conclusion, cluster algorithms can group patients with NMIBC into molecular clusters and various risk groups with a different clinical behavior and prognosis, being a useful tool in clinical practice. -2- 1 Introduction Bladder cancer (BC) is one of the most frequently occurring tumors worldwide [1]. Most BCs are transitional cell carcinomas (TCC); that is, a cancer that begins in cells that normally make up the inner lining of the bladder. TCC, also known as urothelial carcinoma, is the most common type of bladder cancer. The cancer starts in cells, called transitional cells, in the bladder lining (urothelium). Bladder cancer is staged according to the degree of tumor invasion into the bladder wall. Carcinoma in situ (stage Tis) and stages Ta and T1 are grouped as nonmuscle invasive bladder cancers (NMIBC) because they are restricted to the inner epithelial lining of the bladder and do not involve the muscle wall. Of the NMIBC, stage Ta tumors are confined to the mucosa, whereas stage T1 tumors invade the lamina propia. T1 tumors are regarded as being more aggressive than Ta tumors. Muscle invasive tumors (MIBC) may extend into the muscle (stage T2), the perivesical fat layer beyond the muscle (stage T3), and adjacent organs (T4). Metastatic tumors involve lymph nodes (N1-3) or distant organs (M1). Approximately 75% of patients with TCC present a disease at a non-invasive stage that involves only the inner lining of the bladder [2]. The remaining 25% of newly diagnosed bladder cancers are MIBC and have a higher risk of cancer-specific mortality [3] with the need of aggressive radical surgery or radiotherapy, with or without chemotherapy. The cellular morphology of TCC is graded according to the grading of cellular differentiation. The grading consists of well-differentiated (grade 1), moderately differentiated (grade 2), and poorly differentiated (grade 3) tumors. Grading of cell morphology in MNIBC is important for establishing prognosis because grade 3 tumors are the most aggressive and the most likely to become invasive. NMIBC is a heterogeneous group of tumors. Between 30% and 90% will relapse within 5 years. One group (70%) will have a good survival rate but a high risk of recurrence with the same degree of clinical aggressiveness and a global survival at 5 years greater than 80% [4]. A minor, but not insignificant proportion of patients (30%) [4, 5] have a high risk of progression with a severe worsening of the prognosis and therapeutic options [6]. The main treatment of NMIBC consists of transurethral resection (TURBT) followed in the majority of the cases by intravesical instillations of chemotherapeutic agents or immunotherapy. -3- The heterogeneity of NMIBC in terms of both histological origin and clinical behavior means that clinical parameters such as tumor grade and stage are not yet enough to accurately predict biological behavior or to guide treatment reliably. Although these parameters provide a certain degree of tumor biological potential, a significant degree of tumor heterogeneity remains even within prognostic subgroups. The need for accurate diagnosis, continuous surveillance, possible repeated treatments, and the need to anticipate which NMIBC will progress into an invasive disease, makes BC one of the most expensive tumors in terms of total medical care expenditures [7] with an estimated cost of US$96,000 to US$187,000 per patient from diagnosis to death in the United States [7]. Accordingly, the major goals in treating patients with NMIBC are to prevent the high number of recurrences and to prevent muscle-invasive progression. A more individually tailored follow up scheme for NMIBC patients depending on their risk profile would help to reduce patient burden and costs. With these aims, new tools to aid diagnosis, assess prognosis, identify optimal treatment, and monitor progression of NMIBC are urgently required. The unprecedented progress on clinical prognostic accuracy with the emergence of risk calculators, artificial neural networks, and cancer genetics are rapidly affecting the clinical management of solid tumors. Some of them are now an integral part of routine clinical management for patients with lung, colon, and breast cancer. In sharp contrast, molecular biomarkers have been largely excluded from current management algorithms for urologic malignancies. Presently, risk associations are beginning to be included in management algorithms of NMIBC [8], but risk groups and validated prognostic molecular biomarkers that can help clinicians to identify patients in need of early, aggressive management are lacking. Hierarchical clustering (HC) applied to structured databases are used as an aid to represent medical domain knowledge substructures to simplify the generation process of the databases through clustering. As a result, it is possible to identify interesting relationships and patterns among the data, and represent them in the form of rules. Based on this background there is a belief of the usefulness to employ a prior database used in several studies of our research group [9-13], which includes traditional risk factors, risk groups and some molecular markers, to perform a cluster analysis to try to discover non-evident patterns in the dataset. -4- The paper is organized as follows. Section 2 presents the research hypotheses and goals of the paper. Section 3 describes the bladder cancer, from epidemiology, to etiology, and prognostic factors. Section 4 presents the population investigated and the clinical methodology used to obtain the data. The hierarchical clustering analysis of the data is presented and discussed in Section 5. The paper is concluded in Section 6 with some considerations and perspectives for future research. 2 Research Hypotheses and Goals The research hypothesis is that a combined molecular and histopathological analysis of NMIBC might be related with predicting outcomes and designing treatments of NMIBC. There are three main goals with this research: To find the intrinsic grouping in a set of data with clinical, molecular markers and statistics about recurrence, progression, and overall survival of patients with NMIBC; To develop a Knowledge Discovery in Databases (KDD) approach for discovering possible relationships between the concentration of different molecular markers, and clinical and histopathological prognostic factors of NMIBC; To investigate if a combined clinical and molecular classification of NMIBC based on a developmental biology approach, can provide additional prognostic information by using a hierarchical clustering exploratory data analysis. 3 Bladder Cancer 3.1 Epidemiology of BC BC is the most common malignancy of the urinary tract, the 7th most common cancer in men and the 17th in women [14]. The worldwide age-standardized incidence rate is 9 per 100,000 for men and 2 per 100,000 for women (2008 data) [15]. In the European Union (EU), the age-standardized incidence rate is 27 per 100,000 for men and six per 100,000 for women [1]. The incidence of BC varies between regions and countries; in Europe, the highest age-standardized incidence rate has been reported in Spain (41.5 in men and 4.8 in women) and the lowest in Finland (18.1 in men and 4.3 in women) [15]. -5- Worldwide age-standardized mortality rate is 3 for men versus 1 per 100,000 for women. In the EU, the age-standardized mortality rate is 8 for men and 3 per 100,000 for women, respectively [1]. In 2008, BC was the eighth most common cause of cancer-specific mortality in Europe [15]. The incidence of BC has decreased in some areas, possibly reflecting the decreased impact of causing agents, mainly smoking and occupational exposure [16]. Mortality from BC has also decreased, possibly reflecting an increased standard of care [17]. 3.2 Etiology of BC Tobacco smoking is the most important risk factor for BC, accounting for approximately 50% of the cases [3, 18], because tobacco smoke contains aromatic amines and polycyclic aromatic hydrocarbons, which are renally excreted. Cigarette smokers have a two- to four-fold increased risk of bladder cancer compared with nonsmokers [19], and the risk increases with increasing intensity and duration of smoking [20]. On cessation of smoking, the risk of bladder cancer falls >30% after 1– 4 years and by >60% after 25 years but never returns to the risk level of nonsmokers [1]. Occupational exposure to aromatic amines, polycyclic aromatic hydrocarbons and chlorinated hydrocarbons is the second most important risk factor for BC, accounting for about 10% of all cases. This type of occupational exposure occurs mainly in industrial plants processing paint, dye, metal and petroleum products [3, 21, 22]. Although the significance of the amount of fluid intake is uncertain, the chlorination of drinking water and subsequent levels of trihalomethanes are potentially carcinogenic, while exposure to arsenic in drinking water increases risk [3]. The association between personal hair dye use and risk remains uncertain; an increased risk has been suggested in users of permanent hair dyes with an NAT2 slow acetylation phenotype [23, 24]. The impact of diet and environmental pollution is less evident. Exposure to ionizing radiation is connected with increased risk. It is suggested that cyclophosphamide and pioglitazone are weakly associated with BC risk [3]. Schistosomiasis, a chronic endemic cystitis, based on recurrent infection with a parasitic trematode, is a cause of BC [3]. -6- Finally, there is increased evidence that genetic predisposition may influence the incidence of TCC of the bladder [3], especially via its impact on susceptibility to other risk factors [3, 25]. 3.3 Prognostic factors (PF) of NMIBC As previously seen, the NMIBC is a heterogeneous group of tumors whose prognosis and therapeutic indications are very difficult to establish at the diagnosis time. Although TURBT is an essential diagnostic tool and an effective treatment for bladder cancer, 45% of patients will have tumor recurrence within 12 months of TURBT alone. Tumor recurrence can be attributed to a combination of missed tumors, incomplete, initial resection, reimplantation of tumor cells after resection, and tumor occurrence in high-risk urothelium. Several factors influence the recurrence rate, for instance, clinical and pathological results, applied treatments, and diagnostics. There are two fundamental risks attributed to NMIBC: the risk of recurrence without worsening the grade or stage, and the risk of progression to MIBC. So, according to this behavior, basically, NMIBC can be classified in three groups of patients. A minority of patients (20–30%) have a relatively benign type of TCC with a low recurrence rate. These low-risk tumors do not show progression. The largest group of patients who frequently develop a NMIBC recurrence but seldom experience progression. A third, small group of patients who have a relatively aggressive non– muscle-invasive tumor at presentation; despite maximum treatment, up to 45% of these patients will develop MIBC. The desire to predict what NMIBC will become MIBC and will develop disseminated disease has stimulated the study of factors with possible prognostic value; these are called prognostic factors (PF). 3.3.1 Clinical PF The current clinicopathology-based prognostic approaches for predicting recurrence and progression in NMIBC divides three groups of factors: PF based on clinical; endoscopic; and pathological findings [26-33]. Prognostic factors based on clinical findings: Primary or recurrence. Prior recurrence rate. Use of intravesical therapy. -7- PF based on endoscopic findings: Number of tumors. Tumor size. PF based on pathologic findings: Tumor grade. Tumor stage. Association with carcinoma in situ (CIS). In our database we selected only primary tumors and with no concomitant CIS. Previously recurrent tumors were excluded because of their molecular markers and their natural history could be altered due to the previous use of intravesical chemo or immunotherapy, usually employed in this kind of tumors. In the same way, concomitant CIS patients were excluded because CIS has a clearly different molecular developmental pathway [34, 35] and a clearly worse prognosis. Several authors have tried to classify NMIBC risk groups by trying to predict the possible evolution, in order to design strategies for treatment and monitoring. Parmar et al. [26] established 3 different groups of risk of recurrence: Group 1 (single tumor and negative cystoscopy at 3rd month); Group 2 (multiple tumor, or positive cystoscopy at 3rd month); and Group 3 (multiple tumor and positive cystoscopy at 3rd month). The percentage of patients free of recurrence at 2 years was 74% in Group 1, 44% in Group 2, and 21% in Group 3. In this classification, interesting for its simplicity, the introduction of positive cystoscopy at 3rd month as a risk factor, provides a high degree of differentiation of tumor recurrence; however, it is not suitable to assess the progression or tumor mortality, which was not accounted for by this author. Fradet [36], studying 382 patients with initial NMIBC showed that the main PF for recurrence in their series were tumor multiplicity, size, stage and tumor grade, defining what they called adverse tumor characteristics (ATC). This classification showed a recurrence and progression risk at 1 year of, 21 and 0% in the low risk group, 36 and 1% in the intermediate risk group, and 66 and 9% in the high risk group. CCAFU [37] also classified the NMIBC into three categories according to progression risk (low-risk groups, intermediate and high). When using these risk groups, however, no distinction is usually drawn between the risk of disease recurrence and disease progression. Although prognostic -8- factors may indicate a high risk of recurrence, the risk of progression might still be low, while other tumors might have a high risk of both recurrence and progression. In order to predict separately the short- and long-term risks of disease recurrence and progression in individual patients, the group of Millan-Rodriguez et al. [38] (in a multivariate analysis of 1529 patients with NIMBC, a risk grouping was assessed by combining stage and grade. Risk groups were classified as low (grade 1 stage Ta disease and a single grade 1 stage T1 tumor), intermediate (multiple grade 1 stage T1 tumors, grade 2 stage Ta disease, or a single grade 2 stage T1 tumor), and high (multiple grade 2 stage T1 tumors, grade 3 stages Ta or T1 disease, and any stage disease associated with CIS), with significant differences on recurrence, progression, and overall survival among the 3 groups. Low- and intermediate-risk patients showed 37% and 45% risk of recurrence respectively, without significant risk for progression or death from bladder cancer. By contrast, in the high-risk category the incidence of recurrence, progression, and mortality was 54%, 15%, and 9.5%, respectively. More recently, the European Organization for Research and Treatment of Cancer (EORTC), Genito-Urinary Cancer Group (GUCG) developed a scoring system and risk tables [8] based on the six most significant clinical and pathological factors: number of tumors; tumor size; prior recurrence rate; T category; presence of concurrent CIS; tumor grade. The basis for the EORTC risk tables was a combined analysis of individual patient data from 2596 NMIBC patients included in seven randomized EORTC trials [8]. A simple scoring system was derived based on six clinical and pathological factors (number of tumors, tumor size, prior recurrence rate, T stage, presence of concomitant CIS, and tumor grade). Based on available prognostic factors and in particular data from the EORTC risk tables, the EAU Guidelines Panel recommends stratification of patients into three risk groups that will facilitate treatment recommendations. The prognostic value of the EORTC scoring system has been confirmed by data from the Clube Urológico Español de Tratamiento Oncológico (CUETO) patients treated with BCG and by long-term follow-up in an independent patient population -9- (125,126). The CUETO risk calculator is available at http://www.aeu.es/Cueto.html [39, 40]. For our database, we used a modification of the risk groups classifications proposed by Parmar et al. [26] and Millan et al. [38], grouping low and intermediate risk groups into the same risk group, trying to avoid the data dispersion, because of the small number of patients in each group and the small prognostic differences between low and intermediate risk groups. 3.3.2 Molecular PF With increasing understanding of the cellular mechanisms underlying the development of molecular pathways involved in urothelial oncogenesis, some molecular prognostic factors are being proposed to identify patients in need of surveillance and aggressive treatment. Originally defined to represent the analysis of the entire protein component of a cell or tissue, proteomics now encompasses the study of expressed proteins, including identification and elucidation of the structure–function relationship under healthy conditions and disease conditions, such as in cancer. In combination with genomics, proteomics can provide a holistic understanding of the biology underlying disease processes. Cancer proteomics encompasses the identification and quantitative analysis of differentially expressed proteins relative to healthy tissue counterparts at different stages of disease, from pre-neoplasia to neoplasia. Expression analysis directly at the protein level is necessary to unravel the critical changes that occur as part of disease pathogenesis. This is because proteins are often expressed at concentrations and forms that cannot be predicted from mRNA analysis [41]. Many molecular markers have been studied in NMIBC [42], including deletion or expression of mutated forms of the tumor-suppressor genes, p53 and retinoblastoma, and expression of the different products of the tyrosine kinase receptor (TKR) family. The epidermal growth factor receptor (EGFR) is a member of the TKR family, a group of receptors which are all encoded by the c-erbB oncogenes. There are four known c-erbB oncogenes whose transcription produces a variety of protein products that play a physiological role in coordinated cell growth and tissue repair. - 10 - Pathological expression of these proto-oncogenes is associated with the loss of coordination of cell growth that typifies malignancy. A series of studies have indicated the potential prognostic value of evaluating expression levels of TKR genes such as FGFR3, EGFR, ERBB2 (HER/neu), and ERBB3 in patients with NMIBC and muscle-invasive bladder cancer (MIBC) [34, 43, 44]. Over-expression of EGFR in bladder cancer has been widely reported [45-48] and several studies have shown EGFR positivity to be associated with high tumor stage, tumor progression, and poor clinical outcome [46, 48, 49]. The mechanism by which EGFR expression is associated with poor prognosis is not entirely clear, although there is some evidence linking EGFR stimulated activation of activator protein-1 transcription factor with induction of matrix metalloproteinase activity [50]. The HER2/neu gene encodes a glycoprotein with intrinsic tyrosine kinase activity, another member of the family TKR. The HER2/neu encoded protein molecule occupies a critical position in the biochemical pathways responsible for the transduction of mitogenic signals from a variety of growth factor receptors. In addition to its role in regulating normal cellular proliferation, over-expression of the HER2/neu gene appears to play a role in neoplastic cell growth [51]. The incidence of over-expression of HER2/neu in bladder cancer is one of the highest among all human malignancies, ranging from 9% to 34% of the cancers tested [52-55]. In transitional bladder cell carcinoma, it was found that HER2 is overexpressed with a greater frequency in higher grades (40%) and stages (38%) than lower grades (0%) and stages (8%) [56]. Several studies have suggested a negative prognostic role for HER/neu amplification or over-expression in MIBC [57-60]. Using multivariate analysis, Bolenzet al. [55] found that patients harboring tumors with HER/neu over-expression were twice as likely to experience recurrence, and to die from their cancer, than patients with HER/neu-negative tumors. A subset of high-grade NMIBCs contains HER2 amplification and is associated with markedly aggressive behavior [61]. The results obtained by quantitative methods in other studies showed HER2/neu oncoprotein to be more significantly expressed in the malignant group compared to the benign and normal groups [54], and they concluded that he quantitative assessment of HER2/neu expression in malignant tumors aided by other proliferation markers such as synthetic - 11 - phase fraction (SPF), DNA index (DI), and ploidy be useful in selecting patients for more aggressive treatment or for predicting outcome. TP53 tumor suppressor gene is considered to play a significant role in carcinogenesis. Mutations in the TP53 are the most frequent genetic abnormalities encountered in human malignancies, including urinary bladder carcinoma [62]. It has already been established that the halflife of a mutated p53 protein is considerably longer than that of the wild-type p53 protein [63]. The accumulation of the mutated p53 protein in the nuclei of the malignant cell is the main reason for increased detection level by immunohistological methods, including immunofluorescence. Many previous studies have established that both p53 gene mutations and immunohistochemically detected p53 expression are independent prognostic biomarkers in CCT, indicating that p53 stabilization not encoded by mutant gene could also produce aberrant downstream signaling pathways, with a central role in apoptotic regulation [64, 65]. Progression of NMIBC to higher-grade muscle-invasive disease is also due to alterations in TP53 and RB1. Early studies by Sarkis et al. [66, 67] found TP53 alterations to be strong independent predictors of disease progression in patients with NMIBC, MIBC, and CIS. Recent studies have supported these findings by showing an independent role of TP53 alteration in predicting disease-free survival and disease-specific survival in patients with pT1 and pT2 tumors who have undergone cystectomy [68]. Digital quantitative detection of nuclear p53 by immunofluorescence staining of histological samples seems to provide more objective and reproducible values corresponding to p53 protein concentration in cell's nuclei than the traditional scoring system of counting the positively stained cells [69]. As it is been proved in previous publications of our working group [9-13] quantitative expression analysis of these proteins seems to be helpful to establish prognosis in BC. 4 Population Investigated 4.1 Clinical Methodology This analysis used a subpopulation of a previous clinical database with three different groups of patients, NMIBC, MIBC, and Benign Prostatic Hyperplasia (BPH) patients. 45 patients with a new diagnosis of NMIBC were selected. Patients with BPH, MIBC, - 12 - CIS and previous NMIBC recurrent tumors were not included in this database because of their different clinical behavior. Anamnesis and physical examination with clinical history were previously carried out in order to collect clinical factors (age, sex, smoking status, and alcohol consumption and presentation mode). As part of a preoperative staging, preoperative imaging (renal and bladder ultrasound, intravenous urography, computed tomography or cistoscopy) and urine cytology were carried out before the diagnosis of all patients. After that, patients underwent conventional TURBT and the following data were collected: multiplicity, size, and aspect. TURBT was completed with a standardized multiple biopsy of the bladder surface in order to exclude the presence of concomitant CIS. Once the TURBT was finished, the tumor tissue obtained was divided into two specimens: one of them for the histopathological study, and the other one for protein expression studies. Histopathological diagnosis was performed by a single pathologist. Grading was established using the OMS classification [70]. Staging was performed by the UICC criteria 1997 staging system [71]. Patients with biopsies that showed the presence of concomitant CIS were excluded from the study. The samples extracted in the surgery-room were sent to the proteomic laboratory for a quantification of the following biomarkers: p53 protein: quantified in the cytosol by a technique of immunoluminescence (LIA); neu protein: determined using a quantitative enzyme linked immunoassay (ELISA); and EGFR: quantified in membranes by radioimmunoassay (RIA). Then, a stratified protocol of postoperative adjuvant intravesical therapy and standard follow-up for patients diagnosed NMIBC with cytology and cystoscopy or ultrasound, was performed for preventing and detecting tumor recurrence and/or progression. 4.2 Dataset The dataset used in the experiments is composed of 45 patients undergoing TURBT for NMIBC without the presence of concomitant CIS. Table 1 summarizes the 67 variables measured for each patient, their description and range. - 13 - Table 1: Variables measured and available in the dataset. Name Type Age N History Gender Fdiagn Tobacco Alcohol Af Mfum Otrosf Hematuri Irritat Dolorsup Otros Diagn Tumor Creat Got Gpt Hem Hb Hcto Ca P Falc Citesp, Citarr; eco, UIV; CT, cistosc Multiple Tam TAM3CM Description Type of sample Diagnosis Age Identification Number Gender Diagnostic data Tobacco Smoking Alcohol Consumption Family history of BC More than 20 cigarettes a day Other risk factors of BC Haematuria Irritative syndrome Suprapubic pain Other symptoms Diagnostic type Number of tumors Creatinine GOT GPT Numberofred blood cells Haemoglobin Hematocrite Calcium Phosphorum Alcaline Phosphatase Aspect Endoscopic aspect 1/ 2/ 3 ASPESUP Tto ADYUV Jewett G G23 Tnm Gries Grx Superficial aspect Type Of Adjuvant Therapy Adjuvant Therapy Histologic Staging Grade Grade 2 ó 3 TNM EORTC Risk Group Millan Risk Group 1/2 Text 1/2 1/2/3 1/ 2 / 3 1/2 1/2 1/2 1/2 AP,tipoAP Type of BC 1/2/9 p53iha P53 inmunohistochemistry 1/2 /3 Diagnosis Test Performed Multiplicity Size (cm) Size 3cm - 14 - Values 1/2/3 Numeric Numeric 1/2 Date 0/1 0/1 0/1 0/1 Text 0/1 0/1 0/1 0/1 1/2 Numeric Numeric Numeric Numeric Numeric Numeric Numeric Numeric Numeric Numeric Significance NMIBC/MIBC/ Control Years --Male / Female DD/MM/YYYY No / Yes No / Yes No / Yes No / Yes Not Analyzable No / Yes No / Yes No / Yes No / Yes Symptomatic / Incidental Numeric mg/dL U/L U/L E6/uL g/dL % mg/dL mg/dL U/L Text Not analyzable 1/2 numeric 1/2 Single / Multiple cm No / Yes 1 Superficial/2 infiltrative/ 3 intermediate Yes / No Not analyzable Yes / No A / B / C-D G1 / G2 / G3 No / Yes Ta / T1 Low-Intermediate / High Low-Intermediate / High Not AnalyzableTCC / SC / Other + / ++/ +++ Name p53ria Neu Description P53 quantifyed Prot p185 quantifyed Prot p16 inmunohistochemistry Relapse First Relapse Data Number of relapses Number of relapses till progression Progression Progression date Metastatic Disease Death Date of Death Cancer Specific Mortality Number of relapses till Death Last Revision Date EGFR quantifyed Neu logarithm Survival (months) Relapse Free Survival Progression Free Survival Metastatic Disease Free Survival Values Numeric Numeric Significance ng/ml HNU (0.05 fmol/mg) /ml 1/2 /3 + / ++ / +++ 1/2 Date Numeric Yes / No DD/MM/YYYY Number Numeric Number 1/2 Date 1/2 1/2 Date 1/2 Numeric Date Numeric Numeric Numeric Months Months Yes / No DD/MM/YYYY Yes / No Yes / No DD/MM/YYYY Yes / No Number DD/MM/YYYY EGFR fmol/protein mg Number of moths Number of moths Number of moths Number of moths Months Number of moths Np53ria p53 RIATertile 1/2/3 Nneu NeuTertile 1/2/3 Negfr EGFRTertile 1/2/3 Filtro edad70 NMIBC Older than 70 years p16 Recid Fechare nªrecid nªrecidp Prog Fprog Metas Muerte Fechmuerte Mporca Recm fechaultre Egfr Logneu Super Ile Tprogre Tmetas 1/2 Tertile 1 / Tertile 2 / Tertile 3 Tertile 1 / Tertile 2 / Tertile 3 Tertile 1 / Tertile 2 / Tertile 3 Yes / No 5 Hierarchical Clustering Analysis The numerical analyses performed here with the dataset emphasized the use of clustering algorithms for finding hierarchical groups of objects in an unsupervised way [72-74]. The first steps involved preparing the dataset for analysis, which included cleansing and normalizing the data. Then, three different clustering analyses were performed: using only those variables with no missing values; using all variables, but replacing missing values; and using only those variables selected by experts. The different analyses allowed us to detect, remove and explain anomalies in the dataset and to cluster patients based on neu ranges and risk groups, with a - 15 - different prognostic of progression or recurrence. The method and experiments are detailed in the following sections. 5.1 Single-Linkage Hierarchical Clustering Clustering, in data mining, tries to identify the distribution of patterns and intrinsic correlations in datasets by partitioning the data points into similarity groups. Clustering enhances the value of existing databases by revealing rules in the data. These rules are useful for understanding trends, making predictions of future events from historical data, or synthesizing data records into meaningful clusters [72-74]. Clustering algorithms usually employ a distance metric (e.g., Euclidean) or a similarity measure to partition the database, such that data points in the same partition are more similar than points in different partitions. Hierarchical clustering is one of the most frequently used methods in unsupervised learning. Given a set of data points, the output is an upside down tree, known as a dendrogram, whose leaves are the data points and whose internal nodes represent nested clusters of various sizes. The tree organizes these clusters hierarchically, where the hope is that this hierarchy agrees with the intuitive organization of real-world data The method used in the clustering experiments performed in this paper is named single-linkage. This is an agglomerative hierarchical method in which new clusters are created by combining the most similar groups. The initial clustering is formed by a singleton; that is, a single object, and at each iteration a new cluster is formed by joining two of the most similar groups of the previous iterations. In the single-linkage, the distance between the new group and the others is determined as the shortest distance among the elements of the new and the remaining groups. 5.2 Data Cleansing Data pre-processing, or data preparation, manipulates and transforms data so that the knowledge contained in it can be more easily and accurately extracted [75, 76]. The best way to pre-process the data depends on three main issues: the database problems (e.g., inconsistency and noise); what use is intended from the data; and how the data analysis tools to be used work. The first pre-processing step performed with the dataset was to remove constant-valued variables, identifiers (IDs), variables with a high number of missing values, and dates. Table 2 presents the variables that were removed from the original dataset and why. - 16 - Table 2: Variables removed from the dataset during the cleansing process. Variable Type Nhistori Otrosf Creat p16 Otrosm Fdiagn Fecharec Fechaprog Fechametas Fechmuerte Fechaultre filter_$ 5.3 Explanation Constant value Identifier 87% of missing values (additional medical information) Empty Empty 93% of missing values (additional medical information) Date Date Date Date Date Date Constant value Analysis with No Missing Values In this first analysis, only those variables without missing values were considered, totaling 58 out of 67 variables, as follows: Age; Gender; Tabaco; Alcohol; Af; Mfumador; Hematuri; Irritat; Dolorsup; Otross; Diagn; Tumor; Hem; Hb; Hcto; Citesp; Citar; Eco; Uiv; Ct; Cistosc; Multiple; Tam; TAM3CM; Aspect; ASPESUPE; Tto; ADYUV; Oncot; Mytom; Bcg; Bmn; Jewett; G; G23; Tnm; GRIES; GRX; Ap; Tipoap; p53iha; p53ria; Neu; Recidiv; Progres; Nrecidiv; Numrecp; Metas; Muerte; Mporca; Recm; Logneu; Superv; Tprogre; Tmetas; Np53ria; Nneu; Edad70. Figure 1(a) shows the dendrogram of the hierarchical clustering performed on all patients and only those variables with no missing values. It can be observed that patients 10, 13 and 28 have profiles substantially distinct from the others, thus being treated as anomalies. To better investigate the data and search for groups of patients’ profiles, the anomalous patients (10, 13 and 28) were removed from the dataset and a new hierarchical clustering was performed, as depicted in Figure 1(b). - 17 - 600 500 400 (a) 300 200 100 0 6 30 35 1 11 29 15 38 26 20 3 22 45 7 14 19 24 4 42 34 37 31 39 17 2 18 12 5 27 16 44 8 23 41 21 36 43 33 40 9 32 25 10 13 28 200 180 160 140 120 (b) 100 80 60 40 20 6 30 35 1 11 29 15 38 26 20 3 22 45 7 14 19 24 4 42 34 37 31 39 17 2 18 12 5 27 16 44 8 23 41 21 36 43 33 40 9 32 25 Figure 1: Hierarchical clustering of the NMIBC patients removing variables with missing values. (a) Clustering of the whole dataset. (b) Clustering of the dataset after removing the anomalous patients 10, 13 and 28. By looking at Figure 1(b) it can be observed the presence of five clusters of patients (represented here by their IDs): Cluster 1: 6, 30, 35. Cluster 2: 1, 3, 4, 7, 11, 14, 15, 17, 19, 20, 22, 24, 26, 29, 31, 34, 37, 38, 39, 42, 45. Cluster 3: 2, 5, 12, 16, 18, 27, 44. Cluster 4: 8, 21, 23, 33, 36, 40, 41, 43. Cluster 5: 9, 25, 32. - 18 - After an analysis of the original dataset and comparison with the groups found by the algorithm, it is possible to note a subdivision of patients based on ranges of the neu variable, as follows: Cluster 1: neu 400 HNU/ml. Cluster 2: 600 neu 1,100 HNU/ml. Cluster 3: neu < 400 HNU/ml. Cluster 4: 1,500 neu 1,900 HNU/ml. Cluster 5: 1,200 neu 1,400 HNU/ml. The anomalous profiles found presented a very large neu: neu > 1,900 HNU/ml. No association between these neu clusters and classical risk factors or risk groups was found. 5.4 Analysis Replacing Missing Values In the second set of experiments performed, all 67 variables were used, but those with missing values were replaced by the average in case of numeric variables, or by the mode in case of categorical variables. Table 3 summarizes the replacement values used for each variable with missing values. Table 3: Replacement values for the variables with missing values. Variable Got Gpt Ca P Falc h_c Egfr Ile Negfr Value 25 24 9.32 3.22 87 23 10.05 61 3 In this case, the hierarchical clustering shown in Figure 2(a) indicates only two anomalous profiles, patients 13 and 28. After removing them from the dataset, the following clusters emerge (Figure 2(b)): Cluster 1: 1, 2, 3, 4, 5, 6, 7, 11, 12, 14, 15, 16, 17, 18, 19, 20, 22, 24, 26, 27, 29, 30, 31, 34, 35, 37, 38, 39, 42, 44, 45. Cluster 2: 8, 21, 23, 33, 36, 40, 41, 43. Cluster 3: 9, 10, 25, 32. - 19 - In this case, an analysis of the groups formed leads to the observation of the following neu ranges: cluster 1 (1,250 HNU/ml neu 1,550 HNU/ml); cluster 2 (neu > 1,550 HNU/ml); and cluster 3 (neu < 1,200 HNU/ml). 700 600 500 400 (a) 300 200 100 7 14 4 3 19 22 24 42 45 34 37 1 11 29 15 26 38 31 39 20 6 30 35 2 12 18 5 27 16 17 44 8 23 36 43 41 21 33 40 9 25 32 10 13 28 240 220 200 180 160 (b) 140 120 100 80 60 40 7 14 4 3 19 22 24 42 45 34 37 1 11 29 15 26 38 31 39 20 6 30 35 2 12 18 5 27 16 17 44 8 23 36 43 41 21 33 40 9 25 32 10 Figure 2: Hierarchical clustering of the NMIBC patients using all variables. (a) Clustering of the whole dataset. (b) Clustering of the dataset after removing the anomalous patients 13 and 28. No association between these neu clusters and classical risk factors or risk groups was found. 5.5 Expert Selection of Relevant Variables In this last experiment, the goal was to observe if there is any relationship between the molecular markers (proteins neu, EGFR and p53) and the tumoral tissue of NMIBC. - 20 - To investigate that, a subset of the variables was selected manually and the clustering algorithm was applied. The following variables were chosen: Age, Gender, Tabaco, Tumor, Multiple, Tam, TAM3CM, ASPESUPE, G, G23, Tnm, GRIES, GRX, Tipoap, p53iha, p53ria, neu, Recidiv, Progres, Nrecidiv, Metas, Muerte, Egfr, Logneu, Superv, Ile, Tprogre, Tmetas, Np53ria, Nneu, Negfr, Edad70. The patients with missing values (3, 8, 10, 11, 17, 18, 22, 23, 24, 27, 28, 31, 34) were removed from the dataset. The results are presented in Figure 3. In Figure 3(a) the clustering of the whole dataset is presented, and it can be observed the presence of eight outliers: 13, 26, 30, 35, 37, 38, 44 and 45. 2.6 2.4 2.2 2 (a) 1.8 1.6 1.4 4 6 9 7 19 20 9 7 5 32 41 43 33 36 1 25 29 42 2 12 14 15 16 39 40 21 37 35 13 30 26 45 44 38 2.3 2.2 2.1 2 1.9 (b) 1.8 1.7 1.6 1.5 1.4 4 6 19 5 20 1 25 2 12 29 42 14 21 32 41 43 33 36 15 16 39 40 Figure 3: Hierarchical clustering of the NMIBC patients using the selected variables. (a) Clustering of the whole dataset. (b) Clustering of the dataset after removing patients 13, 26, 30, 35, 37, 38, 44, 45. - 21 - By looking at Figure 3(b) it is possible to observe four clusters of patients who can be subdivided into risk groups: Cluster 1: low risk with no progression and recurrence; Cluster 2: high risk with no recurrence (or late recurrence) and no progression; Cluster 3: low risk with early recurrence and no progression; and Cluster 4: high risk with recurrence and progression. Outlier patients can always be grouped in one of the different clusters according to their clinical characters (size, number, grade, stage, etc.), but were excluded by the algorithm because one or more molecular markers were out of range, as shown in Table 4 and Table 5. Table 4: Clinical and molecular characteristics of the different clusters. Attribute Age* Multiplicity TM > 3 cm Grade TNM Risk Group [26] Risk Group [38] p53 (ng/ml)* neu (HNU/ml)* EGRF (fmol/mg)* GS (months)* RFS (months)* PFS (months)* Cluster 1 61 years; 18 (23-73) No: 100% Yes 0% No: 71% Yes: 29% G1: 83.3% G2: 16.6% G3: 0% Ta: 100% T1: 0% Low-Int: 100% High: 0% Low-Int: 100% High: 0% 0.1; 0.2 (0-0.6) 748.5; 415.6 (328-1596.1) 6.9; 4.0 (0.2-11.4) 104; 37 (47-128) 104; 37 (47-128) 104; 37 (47-128) Cluster 2 67 years; 9 (52-79) No: 20% Yes 80% No: 50% Yes: 50% G1: 0% G2: 62.5% G3: 37.5% Ta: 0% T1: 100% Low-Int: 0% High: 100% Low-Int: 12.5% High: 87.5% 0.5; 1.2 (0-3.40) 775.4; 544.2 (76-1749.1) 12.5; 12.8 (2.2-16.6) 93; 46 (3-135) 81; 56 (3-135) 93; 46 (3-135) Mean; SD (Range) - 22 - Cluster 3 70 years; 9 (60-82) No: 40% Yes 60% No: 60% Yes: 40% G1: 20% G2: 80% G3: 0% Ta: 80% T1: 20% Low-Int: 80% High: 20% Low-Int: 100% High: 20% 0; 0 (0-0) 1379.9; 184.7 (1253.0-1698.1) 8.5; 4.7 (3.0-15.1) 84; 47 (23-133) 9; 4 (4-13) 84; 47 (23-133) Cluster 4 82 years; 9 (72-93) No: 50% Yes 50% No:0% Yes: 100% G1: 0% G2: 50% G3: 50% Ta: 0% T1: 100% Low-Int: 0% High: 100% Low-Int: 0% High: 100% 0; 0 (0-0) 854.4; 497.7 (330.9-1527.2) 22.8; 17.2 (7.1-39.5) 17; 10 (5-28) 13; 10 (5-27) 13; 10 (5-27) Table 5: Clinical and molecular characteristics of the different outliers (patient number). Attribute Age Multip TM > 3cm Grade TNM Risk Group p53 Neu Egfr GS (months) RFS (months) PFS (months) Cluster Outlier 1 Outlier 2 Outlier 3 Outlier 4 Outlier 5 Outlier 6 Outlier 7 Outlier 8 (13) (26) (30) (35) (37) (38) (44) (45) 77 73 69 72 41 71 80 60 Yes Yes Yes No No No No Yes Yes No No No No No Yes Yes G3 T1 G2 Ta G2 Ta G2 Ta G2 T1 G2 T1 G3 T1 G2 Ta High Low-Int Low-Int Low-Int High High High Low-Int 0 2,125.80 0.5 4.7 724.5 6.3 0.9 415.8 15.5 0 459 8.6 0 994 3.2 0 700 1.3 0.9 385.7 16.4 0 870.6 0 15 35 133 111 131 11 9 106 15 11 5 11 59 1 3 18 15 35 133 111 131 1 3 91 4 3 3 3 2 4 4 3 Bold: reason for exclusion by the algorithm. 5.6 Discussion Progress in data storage and acquisition has resulted in a growing number of enormous databases. The information contained in these databases can be extremely interesting and useful; however, the amount is too large for humans to process manually. Data mining is defined as part of knowledge discovery in databases and draws on the fields of statistics, machine learning, pattern recognition and database management, and can be able to extract interesting and useful material from these large data sets. Using a hierarchical algorithm it was possible to find two different cluster associations based on HER2/neu levels. No one of these associations was significantly correlated with any of the clinicopathologic data studied (neither classical risk factors, nor risk groups). These data support the previous assertion of another working group, which suggested that the quantitative assessment of HER2/neu expression by ELISA in BC was not significantly associated with stage or grade and has no prognostic significance by itself, but only aided by other proliferation markers such as SPF, DI, and ploidy [54]. By using a hierarchical clustering algorithm, it could be found an interesting distribution of patients into four different groups (clusters) with different biological behaviors and prognosis. Cluster 1 is composed of unique tumors, low size (< 3 cm), low grade and low stage, with a low risk of relapse or progression, and with a - 23 - biological behavior according with the expected one in patients with these characteristics. Cluster 2 is composed of tumors with a high risk of relapse and progression (multiplicity, bigger size than 3 cm, high grade and high stage) but with no relapse (or a very late superficial relapse), and no evidence of progression during a long follow up period (almost 8 years). Cluster 3 is composed of unique tumors, with low size, low grade, low stage, and with a low risk of relapse or progression, that shows a very early relapse as NMIBC and no progression. Cluster 4 is composed of high risk tumors, with a high risk of progression (multiplicity, bigger size, high grade and high stage) and with a biological behavior according with these characteristics, with an early relapse, progressing to a MIBC. Outlier patients can always be grouped in one of the different clusters according to their clinical characters (size, number, grade, stage, etc.) and biological behavior, but were excluded by the algorithm because of one or more molecular markers were out of range. Nevertheless, no rules of distribution between clusters and any of the molecular markers were found. The small number of patients in the database is due to the restrictive criteria of inclusion (NMIBC, first tumor, no CIS associated, and disposable molecular markers), and the retrospective analysis of a preexisted database with no specific design for this use, were important limitations of the present study. 6 Conclusions and Future Work This paper explored the hypothesis that clinical and histopathological data, together with information from several molecular markers in patients, helps in the prediction of outcomes and design of treatments for nonmuscle invasive bladder cancer. A hierarchical clustering algorithm was applied to a set of patients to identify clusters of patients with clinical, molecular markers, prognostic factors, and provide statistics about the recurrence, progression, and survival of patients. The results presented showed that the cluster algorithms can group patients with NMIBC into different molecular clusters. The quantitative assessment of HER2/neu expression in NMIBC was grouped by the algorithm, but these were not significantly correlated with clinicopathologic data and are no useful for predicting the patients’ outcome. Also, EGFR and p53 showed not to be useful proteins for clustering patients with NMIBC. However, the hierarchical clustering algorithm could - 24 - group patients with NMIBC into different risk groups with different clinical behaviors and prognosis, but these ones were not significantly correlated with molecular markers. Outliers were also detected and explained. Future investigation include the use of a larger number of patients and the inclusion of different molecular markers in the analyses. 7 Acknowledgements The authors thank Mackenzie University, Mackpesquisa, CNPq, Capes (Proc. n. 9315/13-6) and FAPESP for the financial support. 8 References 1. Colombel M, Soloway M, Akaza H, Böhle A, Palou J, Buckley R, Lamm D, Brausi M, Witjes JA, Persad R: Epidemiology, Staging, Grading, and Risk Stratification of Bladder Cancer. European Urology Supplements 2008, 7:618-626. 2. Brausi M, Witjes JA, Lamm D, Persad R, Palou J, Colombel M, Buckley R, Soloway M, Akaza H, Bohle A: A review of current guidelines and best practice recommendations for the management of nonmuscle invasive bladder cancer by the International Bladder Cancer Group. J Urol 2011, 186:2158-2167. 3. Burger M, Catto JW, Dalbagni G, Grossman HB, Herr H, Karakiewicz P, Kassouf W, Kiemeney LA, La Vecchia C, Shariat S, Lotan Y: Epidemiology and risk factors of urothelial bladder cancer. Eur Urol 2013, 63:234-241. 4. Parker SL, Tong T, Bolden S, Wingo PA: Cancer statistics, 1996. CA: A Cancer Journal for Clinicians 1996, 46:5--27. 5. Stein JP, Grossfeld GD, Ginsberg DA, Esrig D, Freeman JA, Figueroa AJ, Skinner DG, Cote RJ: Prognostic markers in bladder cancer: a contemporary review of the literature. J Urol 1998, 160:645-659. 6. Herr HW: Tumor progression and survival of patients with high grade, noninvasive papillary (TaG3) bladder tumors: 15-year outcome. J Urol 2000, 163:60-61; discussion 61-62. 7. Botteman MF, Pashos CL, Redaelli A, Laskin B, Hauser R: The health economics of bladder cancer: a comprehensive review of the published literature. Pharmacoeconomics 2003, 21:1315-1330. 8. Sylvester RJ, van der Meijden AP, Oosterlinck W, Witjes JA, Bouffioux C, Denis L, Newling DW, Kurth K: Predicting recurrence and progression in individual patients with stage Ta T1 bladder cancer using EORTC risk tables: a combined analysis of 2596 patients from seven EORTC trials. Eur Urol 2006, 49:466-465; discussion 475-467. 9. Moreno Sierra J, Maestro de las Casas ML, Redondo Gonzalez E, Fernandez Perez C, del Barco Barriuso MT, Sanz Casla V, Blanco Jimenez E, Silmi Moyano A, Resel Estevez L: Epidermal growth factor receptor (EGFR) in the prognosis of bladder carcinoma. Experience of 5 years. Arch Esp Urol 2000, 53:323-331. - 25 - 10. Moreno Sierra J, Maestro de las Casas ML, Ortega Heredia MD, Chicharro Almarza J, Blanco Jimenez E, Silmi Moyano A, Resel Estevez L: New quantitative method for determining p53 protein in bladder carcinomas. Arch Esp Urol 1997, 50:347-353. 11. Moreno Sierra J, Maestro de las Casas ML, Redondo Gonzalez E, Fernandez Perez C, del Barco Barriuso V, Sanz Casla MT, Blanco Jimenez E, Silmi Moyano A, Resel Estevez L: P185 (Neu) oncoprotein in the prognosis of bladder carcinoma. Experience of 5 years. Arch Esp Urol 2000, 53:238-244. 12. Moreno Sierra J, Maestro de las Casas ML, Fernandez Perez C, Redondo Gonzalez E, Sanz Casla MT, del Barco Barriuso V, Blanco Jimenez E, Silmi Moyano A, Resel Estevez L: Quantification of p53 oncoprotein in bladder carcinoma: 5-year experience. Arch Esp Urol 1999, 52:220-227. 13. Moreno Sierra J, Maestro de las Casas M, Ortega Heredia MD, Hermida Gutierrez J, Resel Estevez L: Quantitative determination of epidermal growth factor urothelial receptor (EGFR) in superficial and invasive bladder carcinoma. Actas Urol Esp 1994, 18:215-220. 14. Brausi MA: Primary prevention and early detection of bladder cancer: two main goals for urologists. Eur Urol 2013, 63:242-243. 15. Ferlay J, Shin H, Bray F, Forman D, Mathers C, Parkin D: GLOBOCAN 2008 v2.0, Cancer incidence and mortality worldwide: IARC CancerBase No. 10. Lyon, France: International Agency for Research on Cancer; 2010. 16. Bosetti C, Bertuccio P, Chatenoud L, Negri E, La Vecchia C, Levi F: Trends in mortality from urologic cancers in Europe, 1970-2008. Eur Urol 2011, 60:1-15. 17. Ferlay J, Randi G, Bosetti C, Levi F, Negri E, Boyle P, La Vecchia C: Declining mortality from bladder cancer in Europe. BJU Int 2008, 101:11-19. 18. Freedman ND, Silverman DT, Hollenbeck AR, Schatzkin A, Abnet CC: Association between smoking and risk of bladder cancer among men and women. Jama 2011, 306:737-745. 19. Kirkali Z, Chan T, Manoharan M, Algaba F, Busch C, Cheng L, Kiemeney L, Kriegmair M, Montironi R, Murphy WM, et al: Bladder cancer: epidemiology, staging and grading, and diagnosis. Urology 2005, 66:4-34. 20. Silverman DT, Devesa SS, Moore LE, Rothman N: Bladder Cancer. In Cancer Epidemiology and Prevention. 3rd edition. Edited by Schottenfeld D, Fraumeni JF: Oxford University Press; 2006: 1101-1128 21. Samanic CM, Kogevinas M, Silverman DT, Tardon A, Serra C, Malats N, Real FX, Carrato A, Garcia-Closas R, Sala M, et al: Occupation and bladder cancer in a hospital-based case-control study in Spain. Occup Environ Med 2008, 65:347-353. 22. Rushton L, Bagga S, Bevan R, Brown TP, Cherrie JW, Holmes P, Fortunato L, Slack R, Van Tongeren M, Young C, Hutchings SJ: Occupation and cancer in Britain. Br J Cancer 2010, 102:1428-1437. 23. Koutros S, Silverman DT, Baris D, Zahm SH, Morton LM, Colt JS, Hein DW, Moore LE, Johnson A, Schwenn M, et al: Hair dye use and risk of bladder cancer in the New England bladder cancer study. Int J Cancer 2011, 129:2894-2904. 24. Ros MM, Gago-Dominguez M, Aben KK, Bueno-de-Mesquita HB, Kampman E, Vermeulen SH, Kiemeney LA: Personal hair dye use and the risk of bladder cancer: a case-control study from The Netherlands. Cancer Causes Control 2012, 23:1139-1148. 25. Rafnar T, Vermeulen SH, Sulem P, Thorleifsson G, Aben KK, Witjes JA, Grotenhuis AJ, Verhaegh GW, Hulsbergen-van de Kaa CA, Besenbacher S, et al: European genome-wide association study - 26 - identifies SLC14A1 as a new urinary bladder cancer susceptibility gene. Hum Mol Genet 2011, 20:4268-4281. 26. Parmar MK, Freedman LS, Hargreave TB, Tolley DA: Prognostic factors for recurrence and followup policies in the treatment of superficial bladder cancer: report from the British Medical Research Council Subgroup on Superficial Bladder Cancer (Urological Cancer Working Party). J Urol 1989, 142:284-288. 27. Shinka T, Hirano A, Uekado Y, Ohkawa T: Clinical study of prognostic factors of superficial bladder cancer treated with intravesical bacillus Calmette-Guerin. Br J Urol 1990, 66:35-39. 28. Kiemeney LA, Witjes JA, Heijbroek RP, Debruyne FM, Verbeek AL: Dysplasia in normallooking urothelium increases the risk of tumour progression in primary superficial bladder cancer. Eur J Cancer 1994, 30a:1621-1625. 29. Kurth KH, Denis L, Bouffioux C, Sylvester R, Debruyne FM, Pavone-Macaluso M, Oosterlinck W: Factors affecting recurrence and progression in superficial bladder tumours. Eur J Cancer 1995, 31a:1840-1846. 30. Millan-Rodriguez F, Chechile-Toniolo G, Salvador-Bayarri J, Palou J, Vicente-Rodriguez J: Multivariate analysis of the prognostic factors of primary superficial bladder cancer. J Urol 2000, 163:73-78. 31. Soloway MS, Sofer M, Vaidya A: Contemporary management of stage T1 transitional cell carcinoma of the bladder. J Urol 2002, 167:1573-1583. 32. Miyamoto H, Miller JS, Fajardo DA, Lee TK, Netto GJ, Epstein JI: Non-invasive papillary urothelial neoplasms: the 2004 WHO/ISUP classification system. Pathol Int 2010, 60:1-8. 33. Miyamoto H, Brimo F, Schultz L, Ye H, Miller JS, Fajardo DA, Lee TK, Epstein JI, Netto GJ: Low-grade papillary urothelial carcinoma of the urinary bladder: a clinicopathologic analysis of a post-World Health Organization/International Society of Urological Pathology classification cohort from a single academic center. Arch Pathol Lab Med 2010, 134:1160-1163. 34. Wu XR: Urothelial tumorigenesis: a tale of divergent pathways. Nat Rev Cancer 2005, 5:713725. 35. Mitra AP, Datar RH, Cote RJ: Molecular pathways in invasive bladder cancer: new insights into mechanisms, progression, and target identification. J Clin Oncol 2006, 24:5552-5564. 36. Fradet Y: Prognostic Factors. Back to the future. In Superficial Bladder Cancer. Edited by Fair WR, Pagano F: CRC Press; 1997: 57-70 37. Rischmann P, Bittard H, Chopin D, Coloby P, Davin JL, Irani J, Lebret T, Lefrere MA, Maidenberg M, Marechal JM, et al: AFU recommendations 1998. "Committee on Cancer of the French Association of Urology". Prog Urol 2002, 12:1159-1160. 38. Millan-Rodriguez F, Chechile-Toniolo G, Salvador-Bayarri J, Palou J, Algaba F, VicenteRodriguez J: Primary superficial bladder cancer risk groups according to progression, mortality and recurrence. J Urol 2000, 164:680-684. 39. van Rhijn BW, Zuiverloon TC, Vis AN, Radvanyi F, van Leenders GJ, Ooms BC, Kirkels WJ, Lockwood GA, Boeve ER, Jobsis AC, et al: Molecular grade (FGFR3/MIB-1) and EORTC risk scores are predictive in primary non-muscle-invasive bladder cancer. Eur Urol 2010, 58:433441. 40. Fernandez-Gomez J, Madero R, Solsona E, Unda M, Martinez-Pineiro L, Ojea A, Portillo J, Montesinos M, Gonzalez M, Pertusa C, et al: The EORTC tables overestimate the risk of recurrence and progression in patients with non-muscle-invasive bladder cancer treated with - 27 - bacillus Calmette-Guerin: external validation of the EORTC risk tables. Eur Urol 2011, 60:423-430. 41. Srinivas PR, Srivastava S, Hanash S, Wright GL, Jr.: Proteomics in early detection of cancer. Clin Chem 2001, 47:1901-1911. 42. Netto GJ: Molecular biomarkers in urothelial carcinoma of the bladder: are we there yet? Nat Rev Urol 2012, 9:41-51. 43. Rotterud R, Nesland JM, Berner A, Fossa SD: Expression of the epidermal growth factor receptor family in normal and malignant urothelium. BJU Int 2005, 95:1344-1350. 44. Simonetti S, Russo R, Ciancia G, Altieri V, De Rosa G, Insabato L: Role of polysomy 17 in transitional cell carcinoma of the bladder: immunohistochemical study of HER2/neu expression and fish analysis of c-erbB-2 gene and chromosome 17. Int J Surg Pathol 2009, 17:198-205. 45. Neal DE, Marsh C, Bennett MK, Abel PD, Hall RR, Sainsbury JR, Harris AL: Epidermal-growthfactor receptors in human bladder cancer: comparison of invasive and superficial tumours. Lancet 1985, 1:366-368. 46. Neal DE, Sharples L, Smith K, Fennelly J, Hall RR, Harris AL: The epidermal growth factor receptor and the prognosis of bladder cancer. Cancer 1990, 65:1619--1625. 47. Colquhoun A, Mellon J: Epidermal growth factor receptor and bladder cancer. Postgrad Med J 2002, 78:584-589. 48. Mellon K, Wright C, Kelly P, Horne CH, Neal DE: Long-term outcome related to epidermal growth factor receptor status in bladder cancer. J Urol 1995, 153:919-925. 49. Nutt JE, Mellon JK, Qureshi K, Lunec J: Matrix metalloproteinase-1 is induced by epidermal growth factor in human bladder tumour cell lines and is detectable in urine of patients with bladder tumours. Br J Cancer 1998, 78:215-220. 50. Kavanagh BD, Lin PS, Chen P, Schmidt-Ullrich RK: Radiation-induced enhanced proliferation of human squamous cancer cells in vitro: a release from inhibition by epidermal growth factor. Clin Cancer Res 1995, 1:1557-1562. 51. Roh H, Pippin J, Drebin JA: Down-regulation of HER2/neu expression induces apoptosis in human cancer cells that overexpress HER2/neu. Cancer Res 2000, 60:560-565. 52. Gandour-Edwards R, Lara PN, Jr., Folkins AK, LaSalle JM, Beckett L, Li Y, Meyers FJ, DeVereWhite R: Does HER2/neu expression provide prognostic information in patients with advanced urothelial carcinoma? Cancer 2002, 95:1009-1015. 53. Latif Z, Watters AD, Dunn I, Grigor K, Underwood MA, Bartlett JM: HER2/neu gene amplification and protein overexpression in G3 pT2 transitional cell carcinoma of the bladder: a role for anti-HER2 therapy? Eur J Cancer 2004, 40:56-63. 54. Eissa S, Ali HS, Al Tonsi AH, Zaglol A, El Ahmady O: HER2/neu expression in bladder cancer: relationship to cell cycle kinetics. Clin Biochem 2005, 38:142-148. 55. Bolenz C, Shariat SF, Karakiewicz PI, Ashfaq R, Ho R, Sagalowsky AI, Lotan Y: Human epidermal growth factor receptor 2 expression status provides independent prognostic information in patients with urothelial carcinoma of the urinary bladder. BJU Int 2010, 106:1216-1222. 56. Kruger S, Weitsch G, Buttner H, Matthiensen A, Bohmer T, Marquardt T, Sayk F, Feller AC, Bohle A: Overexpression of c-erbB-2 oncoprotein in muscle-invasive bladder carcinoma: - 28 - relationship with gene amplification, clinicopathological parameters and prognostic outcome. Int J Oncol 2002, 21:981-987. 57. Ravery V, Grignon D, Angulo J, Pontes E, Montie J, Crissman J, Chopin D: Evaluation of epidermal growth factor receptor, transforming growth factor alpha, epidermal growth factor and c-erbB2 in the progression of invasive bladder cancer. Urol Res 1997, 25:9-17. 58. Jimenez RE, Hussain M, Bianco FJ, Jr., Vaishampayan U, Tabazcka P, Sakr WA, Pontes JE, Wood DP, Jr., Grignon DJ: Her-2/neu overexpression in muscle-invasive urothelial carcinoma of the bladder: prognostic significance and comparative analysis in primary and metastatic tumors. Clin Cancer Res 2001, 7:2440-2447. 59. Chakravarti A, Winter K, Wu CL, Kaufman D, Hammond E, Parliament M, Tester W, Hagan M, Grignon D, Heney N, et al: Expression of the epidermal growth factor receptor and Her-2 are predictors of favorable outcome and reduced complete response rates, respectively, in patients with muscle-invading bladder cancers treated by concurrent radiation and cisplatin-based chemotherapy: a report from the Radiation Therapy Oncology Group. Int J Radiat Oncol Biol Phys 2005, 62:309-317. 60. Bolenz C, Lotan Y: Translational research in bladder cancer: from molecular pathogenesis to useful tissue biomarkers. Cancer Biol Ther 2010, 10:407-415. 61. Chen PC, Yu HJ, Chang YH, Pan CC: Her2 amplification distinguishes a subset of non-muscleinvasive bladder cancers with a high risk of progression. J Clin Pathol 2013, 66:113-119. 62. Ecke TH, Schlechte HH, Schulze G, Lenk SV, Loening SA: Four tumour markers for urinary bladder cancer--tissue polypeptide antigen (TPA), HER-2/neu (ERB B2), urokinase-type plasminogen activator receptor (uPAR) and TP53 mutation. Anticancer Res 2005, 25:635-641. 63. Finlay CA, Hinds PW, Tan TH, Eliyahu D, Oren M, Levine AJ: Activating mutations for transformation by p53 produce a gene product that forms an hsc70-p53 complex with an altered half-life. Mol Cell Biol 1988, 8:531-539. 64. George B, Datar RH, Wu L, Cai J, Patten N, Beil SJ, Groshen S, Stein J, Skinner D, Jones PA, Cote RJ: p53 gene and protein status: the role of p53 alterations in predicting outcome in patients with bladder cancer. J Clin Oncol 2007, 25:5352-5358. 65. Popov Z, Hoznek A, Colombel M, Bastuji-Garin S, Lefrere-Belda MA, Bellot J, Abboh CC, Mazerolles C, Chopin DK: The prognostic value of p53 nuclear overexpression and MIB-1 as a proliferative marker in transitional cell carcinoma of the bladder. Cancer 1997, 80:1472-1481. 66. Sarkis AS, Dalbagni G, Cordon-Cardo C, Zhang ZF, Sheinfeld J, Fair WR, Herr HW, Reuter VE: Nuclear overexpression of p53 protein in transitional cell bladder carcinoma: a marker for disease progression. J Natl Cancer Inst 1993, 85:53-59. 67. Sarkis AS, Dalbagni G, Cordon-Cardo C, Melamed J, Zhang ZF, Sheinfeld J, Fair WR, Herr HW, Reuter VE: Association of P53 nuclear overexpression and tumor progression in carcinoma in situ of the bladder. J Urol 1994, 152:388-392. 68. Shariat SF, Bolenz C, Karakiewicz PI, Fradet Y, Ashfaq R, Bastian PJ, Nielsen ME, Capitanio U, Jeldres C, Rigaud J, et al: p53 expression in patients with advanced urothelial cancer of the urinary bladder. BJU Int 2010, 105:489-495. 69. Saidi S, Popov Z, Stavridis S, Janevska V, Panov S: Digital quantitative immunofluorescent detection of p53 protein in urinary bladder cancer tissue samples. Prilozi 2013, 34:167-175. 70. Mostofi FK, Davis CJJ, Sesterhenn IA: Histological Typing of Urinary Bladder Tumours (WHO. World Health Organization. International Histological Classification of Tumours). Springer; 1999. - 29 - 71. Sobin LH, Wittekind C: TNM: Classification of Malignant Tumours. 5th edn: Wiley-Liss; 1997. 72. Jain AK, Murty MN, Flynn PJ: Data clustering: a review. ACM Computing Surveys (CSUR) 1999, 31:264-323. 73. Kaufman L, Rousseeuw PJ: Finding Groups in Data: An Introduction to Cluster Analysis. WileyInterscience; 2005. 74. Everitt BS, Landau S, Leese M: Cluster Analysis. Wiley Publishing; 2009. 75. Pyle D: Data Preparation for Data Mining (The Morgan Kaufmann Series in Data Management Systems). Morgan Kaufmann; 1999. 76. Zhang S, Zhang C, Yang Q: Data preparation for data mining. Applied Artificial Intelligence 2003. - 30 -


© Copyright 2026