
QUANTIFYING THE BEHAVIOR OF RECURRING SLOPE LINEAE
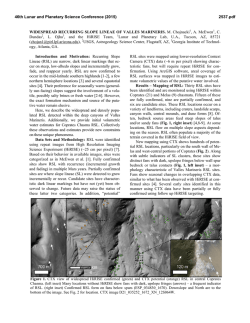
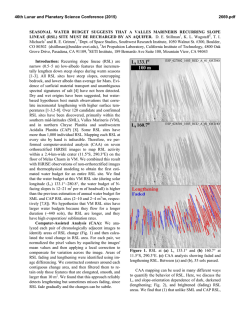
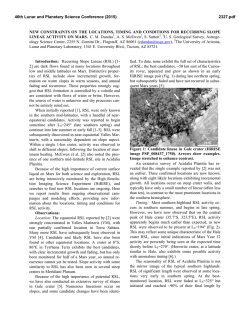
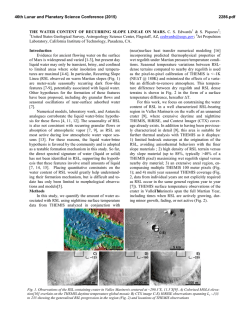
46th Lunar and Planetary Science Conference (2015)
2930.pdf
QUANTIFYING THE BEHAVIOR OF RECURRING SLOPE LINEAE (RSL). E. I. Schaefer1, A. S. McEwen1, S. Mattson1, and L. Ojha2, 1Lunar and Planetary Laboratory, University of Arizona, Tucson, AZ 85721
([email protected]), 2School of Earth and Atmospheric Sciences, Georgia Institute of Technology, Atlanta,
GA 30332-0340.
Introduction: Recurring slope lineae (RSL) are
narrow (0.5-5 m) linear features on Mars that initiate
and grow downslope on steep (25-40°), rocky slopes,
primarily in the southern midlatitudes and in the tropics near Valles Marineris [1,2]. The hypothesis that
they are due to flow of brine or liquid water at or very
near the surface is suggested by their exclusive occurrence in places and at times where afternoon brightness
temperatures reach ~250-300 K [2,3] as measured by
the Thermal Emission Imaging System [4], their rapid
fading when winter approaches, and their flow-like
morphology [1,2]. Unlike classical slope streaks [1],
RSL continue to grow over timescales of weeks and
recur in multiple years at the same location, a “life
cycle” that is more consistent with a “wet” than a
“dry” mechanism.
Nonetheless, a source for liquid water is unclear [3]
and the volume that would be involved is likely substantial [5]. In this study, we therefore remain agnostic
as to the formation mechanism. Instead, we are quantifying the life cycle of RSL in as much spatial and temporal detail as possible for the first time, using imagery
from the High Resolution Imaging Science Experiment
(HiRISE) [6] and elevations derived therefrom. Our
ultimate goal is to determine with what mechanism or
mechanisms the detailed behavior of RSL is most consistent. The measurements from the current study will
contribute to this goal by providing necessary constraints to proposed RSL mechanisms as these are explored via laboratory work [e.g., 7,8], modeling [e.g.,
5], and terrestrial analogs [e.g., 9].
Methods: We are currently focusing on Tivat
crater in the southern midlatitudes (Noachis Terra) but
will expand the study to other sites. We have generated
a high-resolution Digital Terrain Model (DTM) [10]
from HiRISE images ESP_012991_1335 and
ESP_013624_1335 and have coregistered and orthorectified all 20 HiRISE images of the site to this
DTM. We are also actively acquiring new HiRISE
images for the ongoing active season.
Mapping RSL presents several complications chiefly stemming from their small size—near the HiRISE
resolution limit—and their unknown origin—which
hampers geologic inference. To accurately represent
this ambiguity, we collect ancillary data while mapping RSL (Fig. 1) so that we can later simulate different plausible interpretations of their extents and interimage behavior. This in turn will allow us to quantify
the influence of specific assumptions and assess the
limitations of our measurements. For enhanced efficiency, reproducibility, and consistency, we are using
automated algorithms wherever possible to process the
mapped polygons, including conversion of these polygons to linear representations (“skeletons”) via an adaptation of the medial axis transform [11]. This conversion allows us to make linear measurements such as
length and growth rate.
Results: The algorithm to simulate different plausible interpretations is currently in development. However, using the most liberal interpretation, select results
are complete.
In MY 30, at Ls 250.6, no RSL are observed, but
13 RSL form and grow to an average length of ~55 m
by 11 sols later (Ls 257.8), an “inter-image growth
rate” of ~5 m/sol (Table 1). By 32 sols later (Ls 278.5),
93 new RSL have formed but their inter-image growth
rate over this longer interval is ~1 m/sol. Also, only 5
of the earlier RSL continue to grow during the interval,
at an inter-image rate of ~3 m/sol.
For the three longest RSL at Tivat crater, we have
completed mapping for the entire Mars Year (MY) 30
active season. The results indicate that the initial
growth rate of these RSL is very rapid and continues at
a progressively slower pace for several weeks (Fig. 1).
They also reveal that these RSL maintain a very nearly
constant slope along their lengths (Fig. 2) despite the
concavity of the crater wall that hosts them.
Discussion: The sample RSL life cycles (Fig. 1)
suggest that RSL grow fastest early in their life cycles.
Qualitative observations suggest that this behavior is
general, a conclusion that is further supported by the
severe drop in inter-image growth rate of new RSL
from 5 m/sol when the inter-image interval is 11 sols
to ~1 m/sol for the next inter-image interval of 32 sols.
There are also hints in the current data that RSL that
form earlier in the season grow faster, but this inference should be considered tentative as it is based on
relatively few data.
A robust conclusion (earlier suggested by [2]) is
that RSL are supply-controlled, as their ending slopes
are very similar to their starting slopes. Indeed, many
RSL at Tivat have nearly linear longitudinal topographic profiles (Fig. 2), in part because sinuosity decreases away from the head. In essence, RSL at Tivat
create their own switchbacks.
46th Lunar and Planetary Science Conference (2015)
2930.pdf
It should be noted that even though growth rate
slows as RSL evolve, this does not imply that flow rate
must decrease if RSL are wet. It may be that sustained
or even enhanced flow is necessary to offset evaporation and extend the RSL after an initial length is established (as discussed by [5]). More generally, directly
inferring process from even careful quantification of
form is problematic. This degeneracy highlights the
need for the planned modeling study, which will use
the detailed observations from the current study as
constraints.
Acknowledgements: This material is based in part
on work supported by the National Science Foundation
Graduate Research Fellowship under Grant No.
2012116373.
References: [1] Ojha L. et al. (2011) LPSC 42,
Abstract #2101. [2] McEwen A. S. et al. (2011) Science, 333, 740-743. [3] McEwen A. S. et al. (2014)
Nature Geoscience, 7, 53-58. [4] Christensen, P. R. et
al. (2004) Space Sci. Rev., 110, 85-130. [5] Grimm R.
E. et al. (2014) Icarus, 233, 316-327. [6] McEwen A.
S. et al. (2007) JGR, 112, E05S02. [7] Chevrier V. F.
and Rivera-Valentin, E. G. (2012) Geophys. Res. Lett.,
39, L21202. [8] Masse M. et al (2014) Planet. Space
Sci., 92, 136-149. [9] Levy, J.S. (2012) Icarus, 219, 14. [10] Kirk R. L. et al. (2008) JGR, 113, E00A24. [11]
.T. W. Brandt and V. H. Algazi (1992) CVGIP: Image
Understanding, 55, 329-337.
Table 1
MY 29
MY 30
6
Ls 290.3 Ls 250.6 Ls 257.8 Ls 278.5
Sol (Fig. 1) N/A
-5.5
5.5
37.5
# of RSL
98
0
18
108
2
total areal extent (m )
total length along
1
surface (m)
mean all RSL:
median all RSL:
growth rate (m/sol)
mean all RSL:
mean extended3 RSL:
3
median extended RSL:
4
mean inherited RSL:
mean new5 RSL:
11,651
N/A
702
3,940
1
13,506
169
61
N/A
N/A
N/A
741
57
55
3,940
47
23
----
N/A
N/A
N/A
5.04
---
2
1.04
3.49
2.48
---
N/A
N/A
---
1.61
1.10
values for ~90% of RSL for which
centerlines were found
2
lower bound; 2x larger if estimated
as in Fig. 2
3
new in Ls 257.8 image + grew in Ls
278.5 image
4
new in Ls 257.8 image
5
new in Ls 278.5 image
6
baseline image (before active
season began)
Fig. 1 (left). Examples of
RSL life cycles from Tivat
(this study) and Raga [5]
in MY 30, with markers at
each HiRISE image. Gray
ranges are uncertainty in
RSL initiation.
Fig. 2 (right). Topographic
profiles (no vertical exaggeration) for the same
Tivat RSL as in Fig. 1, with
markers at the length
achieved by the time of
each HiRISE image.
Dashed reference lines
are perfectly linear.


© Copyright 2026