
WEEKLY MARKET UPDATE
Weekly Market Update | 2 February 2015
WEEKLY MARKET UPDATE
2 February 2015
Still bullish on Europe despite geopolitical risks
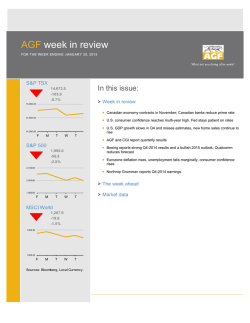
Data out of Europe looks to be improving
Citi Economic Surprise Index
A general election in Greece showed the anti-austerity party Syriza won,
with 36% of the vote. The left-wing party has promised to ditch austerity
and renegotiate the country's €240bn bailout with the European Union and
International Monetary Fund.
While Syriza negotiations could run into months, with Greece surviving on
a possible combination of emergency liquidity issuance, arrears on debt
and bill issuance for the government, Citi analysts believe that Greece is
unlikely to spread contagion to other markets and the risk of Grexit is low.
Amidst the political noise, we still view the broad case for European asset
markets as positive with equities and higher-yield bonds being strong
beneficiaries as investors migrate to higher yields and riskier assets. The
recent €1.1 trillion stimulus from the ECB and addition consumption boost
from lower oil prices is likely to provide a tailwind to Europe through 2015.
CESIUSD Index
CESIEUR Index
CESICNY Index
60
30
0
-30
-60
Nov-14
Dec-14
Jan-15
Source: Bloomberg as of 30 January 2015
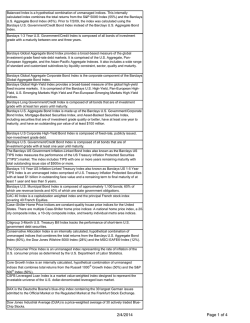
HY slowly recovering
Accumulated 3-month Bond Index Returns
World Govt Bonds Index
HY Index
Global EMD Index
1%
0%
-1%
-2%
Performance
-4%
The MSCI World index retreated 1.9% to 410.33 for the week. US markets
were also lower, as the Dow Jones Industrial Average dropped 2.9% and
the S&P 500 Index fell 2.8%.
Despite falling 0.46% for the week, the Stoxx Europe 600 still posted its
best January since 1989, climbing 7.2%. Japanese equities also rose with
the Nikkei225 and Topix gaining 0.9% and 0.8% respectively.
-5%
-6%
Nov-14
Dec-14
Equities — QE is generally good for equities. We are overweight in QE
markets although the ECB’s recent actions are priced in. We also prefer US
domestic earners vs. external earners.
Credit — QE episodes are usually supportive for credit spread tightening.
We prefer High Yield bonds over Investment Grade in both Europe and US.
Citi expects € spreads to tighten 20-25%.
Rates — A lower EUR and ECB QE mix likely lowers real yields, raises
breakevens, and sees Bunds underperform USTs and periphery Europe.
Commodities — Demand-supply and USD strength are dominating
commodities. With the outlook for a stronger dollar, upside appears limited
unless there is significant reduction in supply or demand recovery.
Jan-15
Source: Bloomberg as of 30 January 2015
EM equities worst performing
Accumulated 3-month Equity Index Returns
The MSCI Emerging Markets Index fell 3% to 961.61. Within the region,
Emerging Europe and Latin America took a beating, dropping 7% and 6.1%
respectively. The MSCI Asia ex Japan fared better in comparison, losing
1.6%. The Shanghai Composite Index was the biggest underperformer,
sliding 4.2% for the week.
Asset Allocation
-3%
MSCI World
MSCI EM
MSCI Asia
4%
2%
0%
-2%
-4%
-6%
-8%
-10%
-12%
Nov-14
Dec-14
Jan-15
Source: Bloomberg as of 30 January 2015
Week Ahead Key Data and Event
Date
Country
Data & Event
2-Feb
EC
Markit Eurozone Manufacturing PMI
Jan F
51.0
51.0
2-Feb
US
Personal Income
Period Survey
Dec
0.2%
0.4%
Prior
Citi Fct
0.2%
2-Feb
US
Personal Spending
Dec
-0.2%
0.6%
-0.3%
2-Feb
US
ISM Manufacturing
Jan
54.5
55.5
56.0
4-Feb
EC
Markit Eurozone Services PMI
Jan F
52.3
52.3
52.3
4-Feb
EC
Markit Eurozone Composite PMI
Jan F
52.2
52.2
52.2
4-Feb
EC
Retail Sales MoM
Dec
0.0%
0.6%
0.3%
4-Feb
EC
Retail Sales YoY
Dec
2.0%
1.5%
2.4%
6-Feb
US
Change in Nonfarm Payrolls
Jan
235K
252K
275K
6-Feb
JN
Leading Index CI
Dec P
105.4
103.9
105.3
6-Feb
JN
Coincident Index
Dec P
110.5
109.2
110.5
6-Feb
IN
GDP YoY
4Q
--
5.3%
5.6%
51.0
Source: Bloomberg as of 30 January 2015
Page 1
Weekly Market Update | 2 February 2015
Drivers and Risk By Market
United States
Driver: The National Federation of Independent Business surveys still show an
appetite to grow capital investment in 2015 despite the hits coming from the energy
industry. Against this backdrop, expenditures on software and hardware may
continue to climb.
Risk: Recent earnings reports and guidance cuts by several major technology and
industrial companies not to mention the pressures in the oil patch have left investors
wondering about growth prospects, earnings and the economic future. These factors
may erode confidence.
Implication: Low oil prices may present some opportunity within the retailing and
consumer durable sectors. In addition, we continue to see opportunities in Financials
(Banks and REITs) as well as IT (Software & Hardware).
End-2015 Target: 2200
2200
2100
2000
1900
1800
1700
1600
Source: Bloomberg as of 30 January 2015
Europe
Driver: ECB QE is key ingredient in Citi’s bull case for European equities. We retain
our end-2015 Stoxx target of 400 as we see some scope for “double up” - positive
earnings growth & re-rating in Europe.
Risk: Deflation remains a risk but we think that much is already priced in. Political
risks in the Eurozone are rising more broadly as far-left opposition party Syriza won
the elections in Greece and difficult negotiations lie ahead to agree on a follow-up
bailout with Greece’s troika creditors. An agreement may eventually be found due to
the strong mutual incentives of both parties to avoid the worst-case scenarios of
Greek government default or Grexit, but the negotiations may likely be lengthy and
could fail.
End-2015 Target: 400
390
370
350
330
310
290
DJ Stoxx TMI
270
Source: Bloomberg as of 30 January 2015
Implication: To benefit from the QE, our strategy includes (1) Search for yield –
Dividend stocks (Insurance, Telecoms, Banks, Autos), (2) European high yield
bonds, (3) Cyclicals/Financials over Defensives and (4) Stocks with a strong
balance sheet and high sales exposure to the US.
Japan
S&P 500
1500
Driver: Japan’s economy has already escaped from the technical recession and has
returned to a positive growth track in Q4 last year. Japan’s Q4 real GDP likely grew
at 0.9% QoQ and BoJ’s real exports index rose a solid 3.3% MoM in December
2014. By item, information/communication-related goods and capital goods drove
the recent pickup. By destination, real exports to the US and Asia—even those to
China—grew at a solid pace. A rebound in the global tech cycle and solid growth in
US capex—are main drivers for the renewed pickup in exports.
Risk: While falling JGB yields are positive for Japanese equities boosting valuations,
rising risk premium due to uncertainty about the impact of the plunge in crude prices
or concerns on geopolitics may offset the benefit of falling yields.
End-2015 Target: 1650
1600
1500
1400
1300
1200
1100
Japan Topix
1000
Source: Bloomberg as of 30 January 2015
Implication: We prefer autos and tires exporters, brokerage and insurance.
Asia
Driver: China may enjoy benefits of low commodity price, together with reform
dividend in 2015 and beyond. The friendly oil price this year could save the cost of
imports equivalent to 0.9% of GDP. It may not notably lift the official GDP growth,
but could trim the downside risks to the economy and improve the underlying
growth momentum.
Risk: The Chinese economy is unlikely to stabilize unless the property sector
recovers in the near term or new growth drivers emerge in the longer term.
Combined policy easing and structural reforms are necessary to avoid the shortterm pain of transition.
Implication: Our end-2015 MXCN/ CSI300 index targets stand at 78/ 3,700 and in
terms of sectors, we prefer health care, I.T., Consumer discretionary,
Transportation, Insurance and Real Estate.
End-2015 Target: 630
620
600
580
560
540
520
500
MSCI Asia ex JP
480
Source: Bloomberg as of 30 January 2015
Page 2
Weekly Market Update | 2 February 2015
Currency Forecast
Currency 30-Jan-15
Weekly Market Performance
Forecasts
Last price
Mar-15
Jun-15
Sep-15
Dec-15
Mar-16
1.14
1.12
1.10
1.08
1.05
G10-US Dollar
Euro
Japanese yen
(04/07/2014~04/11/2014)
EURUSD
USDJPY
1.13
117.5
118
124
129
132
GBPUSD
1.51
1.52
1.50
1.47
1.44
1.41
Swiss Franc
USDCHF
0.92
0.85
0.90
0.95
0.99
1.03
Australian Dollar
AUDUSD
0.78
0.80
0.76
0.73
0.72
0.71
New Zealand
NZDUSD
0.73
0.75
0.71
0.68
0.67
USDCAD
1.27
1.20
1.22
1.25
1.26
5.8%
Oil
Japan TPX Index
0.8%
134
British Pound
Canadian Dollar
(26 – 30 January 2015)
0.7%
Korea KOSPI
0.7%
Citi Global Emerging Mkt Sovereigns
0.4%
Citi World Broad Inv Grade
0.3%
Citi High Yield
0.66
-0.8%
Gold
1.27
-0.9%
Europe Stoxx Europe 600
-1.2%
Taiwan TAIEX
EM Asia
-1.2%
UK FTSE 100
-1.4%
HK Hang Seng
Chinese Renminbi
USDCNY
6.25
6.23
6.26
6.29
6.27
6.23
Hong Kong
USDHKD
7.75
7.76
7.77
7.79
7.78
7.78
-1.6%
MSCI AsiaXJapan
Indonesian Rupiah
USDIDR
12672
12,830
12,999
13,170
13,167
13,127
-1.9%
MSCI AC World
Indian Rupee
USDINR
62
62.8
63.3
63.9
64.1
64.2
Korean Won
USDKRW
1093.68
1,107
1,122
1,137
1,140
1,140
Malaysian Ringgit
USDMYR
3.63
3.65
3.66
3.67
3.66
3.64
Philippine Peso
USDPHP
44.11
45.3
45.6
45.9
46.0
46.0
Singapore Dollar
USDSGD
1.35
1.35
1.36
1.37
1.37
1.37
Thai Baht
USDTHB
32.76
33.3
33.4
33.6
33.5
33.4
Taiwan Dollar
USDTWD
31.53
32.0
32.1
32.2
32.2
32.1
Russian Ruble
USDRUB
69.47
64.0
63.6
63.2
63.9
64.7
South African Rand
USDZAR
11.65
11.69
11.88
12.07
12.13
12.17
Brazilian Real
USDBRL
2.68
2.78
2.83
2.89
2.92
2.94
Mexican Peso
USDMXN
14.98
14.7
14.5
14.2
14.1
14.1
US S&P 500
-2.8%
China Shanghai Composite
-4.2%
China HSCEI
-4.4%
-6.1%
MSCI Latin America
-7.0%
MSCI Emerging Europe
-10%
0%
10%
Source: Bloomberg as of 30 January 2015
EM Europe
EM Latam
Market Performance (Year-To-Date)
(As of 30 January 2015)
8.3%
Source: Citi Research and Bloomberg as of 30 January 2015
HK Hang Seng
3.8%
UK FTSE 100
2.8%
Short Rates and 10-Year Yield Forecasts
Forecasts
Last price
30-Jan-15
1Q15
2Q15
3Q15
4Q15
1Q16
2Q16
Short Rates (End of Period)
US
0.25
0.25
0.25
0.25
0.50
0.50
Japan
0.1
0.1
0.1
0.1
0.1
0.1
0.1
Euro Area
0.05
0.05
0.05
0.05
0.05
0.05
0.05
1.64
1.95
2.20
2.35
2.55
2.65
2.65
Japan
0.29
0.25
0.35
0.40
0.45
0.50
0.50
Euro Area
0.30
0.55
0.55
0.65
0.65
0.75
0.75
MSCI AsiaXJapan
1.9%
Citi World Broad Inv Grade
1.8%
Korea KOSPI
1.2%
Citi Global Emerging Mkt Sovereigns
0.6%
Taiwan TAIEX
0.5%
Japan TPX Index
Citi High Yield
China Shanghai Composite
-0.8%
10-Year Yield (Period Average)
US
2.5%
0.4%
0.75
-1.6%
MSCI AC World
-2.1%
MSCI Emerging Europe
-2.2%
China HSCEI
US S&P 500
-3.1%
MSCI Latin America
-6.3%
Oil
-9.4%
-20%
Gold
Europe Stoxx Europe 600
7.2%
0%
20%
Source: Citi Research and Bloomberg as of 30 January 2015
Source: Bloomberg as of 30 January 2015
Page 3
Weekly Market Update | 2 February 2015
World Market At Glance
Historical Returns (%)
Last price
52-Week
52-Week
30-Jan-15
High
Low
1 week
1 month
1 year
Year-to-date
Year-to-date
(USD)
US / Global
MSCI World
410.33
434.24
382.57
-1.89%
-2.19%
4.17%
-1.63%
-1.63%
Dow Jones Industrial Average
17164.95
18103.45
15340.69
-2.87%
-4.55%
8.31%
-3.69%
-3.69%
S&P 500
NASDAQ
1994.99
4635.24
2093.55
4814.95
1737.92
3946.03
-2.77%
-2.58%
-4.10%
-2.98%
11.19%
12.42%
-3.10%
-2.13%
-3.10%
-2.13%
MSCI Europe
435.07
506.61
409.57
-0.91%
-0.37%
-6.69%
-0.19%
-0.19%
Stoxx Europe 600
367.05
372.78
302.48
-0.90%
7.63%
13.53%
7.16%
-0.04%
FTSE100
6749.40
6904.86
6072.68
-1.22%
3.09%
3.23%
2.79%
-0.91%
CAC40
4604.25
4679.26
3789.11
-0.79%
8.45%
10.15%
7.76%
0.53%
DAX
10694.32
10810.57
8354.97
0.42%
9.06%
14.09%
9.06%
1.27%
NIKKEI225
17674.39
18030.83
13885.11
0.93%
1.28%
17.77%
1.28%
3.04%
Topix
1415.07
1454.22
1121.50
0.84%
0.54%
15.60%
0.54%
2.28%
MSCI Emerging Market
961.61
1104.31
906.25
-2.95%
0.74%
2.70%
0.55%
0.55%
MSCI Latin America
2555.44
3720.81
2455.16
-6.11%
-6.10%
-11.50%
-6.31%
-6.31%
MSCI Emerging Europe
117.56
198.14
106.52
-6.97%
-6.18%
-36.21%
-2.13%
-2.13%
MSCI EM Middle East & Africa
271.12
341.09
248.54
-3.45%
-1.15%
-9.28%
0.13%
0.13%
46907.68
62304.88
44904.83
-3.83%
-6.20%
-0.71%
-6.20%
-7.47%
737.35
1421.07
578.21
-10.19%
-6.75%
-44.18%
-6.75%
-6.75%
Europe
Japan
Emerging Markets
Brazil Bovespa
Russia RTS
Asia
MSCI Asia ex-Japan
577.69
608.06
508.53
-1.61%
2.94%
10.44%
2.48%
2.48%
Australia S&P/ASX 200
5588.32
5679.50
5052.20
1.57%
3.17%
7.72%
3.28%
-1.81%
China HSCEI (H-shares)
11720.10
12400.40
9159.76
-4.40%
-1.05%
19.37%
-2.21%
-2.19%
China Shanghai Composite
3210.36
3406.79
1974.38
-4.22%
1.41%
57.91%
-0.75%
-1.47%
Hong Kong Hang Seng
24507.05
25362.98
21137.61
-1.38%
4.28%
11.22%
3.82%
3.84%
India Sensex30
29182.95
29844.16
19963.12
-0.33%
6.49%
42.37%
6.12%
8.08%
Indonesia JCI
5289.40
5325.04
4320.78
-0.65%
1.19%
19.70%
1.19%
-1.46%
Malaysia KLCI
1781.26
1896.23
1671.82
-1.21%
0.82%
-1.26%
1.14%
-2.67%
Korea KOSPI
1949.26
2093.08
1876.27
0.68%
1.76%
0.42%
1.76%
1.01%
Philippines PSE
7689.91
7736.97
5886.01
1.87%
6.35%
27.29%
6.35%
7.65%
Singapore STI
3391.20
3432.62
2953.01
-0.60%
0.75%
12.02%
0.77%
-1.43%
Taiwan TAIEX
9361.91
9593.68
8230.46
-1.15%
1.01%
10.63%
0.59%
0.19%
Thailand SET
1581.25
1610.78
1266.78
-1.07%
5.58%
25.09%
5.58%
6.04%
48.24
107.73
43.58
5.81%
-10.86%
-50.89%
-9.44%
-9.44%
1283.77
1392.22
1131.24
-0.80%
6.93%
3.20%
8.35%
8.35%
Commodity
Oil
Gold spot
Source: Citi Research and Bloomberg as of 30 January 2015
Page 4
Weekly Market Update | 2 February 2015
Disclaimer
“Citi analysts” refers to investment professionals within Citi Research (“CR”), Citi Global Markets Inc. (“CGMI”) and voting members of the Citi Global
Investment Committee.
Citibank N.A. and its affiliates / subsidiaries provide no independent research or analysis in the substance or preparation of this document.
The information in this document has been obtained from reports issued by CGMI. Such information is based on sources CGMI believes to be reliable.
CGMI, however, does not guarantee its accuracy and it may be incomplete or condensed. All opinions and estimates constitute CGMI's judgment as of the
date of the report and are subject to change without notice. This document is for general information purposes only and is not intended as a
recommendation or an offer or solicitation for the purchase or sale of any security or currency. No part of this document may be reproduced in any
manner without the written consent of Citibank N.A. Information in this document has been prepared without taking account of the objectives, financial
situation, or needs of any particular investor. Any person considering an investment should consider the appropriateness of the investment having regard
to their objectives, financial situation, or needs, and should seek independent advice on the suitability or otherwise of a particular investment.
Investments are not deposits, are not obligations of, or guaranteed or insured by Citibank N.A., Citigroup Inc., or any of their affiliates or subsidiaries, or
by any local government or insurance agency, and are subject to investment risk, including the possible loss of the principal amount invested. Investors
investing in funds denominated in non-local currency should be aware of the risk of exchange rate fluctuations that may cause a loss of principal. Past
performance is not indicative of future performance, prices can go up or down. Some investment products (including mutual funds) are not available to US
persons and may not be available in all jurisdictions. Investors should be aware that it is his/her responsibility to seek legal and/or tax advice regarding
the legal and tax consequences of his/her investment transactions. If an investor changes residence, citizenship, nationality, or place of work, it is his/her
responsibility to understand how his/her investment transactions are affected by such change and comply with all applicable laws and regulations as and
when such becomes applicable. Citibank does not provide legal and/or tax advice and is not responsible for advising an investor on the laws pertaining
to his/her transaction.
Country Specific Disclosures
Australia
:
This document is distributed in Australia by Citigroup Pty Limited ABN 88 004 325 080, AFSL 238098. For a
full explanation of the risks of investing in any investment, please ensure that you fully read and understand the
relevant Product Disclosure Statement prior to investing.
Hong Kong
:
This document is distributed in Hong Kong by Citibank (Hong Kong) Limited ("CHKL"). Prices and
availability of financial instruments can be subject to change without notice. Certain high-volatility investments
can be subject to sudden and large falls in value that could equal the amount invested.
India
:
This document is distributed in India by Citibank N.A. Investment are subject to market risk including that of
loss of principal amounts invested. Products so distributed are not obligations of, or guaranteed by, Citibank and
are not bank deposits. Past performance does not guarantee future performance. Investment products cannot be
offered to US and Canada Persons. Investors are advised to read and understand the Offer Documents carefully
before investing.
Indonesia
:
This report is made available in Indonesia through Citibank N.A., Indonesia Branch. Citibank N. A., Indonesia is a bank
that is licensed, registered and supervised by the Indonesia Financial Services Authority (OJK).
Korea
:
This document is distributed in South Korea by Citibank Korea Inc. Investors should be aware that
investment products are not guaranteed by the Korea Deposit Insurance Corporation and are subject to
investment risk including the possible loss of the principal amount invested. Investment products are not
available to US persons.
Malaysia
:
This document is distributed in Malaysia by Citibank Berhad.
People's Republic of China
:
This document is distributed by Citibank (China) Co., Ltd in the People's Republic of China (excluding the
Special Administrative Regions of Hong Kong and Macau, and Taiwan).
Philippines
:
This document is made available in Philippines by Citicorp Financial Services and Insurance Brokerage Phils.
Inc, Citibank N.A. Philippines. Investors should be aware that Investment products are not insured by the
Philippine Deposit Insurance Corporation or Federal Deposit Insurance Corporation or any other government
entity.
Singapore
:
This report is distributed in Singapore by Citibank Singapore Limited (“CSL”). Investment products are not
insured under the provisions of the Deposit Insurance and Policy Owners’ Protection Schemes Act 2011 of
Singapore and are not eligible for deposit insurance coverage under the Deposit Insurance Scheme.
Thailand
:
This document contains general information and insights distributed in Thailand by Citigroup and is made
available in English language only. Citi does not dictate or solicit investment in any specific securities and similar
products. Investment contains certain risk, please study prospectus before investing. Not an obligation of, or
guaranteed by, Citibank. Not bank deposits. Subject to investment risks, including possible loss of the principal
amount invested. Subject to price fluctuation. Past performance does not guarantee future performance. Not
offered to US persons.
United Kingdom
:
This document is distributed in U.K. by Citibank International Limited. Registered office: Citibank International
Limited, Citibank Centre, 25, Canada Square, Canary Wharf, London E14 5LB. Authorised by the Prudential
Regulation Authority and regulated by the Financial Conduct Authority and the Prudential Regulation Authority.
Page 5


© Copyright 2026