
AGF Week in Review - Week Ended Jan 23
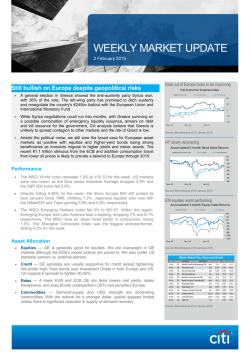
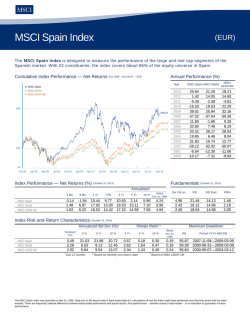
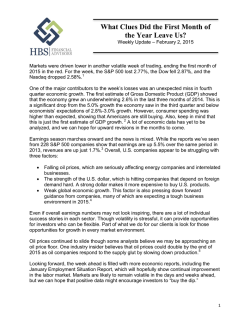
AGF week in review FOR THE WEEK ENDING JANUARY 30, 2015 S&P TSX In this issue: 14,673.5 -105.9 -0.7% > Week in review 15,000.00 Canadian economy contracts in November; Canadian banks reduce prime rate 14,500.00 U.S. consumer confidence reaches multi-year high, Fed stays patient on rates U.S. GDP growth slows in Q4 and misses estimates, new home sales continue to 14,000.00 rise F M T W T F S&P 500 AGF and CGI report quarterly results Boeing reports strong Q4-2014 results and a bullish 2015 outlook; Qualcomm 1,995.0 -56.8 -2.8% reduces forecast Eurozone deflation rises, unemployment falls marginally, consumer confidence rises 2,100.00 Northrop Grumman reports Q4-2014 earnings 2,000.00 > The week ahead 1,900.00 F M T W T F W T F MSCI World 1,267.9 -19.6 -1.5% 1300.00 1200.00 F M T Sources: Bloomberg, Local Currency. > Market data AGF WEEK IN REVIEW FOR THE WEEK ENDING JANUARY 30, 2015 Week in Review Canadian economy contracts in November; Canadian banks reduce prime rate Statistics Canada reported that real GDP contracted 0.2% month over month in November 2014, below the rise of 0.3% in the previous month and expectations of no change. Year over year, the Canadian economy grew by 1.9%. The major components of the GDP calculation reflected generally weak results. Goods-producing industries shrunk 0.8% month over month, led by manufacturing and mining and oil and gas extraction, which experienced declines of 1.9% and 1.5%, respectively. The declines were partially offset by increases in the utilities and agriculture and forestry sectors. Service-producing industries were flat month over month after gaining 0.3% during the previous month. Increases in retail trade and the public sector were offset by decreases in other industries. Canada’s major banks reduced their prime rates to 2.85% from 3% in response to last week’s unexpected move by the Bank of Canada (BoC) to reduce its overnight rate. Royal Bank of Canada was the first to announce its cut, followed swiftly by Toronto-Dominion Bank, Bank of Montreal, Canadian Imperial Bank of Commerce and Bank of Nova Scotia. National Bank of Canada reduced its prime rate as well. While all the aforementioned banks reduced their prime rates, their reduction of 15 basis points (bps) was short of the BoC’s cut of 25 bps, as the chartered banks were motivated to protect their profit margins as the spread between what the banks pay for borrowed money and what they pay for money lent out has narrowed considerably. The move by the banks followed RBC’s decision late last week to reduce its benchmark five-year fixed-rate mortgage rate by 10 bps to 4.84%. In addition, TD announced last week that they were going to hold their prime rate at 3%. The prime rate across the banks has not moved since September 2010 and has never dropped by less than 25 bps since the BoC began tracking such data in 1935. Sources: Statistics Canada, The Globe and Mail, Reuters. U.S. consumer confidence reaches multi-year high, Fed stays patient on rates The U.S. Conference Board Consumer Confidence Index increased in January to 102.9, above expectations of 96.0. December’s reading was revised upwards to 93.1 from 92.6. “Consumer confidence rose sharply in January and is now at its highest level since August 2007. A more positive assessment of current business and labor market conditions contributed to the improvement in consumers’ view of the present situation,” the Conference Board stated. The U.S. Federal Reserve Board struck a positive tone with its most recent monetary policy announcement, stating that “economic activity has been expanding at a solid pace” and that it will remain patient on when it will increase the benchmark federal funds rate from the current historical low of 0%0.25%. The Fed acknowledged the strength of the U.S. economy and that it remains on track to raise rates later this year. The Fed centered its discussion of the economy on the labour market, focusing on strong job gains and a declining unemployment rate. The central bank admitted that inflation has fallen further below its long-term objective as a result of recent declines in energy prices, but it expects inflation to rise closer to 2% over the “medium term” as factors related to lower energy prices fade and the labour 2 AGF WEEK IN REVIEW FOR THE WEEK ENDING JANUARY 30, 2015 market continues to improve. The Fed reiterated that if the economic data that it is monitoring indicates “faster progress” towards its dual mandate of maximum employment and price stability, it may raise interest rates sooner than currently anticipated. Sources: The Conference Board Inc., Bloomberg, Reuters. U.S. GDP growth slows in Q4 and misses estimates, new home sales continue to rise The U.S. economy slowed in Q4, as GDP increased at a seasonally adjusted annual rate (SAAR) of 2.6% from Q3-2014 according to the first estimate from the U.S. Bureau of Economic Analysis. The figure was well below Q3-2014 growth of 5.0% and expectations of 3.2%. A second, more complete estimate of GDP will be released at the end of February 2015. According to the Thomson Reuters/University of Michigan Surveys of Consumers, consumer sentiment for January was revised downwards to 98.1 from the prior reading of 98.2, below estimates of 98.2 but higher than December’s final reading of 93.6. January’s initial reading of 98.2 was the highest level since January 2004. The survey is a gauge of how consumers feel the economic environment will change. Higher values represent a greater degree of confidence among consumers. U.S. sales of new homes for December 2014 were at a seasonally adjusted rate of 481,000, above the consensus estimate of 452,000, the revised November rate of 431,000 and the December 2013 rate of 442,000. In addition, December 2014’s figure was above the high end of the range of estimates compiled by Bloomberg. The median sale price of new homes sold during the month was US$298,100 and the average price was US$377,800. Sources: U.S. Bureau of Economic Analysis, U.S. Department of Commerce, Bloomberg. AGF and CGI report quarterly results AGF Management Ltd., one of Canada’s largest independent investment management firms with offices around the world, reported its Q4-2014 results with revenues from continuing operations decreasing 4.9% year over year to $111.7 million and earnings per share (EPS) from continuing operations increasing 75% to $0.14. The large increase in EPS was driven by lower amortization expenses. AGF’s EPS fell short of the consensus estimate of $0.16. AGF’s assets under management (AUM) increased 2.0% year over year to $35.1 billion. The company’s AUM was comprised of retail funds of $19.11 billion (down 2.5% year over year), institutional and subadvisory funds of $11.34 billion (up 4.3%), high-net-worth funds of $4.45 billion (up 12.1%) and alternative asset management funds of $210 million. During the quarter, retail fund redemptions improved 33.6% to $399 million. CGI Group Inc. reported Q1-2015 results with revenues declining 3.9% year over year to $2.54 billion, bookings increasing 52.7% to $4.3 billion and the backlog expanding 4.8% to $20.18 billion. The information technology and business process services firm’s adjusted EPS were $0.74, which was $0.01 below the consensus estimate but $0.14 above the year-ago quarter’s EPS. CGI’s net debt-tocapitalization ratio declined to 25.1% from 38.9%. CGI’s Board of Directors authorized the renewal of the company’s share buyback program with the purchase of up to an additional 10% of the company’s public float. 3 AGF WEEK IN REVIEW FOR THE WEEK ENDING JANUARY 30, 2015 Sources: AGF Management Ltd., CGI Group Inc., RBC Capital Markets, Bloomberg. Boeing reports strong Q4-2014 results and a bullish 2015 outlook; Qualcomm reduces forecast The Boeing Co., the world’s largest aerospace and defense manufacturer, released Q4-2014 results with a year-over-year increase in revenues of 3% to US$24.5 billion as a result of higher deliveries. Its adjusted earnings per share were US$2.31, easily surpassing the consensus estimate of US$2.10. Revenues in Boeing’s largest division, Commercial Airplanes, rose 15% to US$16.8 billion while revenues in the Defense, Space and Security division fell by 14% to US$7.6 billion. The company released its 2015 full-year adjusted revenue guidance of US$94.5-$96.5 billion and EPS guidance to US$8.20-$8.40. Analysts are projecting revenues of US$93.4 billion and EPS of US$8.65. The aircraft maker’s backlog swelled to a record US$502 billion and included net orders for the quarter of US$37 billion. During the quarter, Boeing delivered 35 Boeing 787 Dreamliners, up from 25 last year and 126 Boeing 737s, up from 110. Qualcomm Inc., a manufacturer of chipsets for mobile devices, reported Q1-2015 revenues of US$7.1 billion, a 7.2% year-over-year increase, beating expectations of US$6.9 billion. The company’s adjusted EPS were US$1.34, above the average estimate of US$1.25. However, Qualcomm downgraded its fullyear 2015 revenue guidance to US$26-$28 billion from US$26.8-$28.8 billion and its adjusted EPS guidance to US$4.75-$5.05 from US$5.05-$5.35. Meanwhile, for Q2-2015, the company expects revenues of US$6.5-$7.1 billion (with analysts expecting US$6.7 billion) and adjusted EPS of US$1.28$1.40 (with analysts predicting US$1.28). Sources: The Boeing Co., Qualcomm Inc., Bloomberg. Eurozone deflation rises, unemployment falls marginally, consumer confidence rises According to Eurostat, eurozone inflation was -0.6% in January, below -0.2% in December. Inflation was worse than the consensus estimate of -0.5%. The main driver of the fall in consumer prices was energy prices, which fell 8.9%, greater than the fall in the prior month of 6.3%. The European Central Bank targets inflation of just below 2%. Eurozone unemployment was 11.4% in December, a decline from 11.5% in November and better than expectations of no change. According to Eurostat, this is the lowest unemployment rate in the currency bloc since August 2012. The nations with the highest unemployment rates were Greece (25.8% in October 2014) and Spain (23.7%), while the nations with the lowest rates were Germany (4.8%) and Austria (4.9%). Eurozone consumer confidence increased in January to 101.2, slightly below expectations of 101.6. December’s reading was revised to 100.6. January’s consumer confidence was the highest since July 2014. Sources: Eurostat, CNBC. Northrop Grumman reports Q4-2014 earnings According to Northrop Grumman Corp.’s Q4-2014 earnings report, adjusted EPS reached US$2.26, an increase from the year-ago quarter’s US$2.00 and above the consensus estimate of US$2.25. Total sales 4 AGF WEEK IN REVIEW FOR THE WEEK ENDING JANUARY 30, 2015 of the aerospace and defense company declined by 0.8% to US$6.11 billion. Northrop Grumman’s backlog at the end of the quarter was US$38.2 billion, greater than the backlog of US$37.0 billion at the end of last year. For 2015, Northrop Grumman expects revenues of US$23.4-$23.8 billion and EPS of US$9.20-$9.50, while the prevailing consensus estimates were US$23.5 billion and US$9.11, respectively. Sources: Northrop Grumman Corp., The Wall Street Journal. 5 AGF WEEK IN REVIEW FOR THE WEEK ENDING JANUARY 30, 2015 The week ahead Canadian economic releases – Building permits (Jan.), unemployment (Jan.) U.S. economic releases – ISM manufacturing (Jan.), unemployment (Jan.) The commentaries and other information contained herein are provided as a general source of information based on information publicly available as of January 30, 2015 and should not be considered as a forecast, research, personal investment advice, recommendation or an offer or solicitation to buy, sell or hold any securities or other financial instruments. Every effort has been made to ensure the accuracy of the commentaries and other information at the time of publication. However, market conditions may change. In addition, the accuracy and completeness of the commentaries and other information contained herein cannot be guaranteed. The manager and its affiliates may from time to time invest in hold or sell securities or other financial instruments relating to companies or other entities referred to herein. Reliance on the commentaries and other information herein is at the sole discretion of the reader. The manager accepts no responsibility for individual investment decisions arising from or in any way based on the reader’s reliance on the commentaries and other information contained herein. Past performance may not be indicative of future results. 6 AGF WEEK IN REVIEW FOR THE WEEK ENDING JANUARY 30, 2015 Market data CANADIAN EQUITY INDEXES ($CDN) S&P/TSX Composite PR Index S&P/TSX Composite TR Index Energy TR Materials TR Industrials TR Consumer Disc. TR Consumer Staples TR Health Care TR Financials TR Information Technology TR Telecom Services TR Utilities TR S&P/TSX 60 TR Index MSCI Canadian Small Cap PR Index Close 14,673 44,836 3,683 2,706 3,039 2,570 4,789 3,022 3,506 209 2,384 3,921 2,116 331 Return (% ) Week YTD -0.7 0.3 -0.7 0.5 -0.2 -2.0 3.1 15.7 -0.7 -0.9 -0.1 0.1 3.8 3.0 1.7 18.8 -3.2 -5.4 0.7 5.5 -1.3 5.8 1.4 6.5 -0.8 0.6 -0.2 -1.0 WORLD EQUITY INDEXES (local) CAC 40 PR Index DAX 30 PR Index DJIA PR Index DJIA TR Index FTSE 100 PR Index FTSE 100 TR Index FTSE/Xinhua A200 Hang Seng PR Index Hang Seng TR Index MSCI EAFE TR Index MSCI Emerging Markets TR MSCI Europe TR Index MSCI Far East Free (ex-Japan) TR MSCI World TR Index MSCI World AC TR Index NASDAQ Composite PR Nikkei 225 PR Russell 2000 TR Russell 2000 Growth TR Russell 2000 Value TR S&P 500 PR Index S&P 500 TR Index Shanghai Comp PR Close 4,604 10,694 17,165 34,374 6,749 5,100 9,051 24,507 59,206 6,436 1,932 8,149 1,092 6,267 756 4,635 17,674 5,500 4,841 8,447 1,995 3,588 3,210 Return (CAD, % ) Week YTD 2.1 10.1 3.3 11.0 -0.3 5.5 -0.3 5.6 1.4 8.6 1.4 8.7 -2.4 4.4 1.2 13.8 1.2 13.8 2.4 10.1 -0.4 10.2 2.0 9.5 1.0 11.7 0.8 7.6 0.7 7.8 0.0 7.2 3.9 13.0 0.6 6.0 0.9 7.0 0.3 5.0 -0.2 6.1 -0.6 6.2 -2.1 7.9 Interest Rates Bank of Canada Overnight Lending Rate Bank of England Repo Rate European Central Bank Min bid rate at refi tender Federal Funds Target Rate 7 Current 0.75% 0.50% 0.05% 0.25% 1 YR 6.8 9.9 -6.5 2.8 21.8 28.8 51.1 29.4 10.2 32.9 20.3 20.0 11.9 -4.2 Annualized Return (% ) 3YR 5 YR 10 YR 5.7 5.8 4.8 8.9 8.8 7.8 0.6 2.8 6.0 -12.0 -2.4 5.8 23.3 19.7 12.7 29.6 19.1 9.1 33.3 23.0 10.4 47.0 51.6 18.5 14.9 11.9 8.7 21.3 -3.6 -0.9 16.6 19.3 11.7 7.6 9.9 8.9 9.8 8.8 8.3 -2.0 3.6 3.1 Annualized Return (CAD, % ) 1 YR 3YR 5 YR 10 YR 4.6 15.4 3.6 0.5 8.3 21.8 13.1 8.5 23.4 19.8 15.3 5.4 26.3 22.8 18.3 8.1 7.2 13.0 7.8 1.3 11.0 17.3 11.7 5.1 68.1 19.7 6.5 15.3 27.0 15.5 7.8 6.3 32.2 19.9 11.6 10.0 13.4 19.0 10.7 5.5 20.4 9.7 7.1 9.2 10.9 20.1 11.1 5.7 26.7 16.3 11.8 10.1 21.9 23.0 15.4 7.0 21.7 21.3 14.3 7.0 28.1 27.8 20.8 8.8 17.5 18.3 9.8 3.5 18.1 24.8 19.8 8.3 19.0 26.0 21.5 9.3 17.3 23.6 18.1 7.3 26.7 24.4 17.3 5.7 28.7 26.9 19.7 7.9 74.5 21.6 7.0 13.6 ECO_RELEASE_DT Next Meeting 04/03/2015 05/02/2015 05/03/2015 18/03/2015 52 wk high 52 wk low 15,685 13,450 47,242 40,044 4,834 3,271 2,893 2,156 3,193 2,445 2,579 1,948 4,789 3,137 3,032 1,839 3,821 3,109 209 151 2,415 1,912 3,921 3,244 2,196 1,856 400 312 52 wk high 52 wk low 4,679 3,789 10,811 8,355 18,103 15,341 36,210 30,023 6,905 6,073 5,187 4,558 18,144 5,575 25,363 21,138 60,784 49,338 7,135 6,124 2,197 1,791 9,286 7,728 1,150 954 6,520 5,722 792 691 4,815 3,946 18,031 13,885 5,750 4,934 5,009 4,225 8,927 7,792 2,094 1,738 3,627 2,676 3,407 1,974 AGF WEEK IN REVIEW FOR THE WEEK ENDING JANUARY 30, 2015 Total Ret (% ) Commodities ($US) Copper Corn Crude Oil Gold Natural Gas Nickel Platinum Soybeans Silver Wheat Zinc Bond Yields Canada 2 Year Treasuries 10 Year Treasuries 30 Year Treasuries ECB 2 Year Treasuries 10 Year Treasuries 30 Year Treasuries Japan 2 Year Treasuries 10 Year Treasuries 30 Year Treasuries US 2 Year Treasuries 10 Year Treasuries 30 Year Treasuries Currencies CAD / EURO CAD / USD CAD / UK POUND USD / AUSTRALIAN $ USD / BRAZIL REAL USD / EURO USD / MEXICAN PESO USD / UK POUND USD / YEN 8 Close 249 370 48 1,284 2.69 15,118 1,241 961 17.26 503 2,119 CPN Coupon 1.500 2.250 3.500 0.000 0.500 2.500 0.100 0.300 1.500 0.500 2.250 3.000 Close 0.70 0.79 0.52 1.29 2.68 0.89 14.98 0.66 117.49 Week -0.3 -4.3 5.8 -0.8 -9.9 5.7 -2.1 -1.2 -5.7 -5.1 1.5 MATURITY Maturity Date 01/02/2017 01/06/2025 01/12/2045 16/12/2016 15/02/2025 15/08/2046 15/02/2017 20/12/2024 20/12/2044 31/01/2017 15/11/2024 15/11/2044 Historical Prices YTD -11.7 -6.8 -9.4 8.6 -6.9 0.2 2.8 -5.7 10.2 -14.8 -2.3 1 YR 323 434 98 1,244 5.01 13,768 1,383 1,275 19.16 554 1,974 Current Price 102.20 109.67 139.15 100.35 101.96 142.09 n/a 0.27 1.27 100.10 105.48 116.86 Total Ret (% ) Week YTD -3.17 -2.21 -2.37 -8.81 -2.77 -5.50 1.81 5.28 3.98 0.95 -0.69 7.25 2.18 1.56 -0.48 3.44 -0.24 -1.88 1 YR 0.66 0.90 0.54 1.14 2.41 0.74 13.37 0.61 102.72 3YR 383 632 99 1,730 2.71 21,258 1,613 1,185 33.51 645 2,113 5 YR 305 357 73 1,081 5.13 18,447 1,505 914 16.21 474 2,090 10 YR 144 196 47 427 6.26 14,465 872 514 6.78 290 1,286 52 wk high 52 wk low 332 242 520 318 108 44 1,392 1,131 6.49 2.61 21,203 13,805 1,521 1,177 1,537 904 22.18 14.29 735 466 2,414 1,936 10 YR 0.62 0.81 0.43 1.29 2.65 0.77 11.25 0.53 103.28 52 wk high 52 wk low 0.73 0.64 0.94 0.78 0.57 0.52 1.29 1.05 2.76 2.18 0.90 0.71 15.06 12.82 0.67 0.58 121.85 100.76 Yield to Maturity 0.39 1.25 1.83 -0.19 0.30 0.95 n/a 0.27 1.27 0.45 1.64 2.22 Historical Prices 3YR 5 YR 0.76 0.67 1.00 0.93 0.64 0.58 0.94 1.13 1.75 1.90 0.76 0.72 12.98 13.10 0.64 0.63 76.35 90.27

© Copyright 2026