
ควอลิตี้เฮ้าส์ QH TB / QH.BK
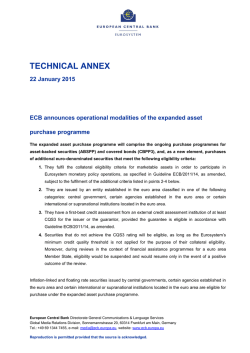
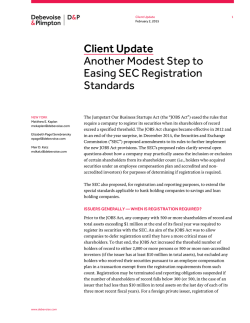
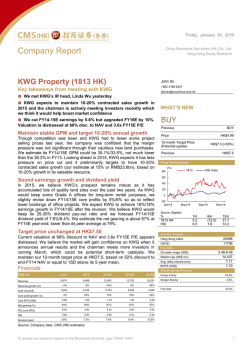
COMPANY UPDATE
ควอลิตี้เฮ้าส์
28 มกราคม 2558
QH TB / QH.BK
CEO คนใหม่เปิดบ้านบริษัท; ตั้งแผนธุรกิจปี 2558
เชิงรุก
Sector: Residential Property Neutral
คาแนะนาพื้นฐาน: ซื้อ
เป้าหมายพื้นฐาน: 4.80 บาท
ราคา (27/01/58): 3.96 บาท
Price chart
ประเด็นการลงทุน
วานนี้ CEO คนใหม่ ของ QH ดร.ชั ช ชาติ สิ ทธิ พั น ธุ์ ได้ ทาการเปิ ด
ตัวอย่างเป็นทางการต่อนักลงทุนและนักวิเคราะห์ละแถลงสาหรับปี 2558
โดย ดร.ชัชชาติมีแผนสาคัญคือการสร้างกาไรให้เติบโตในระยะยาว ซึ่ง
เราคิ ด ว่ า ต้ อ งใช้ เ วลาในการพิ สูจ น์ อย่ า งไรก็ ต าม นั ก วิ เ คราะห์ แ ละนั ก
ลงทุ น ต่ า งมี มุ ม มองเชิ ง บวกต่ อ ความมุ่ ง มั่ น ของ CEO ในครั้ ง นี้ โดย
เป้ า หมายรายได้ โ ครงการที่ อ ยู่ อ าศั ย ปี 2558 ของ QH นั้ น ตรงตาม
ประมาณการของเรา แต่สูงกว่าประมาณการตลาด 10% ขณะนี้หุ้นมีการ
ซื้อขายในระดับค่อนข้างถูกด้วย PER ปี 2558 ที่ 8.6 เท่า (ค่าเฉลี่ยกลุ่ ม
ภายใต้คาแนะนาของเราอยู่ที่ 10.5 เท่า) ซึ่งถูกที่สุดเป็นอันดับสามเมื่อ
เทีย บกั บหุ้ นกลุ่ม อสัง หาฯภายใต้ การวิเ คราะห์ข องเรา (หลั ง AP และ
SIRI) เรายังคงคาแนะนา ซื้อ ด้วยราคาเป้าหมาย ณ สิ้นปี 2558 คานวณ
จากวิธี SOTP ที่ 4.80 บาท อ้างอิงจาก PER กลุ่มที่ 11 เท่า (สู งกว่า
ค่ า เฉลี่ ย ปี 2549-2556 อยู่ 1 ส่ ว นเบี่ ย งเบนมาตรฐาน) และมู ล ค่ า การ
ลงทุนที่ 1.6 บาทต่อหุ้น
แผนธุรกิจเชิงรุกสาหรับปี 2558
QH ตั้งเป้ามูลค่าโครงการเปิดตัวใหม่ปี 2558 ที่อย่างต่า 33,000 ล้าน
บาท (30 โครงการ—คอนโด 53% และโครงการแนวราบ 47%; 82% ใน
พื้นที่กรุงเทพ และ 18% ในพื้นที่ต่างจังหวัด) โดยที่ดินทั้งหมดได้รับการ
ประกันเป็นที่แน่น อนแล้ว นอกจากนี้ บริ ษัทยังมีแผนเจรจาเข้าซื้อที่ดิ น
อีกแปดแปลงสาหรับโครงการแนวราบ ดังนั้น มูลค่าโครงการเปิดตัวใหม่
จึง มี แนวโน้ม อั พไซด์ ที่จ ะเพิ่ ม ขึ้ นเป็ น 40,000 ล้า นบาทได้ โครงการ
ระดับ ล่างถึงระดับกลางจะคิด เป็น 62% ของมูลค่ าเปิ ดตัว และมีแผน
เปิดตัวโครงการระดับไฮเอนด์เพียงแห่งเดียว ซึ่งคือโครงการคอนโด Q
สุขุมวิท ซอย 6 (เปิดตัวในเดือนมี.ค. มูลค่าโครงการ 9.4 พันล้านบาท)
QH ตั้งเป้ายอดจองซื้อที่ 24,000 ล้านบาท เพิ่มขึ้น 25% (แบ่งเป็น
โครงการแนวราบ 75% และคอนโด 25%; 76% ในพื้นที่กรุงเทพ และ
24% ในพื้นที่ต่างจังหวัด)
เราคาดบริ ษั ท จะสามารถบรรลุ ย อดจองซื้ อ คอนโด ปี 2558 ที่ 6.7
พันล้านบาทได้ (เพิ่มขึ้น 59% YoY) อ้างอิงจากสมมติฐานอัตราจองซื้อ
เฉลี่ ยที่ เพีย ง 38% สาหรั บคอนโดสิ บแห่ งด้ วยมู ลค่ าโครงการเปิ ดตั ว
18,000 ล้านบาท (ปี 2557 มูลค่าโครงการเปิดตัวอยู่ที่เพียง 8 พันล้าน
บาท) QH มองว่าอัตราจองซื้อสาหรับคอนโด Q สุขุมวิทจะอยู่ที่ 16%
(มีราคาขายที่ 280,000-300,000 บาทต่อตารางเมตร) เรามองว่ามีความ
เป็นไปได้ที่บริษัทจะสามารถบรรลุเป้ายอดจองซื้อโครงการทาวน์เฮ้าส์ที่
5.6 พันล้านบาทได้จากฐานที่ต่าในปี 2557 ซึ่งคิดเป็นเพียง 4.1 พันล้าน
บาท แต่ โอกาสที่จะบรรลุเ ป้ายอดจองซื้อ โครงการบ้ านเดียวที่ 13,000
ล้านบาท ซึ่งเพิ่มขึ้นถึง 16% YoY นั้นดูค่อนข้างท้าทาย
Price
Bt
5
Rel. to SET
Rel. Idx
150
4
100
3
50
2
01/14
0
03/14
05/14
07/14
Share price perf. (%)
Relative to SET
Absolute
09/14
1M
2.1
8.2
11/14
01/15
3M
(9.8)
(7.0)
12M
27.8
51.1
Key statistics
Market cap
12-mth price range
12-mth avg daily volume
# of shares (m)
Est. free float (%)
Foreign limit (%)
Consensus
rating
%
100
80
60
40
20
0
Buy
74
Hold
15
11
Sell
Bt36.4bn
Bt2.5/Bt4.5
Bt148m
9,184
62.8
40.0
USD1.1bn
USD4.6m
BLS Target price BLS earnings
vs. Consensus
vs. Consensus
Bt
4.8
4.8
4.8
4.8
4.7
4.7
1
BLS
Cons.
BLS
Cons.
Btm
5000
4000
3000
2000
1000
0
BLS
Cons.
14E 15E
Financial summary
FY Ended 31 Dec
2013
Revenues (Btm)
19,699
Net profit (Btm)
3,307
EPS (Bt)
0.36
EPS growth (%)
+35.0%
Core profit (Btm)
3,195
Core EPS (Bt)
0.35
Core EPS growth (%) +90.6%
PER (x)
7.3
PBV (x)
1.4
Dividend (Bt)
0.2
Dividend yield (%)
6.1
ROE (%)
20.0
2014E 2015E 2016E
21,148 25,172 28,685
3,481
4,213
4,846
0.38
0.46
0.53
+5.2% +21.0% +15.0%
3,481
4,213
4,846
0.38
0.46
0.53
+8.9% +21.0% +15.0%
10.4
8.6
7.5
1.9
1.7
1.5
0.2
0.2
0.2
4.3
5.2
6.0
19.0
20.4
20.7
CG rating
นฤมล เอกสมุทร
นักวิเคราะห์การลงทุนปัจจัยพื้นฐานด้านหลักทรัพย์
[email protected]
+66 2 618 1345
See disclaimer at the end of report
เป้าหมายการเติบโตของรายได้สูงแต่น่าจะมีโอกาสบรรลุได้
QH แนะรายได้โครงการที่อยู่อาศัยสาหรับปี 2557 ที่ 20,800 ล้านบาท เพิ่มขึ้น 12% YoY (สูง
กว่ า เป้ า ที่ บ ริ ษั ทตั้ ง ไว้ ที่ 19,400 ล้ า นบาทอยู่ 7%) และตั้ ง เป้ า รายได้ ปี 2558 ที่ 24,000 ล้ า
นบาท เพิ่มขึ้น 20% YoY สอดคล้องกับประมาณการของเรา ขณะนี้ QH มียอดจองซื้อคอนโด
มูลค่า 5.5 พันล้านบาทที่รอโอนในปี 2558 ซึ่ งประกันประมาณการรายได้ โครงการที่อยู่อาศั ย
ของเรา 23% โดยหกโครงการคอนโดมูลค่า 9.8 พันล้านบาทมีกาหนดเสร็จและเริ่มโอนในปี
2558 (แปรีย บเทีย บกั บมู ลค่ า ที่เ สร็ จมู ลค่ า 5 พัน ล้า นบาทในปี 2557) ซึ่ งได้แ ก่ The Trust
นครปฐม กาหนดโอนไตรมาส 1/58, The Trust งามวงศ์วานและพัทยาใต้ กาหนดโอนไตรมาส
2/58 และโครงการ Q อโศก, Casa คอนโดดอยสุเทพ และ The Trust อมตะนคร กาหนดโอน
ไตรมาส 4/58
มีแผนเพิ่มประสิทธิภาพ
อัตรากาไรขั้นต้น ของอสังฯ เพิ่อขายตั้งเป้าหมายเพิ่มขึ้นจาก 33% สาหรับปี 2557 เป็น 34%
สาหรับปี 2558 หนุนจากอัตรากาไรขั้นต้นโครงการทาวน์เฮาส์ คอนโด ที่ดีอยู่แล้วและโครงการ
บ้านเดี่ยวใหม่ที่น่าจะดีกว่าเดิม (อัตรากาไรขั้นต้นของโครงการบ้านเดี่ยวในปัจจุบันโดยเฉพาะใน
โครงการแถบน้าท่วมมีอัตรากาไรขั้นต้น ที่ไม่สูงนัก) โดยโครงการใหม่มีอัตรากาไรขั้นต้นในช่วง
32-35% นอกจากนี้ ดร.ชั ช ชาติ ยั ง มี แ ผนจะลดสั ด ส่ ว นค่ า ใช้ จ่ า ยในการขายและบริ ห ารต่ อ
ยอดขายจาก 18% ในปี 2557 ลงอีกด้วย ทั้งนี้ บริษัทยังตั้งเป้า ส่วนหนี้สินที่มีภาระดอกเบี้ยต่อ
ทุนสุทธิ ไม่เกิน 1.2 เท่ า ณ สิ้ นปี 2558 แม้ง บลงทุน ทั้งหมดจะอยู่ที่ 16,000 ล้านบาทในปี นี้
(แบ่งเป็นงบเพื่อการเข้าซื้อที่ดิน 6 พันล้านบาท และเพื่อการก่อสร้าง 10,000 ล้านบาท)
ควอลิตี้เฮ้าส์ - 2
QH : Financial Tables – Year
PROFIT & LOSS (Btm)
Revenue
Cost of sales and services
Gross profit
SG&A
EBIT
Interest expense
Other income/exp.
EBT
Corporate tax
After-tax net profit (loss)
Minority interest
Equity earnings from affiliates
Extra items
Net profit (loss)
Reported EPS
Fully diluted EPS
Core net profit
Core EPS
EBITDA
KEY RATIOS
Revenue growth (%)
Gross margin (%)
EBITDA margin (%)
Operating margin (%)
Net margin (%)
Core profit margin (%)
ROA (%)
ROCE (%)
Asset turnover (x)
Current ratio (x)
Gearing ratio (x)
Interest coverage (x)
BALANCE SHEET (Btm)
Cash & Equivalent
Accounts receivable
Inventory
PP&E-net
Other assets
Total assets
Accounts payable
ST debts & current portion
Long-term debt
Other liabilities
Total liabilities
Paid-up capital
Share premium
Retained earnings
Shareholders equity
Minority interests
Total Liab.&Shareholders' equity
CASH FLOW (Btm)
Net income
Depreciation and amortization
Change in working capital
FX, non-cash adjustment & others
Cash flows from operating activities
Capex (Invest)/Divest
Others
Cash flows from investing activities
Debt financing (repayment)
Equity financing
Dividend payment
Others
Cash flows from financing activities
Net change in cash
Free cash flow (Btm)
FCF per share (Bt)
KEY ASSUMPTIONS
Total presales (Btm)
YoY change in presales
Housing revenue (Btm)
YoY change in housing revenue
Secured revenue by backlogs (Btm)
% of secured revenue by backlogs
2012
2013
2014E
2015E
2016E
13,077 19,699 21,148 25,172 28,685
(9,027) (13,312) (14,097) (16,623) (18,886)
4,049
6,387
7,051
8,549
9,800
(2,715) (3,459) (3,758) (4,505) (5,140)
1,334
2,928
3,294
4,044
4,660
(295)
(228)
(289)
(302)
(314)
149
160
160
160
160
1,188
2,860
3,165
3,902
4,505
(313)
(608)
(764)
(925) (1,064)
875
2,252
2,401
2,978
3,442
0
0
0
0
0
802
943
1,080
1,236
1,404
774
112
0
0
0
2,450
3,307
3,481
4,213
4,846
0.27
0.36
0.38
0.46
0.53
0.27
0.36
0.38
0.46
0.53
1,676
3,195
3,481
4,213
4,846
0.18
0.35
0.38
0.46
0.53
1,550
3,099
3,505
4,256
4,871
32.8
31.0
11.9
10.2
18.7
12.8
6.1
6.6
0.3
0.0
1.4
4.5
50.6
32.4
15.7
14.9
16.8
16.2
7.9
8.7
0.5
0.0
1.2
12.8
7.4
33.3
16.6
15.6
16.5
16.5
8.1
8.9
0.5
0.0
1.1
11.4
19.0
34.0
16.9
16.1
16.7
16.7
9.2
10.1
0.6
0.0
1.0
13.4
14.0
34.2
17.0
16.2
16.9
16.9
10.0
10.9
0.6
0.0
0.8
14.8
1,650
88
21,697
7,915
10,521
41,871
805
7,352
15,012
2,907
26,076
9,184
528
6,166
15,795
0
41,871
1,630
91
22,558
6,581
10,792
41,652
882
4,308
16,012
3,172
24,374
9,184
303
7,729
17,277
0
41,652
1,047
98
23,048
8,601
11,560
44,355
882
5,000
16,012
3,172
25,066
9,184
303
9,740
19,289
0
44,355
1,256
117
25,600
8,601
11,481
47,054
934
5,000
16,012
3,172
25,119
9,184
303
12,387
21,935
0
47,054
1,235
133
28,801
8,601
11,401
50,171
1,102
5,000
16,012
3,172
25,286
9,184
303
15,337
24,885
0
50,171
2,450
216
(3,138)
(1,210)
(1,682)
(85)
2,425
2,340
(43)
0
(78)
2,425
(121)
536
(1,767)
(0.19)
2012
16,600
36%
11,984
36%
0
0%
3,307
171
1,525
(1,719)
3,284
232
269
501
(2,060)
0
(1,745)
269
(3,805)
(19)
3,516
0.38
2013
20,400
23%
18,477
54%
0
0%
3,481
212
(1,266)
0
2,426
(2,232)
0
(2,232)
692
0
(1,469)
0
(777)
(583)
194
0.02
2014E
21,400
5%
20,009
8%
20,009
100%
4,213
212
(2,439)
0
1,986
(212)
0
(212)
0
0
(1,566)
0
(1,566)
208
1,775
0.19
2015E
24,610
15%
23,972
20%
5,500
23%
4,846
212
(2,970)
0
2,087
(212)
0
(212)
0
0
(1,896)
0
(1,896)
(20)
1,876
0.20
2016E
28,302
15%
27,472
15%
n.a.
n.a.
Revenue growth and asset turnover
Revenue growth (%) (LHS)
Asset turnover (x) (RHS)
%
60
x
0.7
0.6
0.5
0.4
0.3
0.2
0.1
0.0
40
20
0
(20)
(40)
14E 15E 16E
A/C receivable & A/C payable days
days
AR / Sales (days)
AP / Cost of Goods (days)
35
30
25
20
15
10
5
0
14E
15E
16E
15E
16E
Profit margins
Gross margin (%)
EBIT margin (%)
%
40
30
20
10
0
14E
Capital expenditure
Capex (Bt,bn)
Capex / Net PPE (%)
Bt,bn
%
2.5
2.0
1.5
1.0
0.5
0.0
14E 15E 16E
(0.5)
30
25
20
15
10
5
0
(5)
(10)
Debt serviceability
(ST debt + Interest) / EBITDA
(Debt + Interest) / EBITDA
x
35
30
25
20
15
10
5
0
14E
15E
16E
Dividend payout
Dividend (Bt)
Payout ratio (%)
Bt/Shr
0.25
0.21
0.16 0.17
0.20
0.15
%
0.24
0.12
0.12
0.10
0.05
0.00
0.00
60
50
40
30
20
10
0
14E 15E 16E
ควอลิตี้เฮ้าส์ - 3
QH : Financial Tables – Quarter
QUARTERLY PROFIT & LOSS (Btm)
Revenue
Cost of sales and services
Gross profit
SG&A
EBIT
Interest expense
Other income/exp.
EBT
Corporate tax
After-tax net profit (loss)
Minority interest
Equity earnings from affiliates
Extra items
Net profit (loss)
Reported EPS
Fully diluted EPS
Core net profit
Core EPS
EBITDA
3Q13
5,306
(3,573)
1,734
(859)
875
(53)
37
859
(183)
676
0
206
0
882
0.10
0.10
882
0.10
928
4Q13
4,980
(3,322)
1,658
(1,073)
585
(61)
45
569
(112)
457
0
270
0
727
0.08
0.09
727
0.08
751
1Q14
4,069
(2,766)
1,303
(770)
533
(56)
35
512
(112)
400
0
232
0
632
0.07
0.07
632
0.07
586
2Q14
5,674
(3,795)
1,878
(937)
941
(61)
39
920
(198)
721
0
258
0
979
0.11
0.12
979
0.11
998
3Q14
6,429
(4,380)
2,049
(993)
1,056
(81)
43
1,018
(215)
803
0
267
0
1,070
0.12
0.13
1,070
0.12
1,117
Revenue trend
Revenue (Bt,bn) (LHS)
Revenue growth (% YoY)
Bt,bn
140
120
100
80
60
40
20
0
(20)
1Q13
3Q13
1Q14
QUARTERLY BALANCE SHEET (Btm)
Cash & Equivalent
Accounts receivable
Inventory
PP&E-net
Other assets
Total assets
Accounts payable
ST debts & current portion
Long-term debt
Other liabilities
Total liabilities
Paid-up capital
Share premium
Retained earnings
Shareholders equity
Minority interests
Total Liab.&Shareholders' equity
KEY STATS
Total presales (Btm)
YoY change in presales
Housing revenue (Btm)
YoY change in housing revenue
Housing GM
Rental revenue (Btm)
32.7
17.5
16.5
16.6
16.6
1.8
21.3
8.6
2.7
1.3
16.5
33.3
15.1
11.8
14.6
14.6
1.9
16.8
7.0
3.3
1.2
9.7
32.0
14.4
13.1
15.5
15.5
2.0
14.1
5.6
2.2
1.3
9.5
33.1
17.6
16.6
17.3
17.3
2.0
21.7
8.4
2.3
1.4
15.5
31.9
17.4
16.4
16.6
16.6
2.0
23.1
8.9
2.3
1.4
13.1
1,506
75
23,028
854
15,359
40,822
836
6,756
14,038
2,623
24,253
9,184
379
6,475
16,569
0
40,822
1,630
91
22,558
854
16,519
41,652
882
4,308
16,039
3,145
24,374
9,184
379
7,117
17,277
0
41,652
1,775
71
21,988
905
20,383
45,122
848
8,001
15,144
3,208
27,201
9,184
0
7,749
17,922
0
45,122
1,893
68
22,184
932
21,752
46,828
973
7,955
17,145
2,671
28,744
9,184
379
7,902
18,084
0
46,828
1,700
74
22,185
995
23,042
47,996
1,034
7,594
17,942
2,916
29,485
9,184
379
8,328
18,510
0
47,996
3Q13
4,400
-21%
5,000
68.3
33%
306
4Q13
3,500
-1%
4,661
3.0
33%
319
1Q14
4,300
-41%
3,799
25.2
32%
269
2Q14
0
-100%
5,433
(6.0)
33%
241
3Q14
0
-100%
6,163
23.3
32%
266
3Q14
Revenue trend (accumulated)
Accum. Revenue (Bt,bn)
% of FY Revenue
Bt,
bn
25
%
120
100
80
60
40
20
0
100
20
76
75
15
48
10
46
17
19
5
KEY RATIOS
Gross margin (%)
EBITDA margin (%)
Operating margin (%)
Net margin (%)
Core profit margin (%)
BV (Bt)
ROE (%)
ROA (%)
Current ratio (x)
Gearing ratio (x)
Interest coverage (x)
%
7.0
6.0
5.0
4.0
3.0
2.0
1.0
0.0
0
1Q13
3Q13
1Q14
3Q14
Net profit trend (accumulated)
Accum. Profit (Bt,m)
% of FY Profit
Bt,m
3,500
3,000
2,500
2,000
1,500
1,000
500
0
%
120
100
80
60
40
20
0
100
78
77
51
46
18
18
1Q13
3Q13
1Q14
3Q14
Gross profit margin
FY GPM (%)
Gross margin (%)
%
35
32
29
26
23
20
1Q13
3Q13
1Q14
3Q14
EBIT margin
FY EBIT margin (%)
EBIT margin (%)
%
20
15
10
5
0
1Q13
3Q13
1Q14
3Q14
Company profile
Quality Houses Plc is a leading upper-mid to high-end housing developer. The firm uses the pre-built model. In 2H10, QH expanded into to the low-end segment
with a presales model. The firm builds SDHs, THs and condominiums. QH has recurring revenue from: 1) four serviced apartment buildings (Centre Point
Petchburi, Sukhumvit 10, Silom, Langsuan, and Saladang) and 2) three office buildings (Q.House Sathorn, Q.House Asoke and Q.House Convent). Its brands are
Prukpirom, Laddarom, Vararom and Casa. Furthermore, QH has a 20% stake in HMPRO, 26% in QH Property Fund (QHPF) and 22% in LHBANK.
ควอลิตี้เฮ้าส์ - 4
Figure 1 : Total project launches, by category
Btm
condo
low-rise
35,000
Figure 2 : Total project launches, by quarter
+40% at
minimum
2015e
Btm
20,000
30,000
25,000
15,000
20,000
10,000
15,000
10,000
5,000
5,000
0
0
2015e
Figure 3 : New launch breakdown—Bangkok and upcountry
Upcountry
of total
launch
Bangkok
10%
21%
82%
3Q
4Q
Figure 4 : New launch contribution, by segment
18%
15%
19%
24%
High
38%
90%
75%
2Q
of total
launch
100%
100%
18%
1Q
79%
82%
75%
24%
46%
50%
50%
Mid
53%
37%
57%
25%
25%
40%
0%
Low
25%
23%
0%
2015e
Figure 5 : QH’s presales profile
Btm
condo
2015e
Figure 6 : Residential GM comparisons
low-rise
25,000
+25% at
minimum
Btm
condo
low-rise
25,000
20,000
20,000
15,000
15,000
10,000
10,000
5,000
5,000
+20%
0
0
2014e
2014e
2015e
Figure 7 : Condo construction completion
Figure 8 : Gross margin comparison with coverage mean
2015e
Btm
2015e
QH
Sector mean
38.0%
5,000
36.0%
4,000
34.0%
3,000
32.0%
2,000
30.0%
28.0%
1,000
3Q14
4Q14e
2Q14
1Q14
4Q13
3Q13
2Q13
1Q13
4Q12
3Q12
2Q12
4Q
1Q12
3Q
4Q11
2Q
3Q11
1Q
2Q11
0
1Q11
26.0%
Sources: Company data, Bualuang Research
ควอลิตี้เฮ้าส์ - 5
Regional Comparisons
Bloomberg
Ananda Development
AP (Thailand)
Land and Houses
L.P.N. Development
Pruksa Real Estate
Quality Houses
Raimon Land
SC Asset Corporation
Sansiri
Supalai
Simple average
Code
ANAN TB
AP TB
LH TB
LPN TB
PS TB
QH TB
RML TB
SC TB
SIRI TB
SPALI TB
Price Market Cap
PER (x)
EPS Growth (%)
(US$
equivalent) 2014E 2015E
379
10.2
9.3
605
7.7
7.0
3,196
13.3
14.6
976
15.7
11.4
2,208
10.8
9.7
1,118
10.4
8.6
227
6.8
6.3
409
10.3
8.6
750
7.9
8.3
1,309
10.1
8.9
10.3
9.3
(local curr.)
THB3.70
THB6.25
THB9.45
THB21.50
THB32.25
THB3.96
THB2.06
THB3.58
THB1.77
THB24.80
PER band versus SD (next 12 months)
2014E
48.5
15.3
9.9
-12.7
13.9
5.2
83.7
24.3
10.6
46.7
24.5
PBV (x)
ROE (%)
Div Yield (%)
2015E 2014E 2015E 2014E 2015E 2014E 2015E
10.2
1.8
1.5
18.8
17.8
2.0
2.2
9.3
1.2
1.1
16.9
16.2
4.2
4.6
-8.8
2.5
2.4
21.7
17.1
5.9
5.5
38.4
3.1
2.6
20.1
24.7
3.3
4.4
12.3
2.4
2.1
24.2
23.0
3.0
3.4
21.0
1.9
1.7
19.0
20.4
4.3
5.2
9.1
1.7
1.4
42.0
31.1
4.7
5.1
19.6
1.2
1.1
11.8
13.2
4.0
4.8
-4.9
1.0
1.0
15.2
11.8
6.3
6.6
12.5
2.4
2.0
26.8
25.4
4.2
4.7
11.9
1.9
1.7
21.7
20.1
4.2
4.6
PBV band versus SD (next 12 months)
x
x
2.5
20
16
+2.0 SD = 15.1x
12
+1.0 SD = 11.9x
+0.5 SD = 10.4x
LT-average = 8.8x
8
+2.0 SD = 1.9x
2.0
+1.0 SD = 1.5x
1.5
LT-average = 1.2x
1.0
-0.5 SD = 1.0x
-1.0 SD = 0.8x
0.5
-2.0 SD = 0.4x
-1.0 SD = 5.6x
4
-2.0 SD = 2.5x
0
YE05 YE06 YE07 YE08 YE09 YE10 YE11 YE12 YE13 YE14 YE15
PER band and share price
0.0
YE05 YE06 YE07 YE08 YE09 YE10 YE11 YE12 YE13 YE14 YE14
PBV band and share price
Bt
6.0
16x
14x
Bt
7.0
5.0
4.0
12x
6.0
2.5x
10x
5.0
2.0x
8x
4.0
3.0
1.5x
1
3.0
5x
2.0
1.0x
2.0
0
0.8x
0.5x
1.0
1.0
0.0
YE05 YE06 YE07 YE08 YE09 YE10 YE11 YE12 YE13 YE14 YE15
0.0
YE05 YE06 YE07 YE08 YE09 YE10 YE11 YE12 YE13 YE14 YE14
%
Short selling activities during past four weeks
QH
Property
40
31.8
30
20
10
0
8/14
9/14
10/14
11/14
12/14
1/15
Btm
4
3
2
1
0
22/12/14
24/12/14
26/12/14
28/12/14
30/12/14
1/1/15
3/1/15
5/1/15
7/1/15
9/1/15
11/1/15
13/1/15
15/1/15
17/1/15
19/1/15
21/1/15
23/1/15
25/1/15
27/1/15
Foreign holding
ควอลิตี้เฮ้าส์ - 6
Bualuang Securities Public Company Limited
DISCLAIMER
BUALUANG SECURITIES PUBLIC COMPANY LIMITED (BLS) is a subsidiary of BANGKOK BANK PUBLIC COMPANY LIMITED (BBL). This document
is produced based upon sources believed to be reliable but their accuracy, completeness or correctness is not guaranteed. The statements or
expressions of opinion herein were arrived at after due and careful consideration to use as information for investment. Expressions of opinion contained
herein are subject to change without notice. This document is not, and should not be construed as, an offer or the solicitation of an offer to buy or sell
any securities. The use of any information shall be at the sole discretion and risk of the user.
BUALUANG SECURITIES PUBLIC COMPANY LIMITED MAY BE IN RELATIONSHIP WITH THE SECURITIES IN THIS REPORT. “Opinions,
projections and other information contained in this report are based upon sources believed to be accurate including the draft prospectus, but no
responsibility is accepted for any loss occasioned by reliance placed upon the contents hereof. Bualuang Securities Public Company Limited may from
time to time perform investment, advisory or other services for companies mentioned in this report, as well as dealing (as principal or otherwise) in, or
otherwise being interested in, any securities mentioned herein, This report does not constitute a solicitation to buy or sell any securities”. Investors
should carefully read details in the prospectus before making investment decision.
BUALUANG SECURITIES PUBLIC COMPANY LIMITED MAY ACT AS MARKET MAKER AND ISSUER OF DWs, AND ISSUER OF STRUCTURED
NOTES ON THESE SECURITIES. The company may prepare the research reports on those underlying securities. Investors should carefully read the
details of the derivative warrants and structured notes in the prospectus before making investment decisions.
BUALUANG SECURITIES PUBLIC COMPANY LIMITED IS OR MAY BE A UNDERWRITER/CO-UNDERWRITER/JOINT LEAD IN RESPECT OF THE
INITIAL PUBLIC OFFERING (“IPO”) OF SECURITIES.
Lead underwriter/
Underwriter/
Co-underwriter
Financial Advisor
PLANB
PLANB
Score Range
Score Range
Description
90 – 100
Excellent
80 – 89
Very Good
70 – 79
Good
60 – 69
Satisfactory
50 – 59
Below 50
Pass
No logo given
N/A
CORPORATE GOVERMANCE REPORT DISCLAIMER
This research report was prepared by Bualuang Securities Public Company Limited and refers to research prepared by Morgan Stanley. Morgan Stanley
does not warrant or guarantee the accuracy or completeness of its research reports. Morgan Stanley reserves copyright and other proprietary rights in
the material reproduced in this report. Morgan Stanley is under no obligation to inform Bualuang Securities or you if the views or information referred to
or reproduced in this research report change.
Corporate Governance Report disclaimer
The disclosure of the survey result of the Thai Institute of Directors Association (“IOD”) regarding corporate governance is made pursuant to the policy
of the Office of the Securities and Exchange Commission. The survey of the IOD is based on the information of a company listed on the Stock
Exchange of Thailand and the Market for Alternative Investment disclosed to the public and able to be accessed by a general public investor. The
result, therefore, is from the perspective of a third party. It is not an evaluation of operation and is not base on inside information.
The survey result is as of the date appearing in the Corporate Governance Report of Thai Listed Companies. As a result, the survey result may be
changed after that date. Bualuang Securities Public Company Limited does not conform nor certify the accuracy of such survey result.
BUALUANG RESEARCH – RECOMMENDATION FRAMEWORK
STOCK RECOMMENDATIONS
SECTOR RECOMMENDATIONS
BUY: Expected positive total returns of 15% or more over the next 12
months.
HOLD: Expected total returns of between -15% and +15% over the next 12
months.
SELL: Expected negative total returns of 15% or more over the next 12
months.
TRADING BUY: Expected positive total returns of 15% or more over the next
3 months.
OVERWEIGHT: The industry, as defined by the analyst's coverage universe, is
expected to outperform the relevant primary market index over the next 12 months.
NEUTRAL: The industry, as defined by the analyst's coverage universe, is
expected to perform in line with the relevant primary market index over the next 12
months.
UNDERWEIGHT: The industry, as defined by the analyst's coverage universe, is
expected to underperform the relevant primary market index over the next 12
months.
ควอลิตี้เฮ้าส์ - 7

© Copyright 2026