
INSIDE OIL - Thomson Reuters
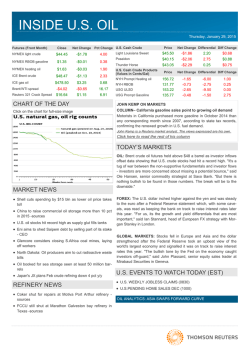
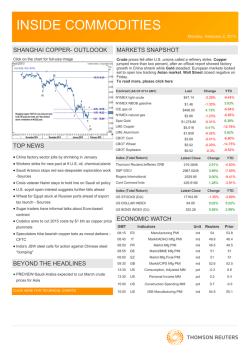
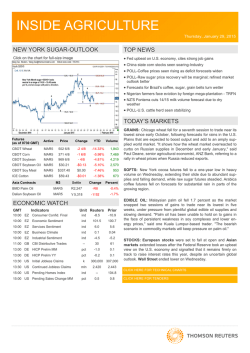
INSIDE OIL Thursday, January 29, 2015 Futures (Front month) Price Net Change Pct change Asia Cash Prices NYMEX light crude $44.45 -$1.78 -4.0% Dubai Crude NYMEX RBOB gasoline $1.3450 -$0.0051 -0.4% Tokyo Naphtha (Ts) NYMEX heating oil $1.6318 -$0.0310 -1.9% Gasoline (92 RON) ICE Brent crude $48.47 -$1.13 -2.3% Diesel (0.5 pct) ICE gas oil $478.50 $3.25 0.7% Jet-Kerosene DME Oman crude $47.20 -$0.45 -1.0% NYMEX Natgas $2.842 -$0.139 -4.9% CHART OF THE DAY Click on the chart for full-size image Fuel Oil (180 cst) Fuel Oil (380 cst) Price $44.95 $446.50 $54.50 $60.38 $63.77 $283.13 $273.13 Net Change Differential $1.25 $14.00 $1.70 $0.53 $1.13 $7.70 $6.57 2.37 7.50 7.05 -1.10 -0.03 1.50 0.72 Diff Change $1.02 $0.00 $0.15 -$0.10 $0.19 $0.12 -$0.39 OIL ANALYTICS: CHINA CRUDE OIL FLOWS ASSESSMENT; 30-31 MILLION MT China crude weekly: Jan imports pegged steady on-month at 30-31 mln mt By Royston Huan and Emma Li Thomson Reuters Oil Research & Forecasts maintained our estimates of crude oil flows into China for January at 30-31 million tonnes, steady to December’s imports at 30.37 million mt. To read more click here TODAY’S MARKETS MARKET NEWS Barclays, Goldman forecast bearish first half for oil prices Woodside Consortium accused of holding back China gas: AFR report Pertamina grappling with Indonesia's changing fuel demand U.S. oil stocks hit record high as supply glut fills tanks China’s oil demand to grow 3 percent in 2015: research POLL-U.S. natural gas weekly EIA stock draw seen at 113 bcf N Dakota: Oil producers to cut radioactive waste bills China to stop approving coal projects in eastern regions - association OIL: Oil prices opened up weak on Thursday in Asia after record U.S. stockpiles sent it tumbling to near six year lows in the previous session, and analysts said that the outlook remained weak. "The market expects stockpiles to keep rising, pushing front-month prices further down as refineries enter maintenance season and are likely run at lower utilisation rates," ANZ said in a morning note on Thursday. FOREX: The New Zealand dollar slumped to four-year lows as investors priced in a greater chance of rate cuts there, while U.S. dollar bulls focused on the positive in the Federal Reserve's latest policy statement. "For the NZ dollar, a further repricing of RBNZ rate expectations will imply a period of under performance against the G10 crosses, especially given that a number of markets have already undergone a significant repricing of policy expectations in recent months," JPMorgan analyst Sally Auld said. GLOBAL MARKETS: Asian shares retreated after the Federal Reserve unexpectedly lifted its view on the economy, signalling that the U.S. central bank remains firmly on track with plans to raise interest rates this year. "The markets were a bit surprised that the Fed was more hawkish than expected, especially considering that many people had thought that the board members this year would be more dovish than last year's," said Hideyuki Ishiguro, senior strategist at Okasan Securities. Kuwait cuts diesel fuel prices after political pressure EVENTS TO WATCH TODAY (GMT) BEYOND THE HEADLINES GERMANY UNEMPLOYMENT RATE JAN (0855) COLUMN-Crude oil decline cuts both ways for miners COLUMN-California gasoline sales point to growing oil demand EURO ZONE MONEY SUPPLY DEC (0900) EURO ZONE ECONOMIC SENTIMENT JAN (1000) EURO ZONE CONSUMER CONFIDENCE JAN (1000) GERMANY CONSUMER PRICES JAN (1300) OIL ANALYTICS: ASIA SWAPS FORWARD CURVE U.S. WEEKLY JOBLESS CLAIMS (1330) CLICK HERE FOR TECHNICAL CHARTS U.S.PENDING HOME SALES DEC (1500) INSIDE OIL January 29, 2015 OIL ANALYTICS: ASIA SWAPS FORWARD CURVE (1630 UKT) ICE BRENT FUTURES FORWARD ICE Brent Fut. Fwd Curve 1M DUBAI SWAPS FORWARD CURVE 1M - 1Y 1M Yield 59.59 Dubai Swaps Fwd Curve 55.00 50.00 50.00 .12 .12 1M 3M 4M 5M 6M 7M 8M 9M 10M 1Y 1M FO180 FOB CARGO SG FWD CURVE FO180 FOB Cargo SG Fwd Curve 3M 4M 5M 6M 7M 8M 9M 10M 1Y 1M FO3.5% BARGES ARA FORWARD CURVE 1M - 11M Yield 308.25 FO3.5% Barges ARA Fwd Curve 300.00 .12 3M 9M .12 11M 2M 3M FO380 FOB CARGO SG FORWARD CURVE FO380 FOB Cargo SG Fwd Curve 2M - 3M Yield 280.25 260.00 290.00 1M 1M - 1Y 1M Yield 55.91 55.00 NAPHTHA CFR JAPAN FORWARD CURVE 2M - 3M Yield 300.50 Naphtha CFR Japan Fwd Curve 4M - 4M Yield 474.50 290.00 460.00 280.00 440.00 .12 .12 2M 3M 4M 2 INSIDE OIL January 29, 2015 OIL ANALYTICS: ASIA SWAPS FORWARD CURVE (1630 UKT) NAPHTHA CIF NWE FORWARD CURVE Naphtha CIF NWE Fwd Curve NAPHTHA FOB SG FWD CURVE 2M - 3M Yield 451.50 440.00 Naphtha FOB SG Fwd Curve 420.00 48.00 .12 .12 2M 3M 1M ICE GO FUT. FWD CURVE ICE GO Fut. Fwd Curve 3M 4M 5M 6M 7M GO FOB CARGO SG FORWARD CURVE 4M - 4M Yield 537.00 520.00 GO FOB Cargo SG Fwd Curve 1M - 7M Yield 68.49 68.00 64.00 500.00 480.00 .12 .12 1M 4M JET FUEL FOB CARGO SG FWD CURVE Jet Fuel FOB Cargo SG Fwd Curve 1M - 7M Yield 50.34 50.00 6M - 6M Yield 69.84 69.00 66.00 .12 6M 3 3M 4M 5M 6M 7M INSIDE OIL January 29, 2015 MARKET NEWS Woodside Consortium accused of holding back China gas: AFR report Barclays, Goldman forecast bearish first half for oil prices Barclays Plc and Goldman Sachs Group Inc issued even more bearish forecasts for oil prices on Wednesday, predicting no significant recovery in the first half of 2015. Barclays slashed its 2015 Brent crude oil price forecast to $44 a barrel from $72, while Goldman said it expected prices for West Texas Intermediate crude to trade close to $40 per barrel for most of the first half of 2015. “We expect to see further downside to prices in the next few months, with both WTI and Brent likely to trade into the high $30s before the oil price decline is arrested,” Barclays analyst Michael Cohen said in a note to clients. The British investment bank, which based its assumptions on the refusal of the Organization of the Petroleum Exporting Countries to cut output, non-OPEC supply growth and slower consumption, cut its 2015 average price forecast for WTI crude to $42 from $66 per barrel. Australia's Woodside Petroleum Ltd and its partners have been accused of holding back natural gas shipments to China as a negotiating tactic to raise the price of a long-term contract, the Australian Financial Review (AFR) reported on Thursday. The North West Shelf Gas consortium supplies liquefied natural gas (LNG) from Western Australia to state-owned China National Offshore Oil Corporation Ltd (CNOOC) under a $25 billion deal that was Australia's largest ever export contract when it was signed in 2002. The 25-year contract contains no clause to raise the historically low price - it was signed at $3.80 per one million British Thermal Units, which is less than half the current price. A source in the province of Guangdong, where LNG is delivered, told the AFR that eight shipments of gas had not arrived since 2011. Citing official documents, the source said China believes the consortium is holding back gas as a tactic to "initiate price redetermination." Pertamina grappling with Indonesia’s changing fuel demand Indonesian state energy company Pertamina expects to increase imports of RON92 "Pertamax" gasoline to meet a forecast surge in domestic demand for the fuel as it becomes more affordable, testing the limits of the former OPEC member's creaking energy infrastructure. Oil prices have fallen more than 60 percent since June, allowing Indonesia to scrap subsidies on lower-grade RON88 "Premium" gasoline and also reduce prices of other unsubsidised fuels including Pertamax. The changes have led to an increase in demand for Pertamax, driven by a narrowing in the price premium over lower-grade gasoline, Pertamina said. U.S. oil stocks hit record high as supply glut fills tanks U.S. crude oil inventories surged to their highest on record last week, a third consecutive weekly jump as a global crude glut fills up storage tanks, government data showed on Wednesday, while gasoline and distillate inventories fell. Crude inventories rose by 8.9 million barrels during the week, according to the Energy Information Administration (EIA). Analysts had expected an increase of 4.1 million barrels. The bulk of the rise, 5.5 million barrels, occurred in the Gulf Coast PADD 3 region. The build was somewhat less than the nearly 13 million-barrel increase reported late on Tuesday by the American Petroleum Institute (API). Still, it follows two weeks of strong increases and left U.S. stockpiles at 406.7 million barrels, the highest level since the EIA began keeping records in 1982. China’s oil demand to grow 3 percent in 2015: CNPC research China's implied oil demand will grow 3 percent this year versus last year, the country's top energy group forecast, little changed from the pace of growth in 2014 as calculated by Reuters. State-owned China National Petroleum Corporation (CNPC) saw the nation's oil demand rising to 10.68 million barrels per day (bpd) in 2015, some 310,000 bpd higher than last year. China, the world's second-largest oil consumer, raised crude imports by nearly 10 percent last year, or an additional 530,000 bpd, largely to boost government and commercial reserves as oil companies took advantage of the more than 50 percent fall in global benchmark prices from mid-June. N. Dakota: Oil producers aim to cut radioactive waste bills North Dakota's oil industry is pushing to change the state's radioactive waste disposal laws as part of a broad effort to conserve cash as oil prices tumble. The waste, which becomes slightly radioactive as part of the hydraulic fracturing process that churns up isotopes locked underground, must be trucked out of state. That's because rules prohibit North Dakota landfills from accepting anything but miniscule amounts of radiation. The most common form of radioactive waste is a filter sock, a mesh tube resembling a sandbag through which fracking water is pumped before it's injected back into the earth. Tank and pipeline sludge are also radioactive. It's not clear how much of this waste is generated, as North Dakota officials only began requiring tracking last year; final 2014 reports aren't due until next month. Some put the number at 70 tons per day; others say 27 tons. POLL-U.S. natural gas weekly EIA stock draw seen at 113 bcf U.S. utilities likely pulled 113 billion cubic feet of natural gas from storage in the week ended Jan. 23, the smallest draw since December, analysts told Reuters in a poll on Wednesday. If correct, it would fall short of the 216-bcf decrease in the prior week, the 219-bcf draw in the same week a year ago and the 168-bcf five-year average draw. The U.S. EIA will release the storage report on Thursday at 10:30 a.m. EST. Temperatures in the lower 48 states were warmer-than-normal last week with 169 heating degree days, according to Thomson Reuters Analytics. 4 INSIDE OIL MARKET NEWS January 29, 2015 (Continued) China to stop approving coal projects in eastern regions association China will not approve any more coal mine projects in eastern regions as it tries to tackle a supply glut that has sent prices plummeting, the head of the country's coal industry association said on Thursday. Wang Xianzheng, the chairman of the China Coal Industry Association, said at an industry conference that there was currently an additional 1 billion tonnes of production capacity under construction, despite the chronic overcapacity problems facing the sector. He said Chinese coal output was expected to peak at 4.5-4.8 billion tonnes. It stood at 3.7 billion tonnes in 2013, and though the National Bureau of Statistics has yet to produce a figure for 2014, total production is expected to have fallen over the year. Kuwait cuts diesel fuel prices after political pressure Kuwait has cut selling prices of diesel and kerosene at filling stations after political opposition to price hikes underlined the difficulty of reforming the country's welfare system, even as the loss of oil revenues makes reform more urgent. On Jan. 1, the government raised the price of diesel at wholesalers and filling stations to 0.170 dinar (59 U.S. cents) per litre from 0.055 dinar. Kerosene prices also increased. The changes aimed to reduce the burden of lavish subsidies on state finances. State news agency KUNA estimated that diesel price reform would save the government around $1 billion a year. Although the new prices of diesel and kerosene were still among the lowest in the world, the politically sensitive decision prompted heavy criticism of government policy by some members of parliament, who argued it was unfair to consumers. BEYOND THE HEADLINES Part of the reasoning behind the massive capacity expansion by the big three iron ore miners was that they would force highercost, smaller producers out of the market. And to some extent Brazil's Vale and the Anglo-Australian pair Rio Tinto and BHP Billiton have succeeded, with a spate of recent mine closures and signs that Chinese domestic output is declining. But the fall in oil prices is providing some relief to miners, allowing them to stay in the game, thereby causing commodity prices to drop further. Morgan Stanley's research paper said that in iron ore, every $1 decline in the price of a barrel of oil resulted in a saving of 8 cents a tonne, while in thermal coal it was 3 cents and 5 cents for metallurgical coal. Nonetheless, a typical underground thermal coal mine would now only be $1.95 a tonne better off than when oil prices were $115 a barrel in the middle of last year. This is only the benefit to the cost of production and doesn't take into account the cost of transport, or any other factors. Over the same time period, thermal coal has dropped by around $21 a tonne, meaning the lower oil price has helped, but not that much. COLUMN-Crude oil decline cuts both ways for miners By Clyde Russell The plunge in oil prices is a double-edged sword for many miners, lowering the cost of production but at the same time cutting the value of the commodities they produce. At first glance the 57 percent tumble in Brent crude since June last year would seem to be an unambiguous positive for many commodity producers, given their heavy reliance on diesel to operate mines and transport output to ports. This is especially the case for Australian coal and iron ore mines, which use diesel not only for mining vehicles but to generate electricity as well, given their remote locations. Diesel-fired train locomotives help miners move their commodities across hundreds of kilometres (miles) and there may even be savings on charter flights used to ferry workers to and from remote mine sites, given the lower cost of aviation fuel. Research by Morgan Stanley, published on Jan. 25, said that oil and diesel made up between 9 and 12 percent of the total production costs for bulk commodities such as coal, iron ore and bauxite, but only 3 to 5 percent for metals. The major impact of the declining oil price is to shift the production cost curve lower, effectively meaning more mines will be profitable, even at the current low commodity prices. The spot price of iron ore in Asia dropped to a 5-1/2-year low of $62.80 a tonne on Tuesday, and is down 67 percent from its peak of $191.90 reached in February 2011. Spot thermal coal from Australia's Newcastle port, an Asian benchmark, was at $61.97 a tonne in the week ended Jan. 23, close to a six-year low and 54 percent below its post-2008 recession peak of $136.30 in January 2011. The question is whether costs have fallen enough to offset lower commodity prices, and the answer is no. But they have fallen enough to allow some producers, who would have otherwise been forced to shut down, to remain in business. This has the impact of keeping supply in the market, which in the case of commodities such as iron ore and coal keeps downward pressure on prices. CURRENCY MOVES BIGGER HELP Of far more significance has been the almost 17 percent drop in the value of the Australian dollar against its U.S. counterpart since the middle of 2014. This has had the affect of actually increasing coal prices in Australian dollar terms, with Newcastle prices rising from a 2014 low of A$71.94 a tonne in September to A$78.40 last week. It's not just Australian producers that have benefited, with Indonesian miners enjoying a near 11 percent depreciation in the rupiah against the dollar since April last year, while South African producers have seen the rand drop almost 13 percent since last May. But while miners may cheer low oil prices and a firmer U.S. dollar, it's those two factors that are helping keep supply in the global market and preventing a recovery in commodity prices. (Clyde Russell is a Reuters columnist. The views expressed are his own.) 5 INSIDE OIL January 29, 2015 BEYOND THE HEADLINES (Continued) FUEL CONSUMPTION DATA The problem with monitoring the oil market is the paucity of realtime data on either supply or demand. Data is mostly incomplete and available only with long delays. Consumption statistics are particularly poor in terms of both accuracy and timeliness. As usual, the best data comes from the United States, where the Energy Information Administration (EIA) publishes weekly, monthly and annual estimates on the amount of “petroleum products supplied" to the domestic market. But product supplied is calculated as a residual from other data on domestic production, imports, exports and stock changes, so it is sensitive to errors in recording or estimating the other items. In particular, exports are estimated in the short term, so errors in estimating exports flow through directly into equal and opposite errors in calculating product supplied. The one point at which accurate and comprehensive data is available is when motor fuel is sold and excise taxes are paid. Federal and state governments impose excise taxes on every gallon of gasoline and diesel sold, and publish data on “taxable sales”. For example, California collects federal fuel tax of 18.4 cents on every gallon of gasoline sold as well as a state fuel tax of 36 cents per gallon. States report taxable sales to the Federal Highway Administration each month so the U.S. Department of Transportation can attribute revenues and distribute spending from the highway trust fund among the states. Unfortunately, the latest nationwide data relates to August 2014. Five months out of date, it is much too old to be useful in analysing short-term consumption trends. But some states release their own data on taxable sales much faster. California fuel sales data is available for October, only three months old. The state’s motor vehicle fuel tax is levied on gasoline upon distribution, importation or sale in the state, and there are fewer than 300 registered tax-paying entities, so the statistics are simple, comprehensive and clean. California motor vehicle fuel tax raised $5.2 billion for the State Transportation Fund in the 2012-13 fiscal year to construct and maintain public roads and mass transit systems. California is the largest motor fuel market in the country, ahead of Texas, Florida, New York and Illinois. The state accounted for 11 percent of nationwide gasoline sales in 2013, according to the EIA, or almost 39 million gallons per day. State gasoline sales can serve as a useful indicator for national trends, and they show gasoline demand is now growing rapidly. (John Kemp is a Reuters market analyst. The views expressed are his own) COLUMN-California gasoline sales point to growing oil demand By John Kemp Motorists in California purchased more gasoline in October 2014 than any corresponding month since 2007, according to state tax records, confirming the renewed growth in U.S. fuel demand. State gasoline consumption was 2.3 percent higher than in the same month in 2013 and 4.1 percent higher than in 2012, according to the California Board of Equalization, which collects motor vehicle fuel tax in the state. Sales have been growing since June 2013 and the trend is expected to accelerate as motorists respond to the halving of fuel prices by purchasing larger vehicles and driving more. Lower crude oil prices will gradually rebalance the market by slowing crude production growth and encouraging more use of refined fuels. GASOLINE SALES UP California’s gasoline sales have been rising for more than a year but the rate of increase accelerated in September and October 2014, coinciding with the sharp drop in pump prices. In October, California gasoline sales hit 1.272 billion gallons, up from 1.242 billion gallons in October 2013. To switch units to something more familiar in the oil market, the extra 30 million gallons of gasoline sold in October 2014 was equivalent to an increase of 23,000 barrels per day (bpd). Multiplying up to national level, gasoline sales were more than 200,000 bpd higher across the United States in October 2014 compared with the same month a year earlier. If oil prices remain at their current level, and gasoline consumption continues to grow at recent rates, demand could easily rise by another 200,000 to 500,000 bpd in 2015. Assuming national crude oil production is flat in 2015, increased gasoline consumption from the United States alone could tighten the global oil market by between a quarter and a half a million barrels per day by the end of 2015. By itself that would not be enough to rebalance the oil market. But if U.S. diesel consumption also continues to rise, and increased fuel use is mirrored in Europe and China, thanks to lower prices, global oil consumption could easily rise by 1 million barrels per day by the end of the year. The International Energy Agency, using a more sophisticated model, predicts global oil demand will hit 94.4 million bpd in the fourth quarter of 2015, up almost exactly 1 million bpd from 93.4 million in the fourth quarter of 2014. 6 INSIDE OIL January 29, 2015 ANALYTIC CHARTS Daily NYMEX Crude - 30 Min Daily ICE Brent Crude - 30 Min Daily ICE Gas Oil - 30 Min Daily NYMEX RBOB Gasoline - 30 Min Daily ICE Heating Oil - 30 Min Daily NYMEX Heating Oil - 30 Min (Inside Oil is compiled by Sherry Jacob-Phillips in Bangalore) For more information: Learn more about our products and services for commodities professionals, click here For questions and comments on Inside Oil newsletter, click here Contact your local Thomson Reuters office, click here Your subscription: To find out more and register for our free commodities newsletters click here © 2015 Thomson Reuters. All rights reserved. This content is the intellectual property of Thomson Reuters and its affiliates. Any copying, distribution or redistribution of this content is expressly prohibited without the prior written consent of Thomson Reuters. Thomson Reuters shall not be liable for any errors or delays in content, or for any actions taken in reliance thereon. Thomson Reuters and its logo are registered trademarks or trademarks of the Thomson Reuters group of companies around the world. Privacy statement: To find out more about how we may collect, use and share your personal information please read our privacy statement here To unsubscribe to this newsletter, click here 7


© Copyright 2026