
Dissection of the Genetic Programs of p53-Mediated G1
From www.bloodjournal.org by guest on February 6, 2015. For personal use only.
RAPID COMMUNICATION
Dissection of the Genetic Programs of p53-Mediated G1 Growth Arrest and
Apoptosis: Blocking p53-Induced Apoptosis Unmasks G1 Arrest
By Christel Guillouf, Xavier Gratia, Muthu Selvakumaran, Antonio De Luca, Antonio Giordano, Barbara Hoffman,
and Dan A. Liebermann
Employing the myeloblastic leukemia M1 cell line, which
does not express endogenous 4153,and genetically engineered variants, it was recently shown that activation of
p53, using a p53 temperature-sensitive mutant transgene
(p53ts).resulted in rapid apoptosis that was delayed by high
level ectopic expression of bcl-2. In this report, advantage
has been taken of these M1 variants t o investigate the relationship between p53-mediated G1 arrest and apoptosis.
Flow cytometric cell cycle analysis has provided evidence
that activation of wild-type ( w t ) p53 function in M1 cells
resulted in the induction of G1 growth arrest; this was
clearly seen in the Mlp53/bcl-2cells because of the delay in
apoptosis that unmasked p53-induced G1 growth arrest.
This finding was further corroborated at themolecular level
by analysis of the expression and function of key cell cycle
regulatory genes in Mlp53 versus Mlp53/bcl-2 cells after
the activation of wt p53 function; events that take place at
early times during the p53-induced G1 arrest occur in both
the Mlp53 and the Mlp53/bcl-2 cells, whereas later events
occur only in the Mlp53/bcl-2 cells, which undergo delayed
apoptosis, thereby allowing thecells t o complete G1 arrest.
Finally, it was observed that a spectrum of p53 target genes
implicated in p53-induced growth suppression and
apoptosis were similarly regulated, either induced (@add&,
waf7, mdrn2, and bax) or suppressed (c-mycand bcl-2). after
activation of wt p53 function in Mlp53 and Mlp53/bcl-2
cells. Taken together, these findings show that wt p53 can
simultaneously induce the genetic programs of both G1
growth arrest and apoptosis within the same cell type, in
which thegenetic program of cell death can proceed in either
G1-arrested IMlp53/bcl-2) or cycling (Mlp53) cells. These
findings increase our understanding of thefunctions of p53
as a tumor suppressor and how alterations in these functions could contribute t o malignancy.
0 1995 b y The American Society of Hematology.
A
topic p53” andor bcl-2, it was observed that, after activation
of wt p53 function, Mlp53 cells underwent rapid apoptosis,
whereas Mlp53ibcl-2 cells underwent delayed apoptosis.”
In this report, advantage has been taken of these M1 cell
variants to gain insight into the relationship between the
genetic programs of p53-mediated growth arrest and p53mediated apoptosis induced within the same cell type. It is
shown that activation ofwt p53 in M1 cells results in the
simultaneous induction of the genetic programs of p53-mediated growth arrest and p53-mediated apoptosis. Rapid
apoptosis prevents the cells from G1 arresting (as is the case
in Mlp53 cells), whereas delaying the apoptotic response
(ie, overexpression of bcl-2 in Mlp53ibcl-2) allows the cells
to G1 arrest, showing that the genetic program of p53-induced cell death can proceed in either G1-arrested (Mlp53/
bcl-2) or cycling (Mlp53) cells.
PROFOUND EXAMPLE of cell homeostasis that is
regulated throughout life is the complex process of
blood cell formation. This process requires the participation
of many factors, including positive and negative regulators of
growth and differentiation, which determine survival, growth
stimulation, differentiation, functional activation, and programmed cell death (apoptosis). Consequently, any alterations in these pathways could contribute to leukemogenesis.’ In addition to growth arrest and apoptosis being
implicated in normal hematopoeisis, they have been shown
to modulate the cellular response to DNA-damaging agents
used as anticancer agents.’ It is, therefore, of primary importance to understand how the growth arrest and apoptosis
mechanisms are regulated and to discern the molecular players involved in these mechanisms.
The tumor-suppressor gene p53 has become a major
player in the context of studying the molecular biology of
growth arrest and apoptosis and how aberrations in these
pathways may contribute to tumorigenicity. Inactivation of
p53 is a common event in the development of human malignancies, occumng in more than 50% of all tumor^.^ p53, a
nuclear protein that binds to specific DNA sequences and
functions as a transcriptional regulator,“ was observed to
suppress cell growth’ and in several cell types to induce
a p o p t o ~ i s .Experimental
~.~
evidence has accumulated to indicate that rndrn2,’ g ~ d d 4 5and
, ~ Wufl” are important players
in p53-mediated effects, and it has been shown that mdm2
and Wufl are direct target genes ofp53’,’’;
along similar
lines, the proto-oncogene c-myc, implicated inthe control
of cell proliferation, was documented to be trans-repressed
by p53.“ Recently, by activating wild-type p53 (wt p53)
function of a temperature-sensitive p53 (p53‘”)transgene in
M1 myeloblastic leukemia cells, which do not express endogenous p53, the spectrum of p53 target genes has been
broadened to include bcl-2 and bar,’’,13
gene products implicated in the regulation of apopt~sis.’*‘~
Using genetically engineered M1 cell lines expressing ecBlood, Vol 85, No 10 (May 15). 1995: pp 2691-2698
From the Fels Institute for Cancer Research and Molecular Biology, Temple University School of Medicine, Philadelphia, PA; and
the Institutefor Cancer Research and Molecular Medicine, Jeferson
Cancer Institute, Phiiadelphia, PA.
Submitted December 14, 1994; accepted March I , 1995.
Supported by National Institutes of Health Grants No.
lROlCA51162 (B.H.), lROlCA43618 (D.A.L.),
and IROlCA60994
(A.G.); by agrant from W.W. Smith (A.G.); by a CIRIT fellowship
(Generalitat de Catalunya) (X.G.);and by National Cancer Institute
Cancer Center Support Grant No. S P30 CA12227.
Address reprint requests to Barbara Hofian. PhD, and Dan A.
Liebermann, PhD, Fels Institute for Cancer Research and Molecular
Biology, Temple Universiiy School of Medicine, 3307 N Broad Sr,
Philadelphia, PA 19140.
The publication costs of this article were defrayed in part by page
charge payment. This article musf therefore be hereby marked
“advertisement” in accordance with 18 U.S.C. section 1734 solely to
indicate this fact.
0 1995 by The American Society of Hematology.
0006-4971/95/85/0-0040$3.00/0
2691
From www.bloodjournal.org by guest on February 6, 2015. For personal use only.
GUILLOUF ET AL
2692
MATERIALS AND METHODS
Cells and cell culture. The differentiation competent murine MI
myeloid leukemic cell line (clone 6) and establishment of the Mlp53
(clone 7), Mlp53hcl-2 (clone 12), and Mlbcl-2 (clone S ) cell lines
have been described previously," and the data presented were obtained using these clones. However, for each cell variant, three independent cell lines were examined,'' for which
the results were similar
to the data presented. Three
Mlneo control lines consistently behaved like the parental M1 cells. Cells were cultured in Dulbecco's
modifiedEagle'smedium(GIBCO,GrandIsland,NY)and
10%
horse serum in a humidified atmosphere with 10% CO,. Cells were
seeded at 0.15 X 10⁶/mL at either 37.5"C or 32.5"C, as indicated.
ForRNAextractions,atearlytimesaftertemperatureshifts,cell
concentrations were adjusted to give a final density of greater than
0.25 X IO6 cells/mL at the time of extraction.
Assays for apoptosis-associated properties. Viable cell numbers
were determined by trypan blue dye exclusion and counting
in a
hemocytometer. Results of all experiments represent the mean of at
least three independent determinations, with standard deviations up
to 215% (ie,25% = 25% 2 3.75%).Apoptoticmorphologywas
determinedon May-Griinwald-Giemsa-stained cytospinsmears.
DNA fragmentation, indicative of apoptosis, was determined as described previously.'s
Flow cytometric analysis. Cellswereharvestedafterdifferent
periods of time at 32.S°C, the permissive temperature for activation
ofwtp53function.Cellcycleanalysiswasperformed
by fixing
cells with 70% cold ethanol, collecting the cells by centrifugation,
and treating for 30 minutes with RNase A ( I 80 pg/mL RNase A in
phosphate-bufferedsaline[PBS]).Thecellsweresubsequently
stained in propidium iodide (Sigma, St Louis, MO) and analyzed
using a Coulter Epics Elite system (Miami, FL), choosing an appropriate window in the fluorescence-activated cell sorter (FACS) such
that only living cells were included
in the analysis. Analysis was
performed at least three times with similar results.
Immunoprecipitations, immunoblotting, und kinase a.ssuy.s.
Immunoprecipitationswereperformedasdescribed
by Grafia et
a~,2wlFor Westernblottingexperiments,proteinsresolved
by sodiumdodecylsulfate-polyacrylamidegelelectrophoresis(SDSPAGE) were transferred to immobilon (Millipore, Boston. MA)
in
I O nnnol/L CAPS/IO% methanol buffer (pH 11) and detected with
horseradishperoxidaseandenhancedchemiluminescence(ECL;
Amersham, Arlington Heights, IL). Kinase assays were performed
as described." Briefly, immunoprecipitatedcomplexeswereincubated at 30°C for 20 to 30 minutes in20 m m o l k HEPES, 10 mmol/
L magnesium acetate, I mmol/L DTT, 20 pmol/L ATP, 2.2 X 10'
c p d p m o l of y-"P-ATP (Dupont, Wilmington, DE), and 2.5 pg of
histone HI (Boehringer Mannheim, Indianapolis, IN) in a total volume of 25 pL. The reaction was terminated by the addition of 25
pL of 2 X Laemmlisamplebuffer,andthelabeledproteinswere
resolved by SDS-PAGE. An equal amount
of protein was used in
all assays; protein determinations were performed using the BioRad
protein assay (Hercules, CA). Preparation ofspecific anti-C-terminal
peptideantibodiestocdc2
(G6) andcdk2havebeen
described.'"
Polyclonal anti-cyclin E was a kind gift of J. Roberts and E. Firpo
(Fred Hutchinson Cancer Center, Seattle, WA); anti-cyclin A and
anti-cyclin Dl werekindlyprovided
by Y. Xiong(University of
North Carolina at Chapel Hill, Chapel Hill, NC). Polyclonal antibodies to p107 were from M. Ewen (Dana-Farber Cancer Institute. Boston. MA). Regarding monoclonal antibodies to pRB,XZ104. XZ133.
XZ91, and XZ77 were from Q. Hu (Howard Hughes Medical Institute, University of California, San Francisco, CA) and PMG3-24.5
was from Pharmigen (San Diego, CA).
RESULTS
Growth and viability characteristics of M1 and M1 cell
variants (Mlbcl-2,MIp53, and Mlp53hcl-2) at the nonpermissive and permissive temperatures for wt p53 function.
To better understand the effects of p53 and Bcl-2,separately
Recombinant DNA techniques, DNA probes, RNA extraction, and
and in combination, on M1cellgrowth andviability, we
RNA blots. Plasmidpreparations,restrictionenzymedigestions,
DNA fragment preparations, and agarose gel electrophoresis were
determined the viable cell number of parental MI cells and
as described before.'"'' Probe forgadd45 was a Kpn I-Sac I hamster
the genetically engineered M I variants,including MlpS3,
cDNA fragment (1.2 kb) excised from pXR45m.IX Probe for mdm2
Mlbcl-2, and MlpS3/bcl-2cells, at different times after culwas the murine mdm2 cDNA insert (1.4 kb) of pl IB, a kind gift
turing of the cells at 37.S"C and at 32.S°C, the permissive
from Dr Donna George. Waf1 probe was a 440-bp murine fragment
temperaturefor
activation of wt function of the p53"
obtained by polymerase chain reaction (PCR) of RNA from Mlp53
transgene
(Fig
l).
As shown in Fig IA, for all of these cell
cellsshiftedto 32.5"C for 3 hours.TheoligodT-primedreverse
transcriptase (RT) reaction was performed using a GIBCO BRL Kit. lines the numberof viable cells increased similarly at37.5"C.
At the permissive temperature (32.S°C), the numberof viable
The amplimers used for PCR amplification were 5"CCATGTCCAcellsforM1andMlbcl-2continuedtoincreaseandthe
ATCCTGGTGATGTCCG-3' and S'-TTTCGGCCCTGAGATGjTCCGG-3'. PCR conditions were denaturing
at 94°C for 5 minutes
percentage of living cells remained constant up to 4 days in
followed by 30 cycles at 94°C for I minute, 60°C for I minute, and
culture (Fig 1A and B). In contrast, at 32.S"C MlpS3 cells
72°C for 2 minutes and extension at 72°C for 7 minutes. Identity of
exhibited a decrease in viable cell number, whichwas associthe PCR product was confirmed by direct sequencing. Relative levels ated with a rapid loss in the percentage of living cells (Fig
of endogenous murinebcI-2 mRNA were measured using semiquan1C) because of apoptotic cell death (as evident from cell
titative RT-PCR, analyzing PCR products by probing with hcl-2; to
morphology
and the appearance of a DNA ladder"). Unlike
p2monitor for reproducibility of the PCR reaction, RT-PCR for
the MlpS3 cells, at 32.S"C the number of viable MlpS3hclmicroglobulin (p2M) was performed. This analysis was performed
2 cells increased up to 1 day and decreased marginally by
as previously described." Probes for bax, c-myc, and p-actin were
the second day (Fig IB), with a significant decrease in the
the same as used previously."." RNA was extracted by the method
of Chomczynski and Sacchi, using guanidinium thiocyanate, as prepercentage of living cellsobservedonlyafter
1 day(Fig
viously described." Total RNA (10 pgllane) was electrophoresed
1C).
on I % agarose formaldehyde gels. Northern blots, using DuralonTaken together,theseobservationsindicatethat
( I ) ecUV membranes (Stratagene, La Jolla, CA), were prepared and
UV
topicexpressionof
bcl-2 had no significant effect on the
cross-linked (Stratalinker; Stratagene) before baking. Hybridization
growth and viability of M1 cells, (2) activation of wt p53
and washing conditions and stripping blots of probe to rehybridize
function resultedinarapid
loss of M I cellviability, and
were performed as described previously.'y Equal amounts of RNA
(3) ectopic expression of bcl-2 in combination with wt p53
in each lane was confirmed by equal intensity of ethidium bromide
function delayedthisrapid
loss in cellviability, with the
staining of ribosomal RNA bands and hybridization with a p-actin
number of MlpS3hcl-2 cells not increasing beyond day 1.
probe.
From www.bloodjournal.org by guest on February 6, 2015. For personal use only.
BLOCKING P53-INDUCEDAPOPTOSIS UNMASKS GI ARREST
A
41
B
p MlklZ
31
K
Days in Culture at 32.5OC
n
0
1
2
3
4
5
Days in Culture at 32.5OC
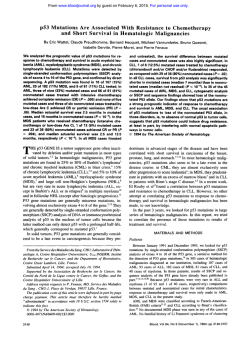
Fig 1. Viable cell number (A and B) and percentage of living cells
(C) of the MI, Mlbcl-2, Mlp53, and Mlp53/bcl-2 cells at the nonpermissive (37.5"C) (A) and the permissive (32.5"Cl (B and C) temperawt p53 function. M1, Mlbcl-2, Mlp53, and
tures for activation of
Mlp531bcl-2 (0.15 x lo* cells/mLl were incubated either at the nonpermissive (37.5"C) or permissive (32.5%) temperatures and at the
indicated times the number of viable cells and the percentage of
living cells were determined by trypan blue exclusion and counting
in a hemocytometer. Mlneo (not shown) andMlbcl-2 clones consistently behaved like the parental M1 cells, maintaining full viability
(-95%) at both the nonpermissive (37.5%) and permissive (32.5"C)
temperaturos, whereasthe Mtp53 and Mlp53/bcl-2 cells maintained
of DNAfragmentation ladders
full viability at 37.5"c. The appearance
and apoptotic morphology ofthe Mlp53 and Mlp53/bc1-2 cells (Materials and Methods) have shown that the loss in cell viability was
caused by apoptotic cell death."
Cell cycle analysis of M1 and M1 cell variants expressing
p53" andor bcl-2 transgenes after activation of wt p53function. Maintenance of a relatively constant number of viable
cells for the Mlp53hcl-2 cell line between the first and
2693
second day after activation of wt p53 function may reflect
p53-induced growth arrest or, alternatively, an equilibrium
between cell death and cell proliferation. To address this
issue, M1 parental cells and the genetically engineered variants, expressing ectopic p53" andlor bcl-2, were subjected
to flow cytometric analysis after incubation at 32.5"C, choosing an appropriate window in the FACS such that only living
cells were included in the analysis.
As shown in Fig 2, for the M1 and Mlbcl-2 cell lines,
neither the distribution of cells in the different phase of the
cell cycle (GO/Gl; 53% 5 4%; S , 26% 2 4%; GUM, 21%
2 2%; Fig 2A) nor the GUS ratio (2 2 0.4; Fig 2B) varied
significantly after shifting the cultures to 3 2 . W for various
times. After 18 hours of incubation of the Mlp53 cells at
32S°C, a point in time when the majority of the cell population already had undergone apoptotic cell death (with only
20% viable cells), only a small increase was observed in the
percentage of cells in the G1 phase of the cell cycle, from
60% up to 71%; in parallel, a decrease in the percentage of
cells in the S phase, from 25% down to 14%, was observed
(Fig 2A). These alterations in distribution of cells in the
different phases of the cell cycle resulted in a small increase
in the GlfS ratio (up to 5.3; Fig 2B). In sharp contrast, it
can be seen that the percentage of M l p 5 3 h l - 2 cells in G1
increased to 80% by 24 hours (with 92%of the cells viable),
to 87% by 48 hours (with 61% of the cells viable), and to
96% by 96 hours, which was the latest time point when there
were still enough viable cells amenable for FACS analysis
(Fig 2A). Paralleling this impressive accumulation of
Mlp53hcl-2 cells in the G1 phase of the cell cycle were the
decreases observed in the percent of cells in the S and the
G2/M phases (7% and 12% by 24 hours, respectively, with
92% of the cells viable), ultimately resulting in a GUS ratio
of 32 (Fig 2B). Based on these data, it can be concluded
that the number of viable Mlp53hcl-2 cells is a reflection
of an equilibrium between G1 growth arrest, proliferation,
and cell death, and that between 1 and 2 days most of the
cells have undergone G1 arrest.
Taken together, these observations clearly show that activation of wt p53 function inM1myeloid precursor cells
resulted in the induction of both G1 growth arrest and
apoptosis. It is notable that the G1 growth arrest was clearly
seen only in the Mlp53hcl-2 cells, because of ectopic bcl2 expression that delayed apoptosis compared with that in
Mlp53 cells, thereby unmasking p53-induced GI arrest. The
subtle changes in cell cycle distribution observed in Mlp53/
bcl-2 cells up to 18 hours after activation of wt p53 function
is very similar to what was observed for Mlp53, despite the
fact that in the latter case only 20% of the cells were living;
these data are consistent with the notion that cells undergoing
p53-induced apoptosis do not select from a subpopulation
of cells with regardto cell cycle status. This notion is corroborated by the fact that the ultimate fate of the M1 cells
expressing wt p53 was apoptosis, showing thatthep53induced genetic program of apoptosis can proceed in either
G1-arrested (Mlp53hcl-2) or cycling (Mlp53) cells.
Expression andfunction of cell cycle regulatory genes in
Mlp53 versus M l p 5 3 h l - 2 cells after activation of wt p53
function. Progression through the cell cycle of dividing
cells is governed by a family of protein kinases known as
From www.bloodjournal.org by guest on February 6, 2015. For personal use only.
GUILLOUF ET AL
2694
A
M1
HM M 32.FC
MlBd2
HM.M 32.5-
M1p53
HM M 32.5'C
H a m at 32.5.C
Mlp53Bd2
HMI M 32.5%
98
H o v st
~ 32.5'C
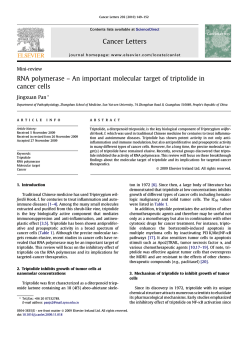
Fig 2. Cell cycle distribution and Gl/S ratio of M1, Mlp53, Mlbcl-2, and Mlp53/bcl-2 cells after wt p53 activation. (AI Cell cycle analysis
by quantitative flow cytometry. The cells were fixed and stained with propidium iodide after different times in culture at 32.5"C, and the DNA
content was assessed using an FACS. The histograms represent the percentage of cells found in each phase (G1, S, and G2/Ml of the cell
cycle. The percentage of living cells is givenabove the panel for indicatedtimes at 32.5"C. The latest time point given correspondsto the time
when the percentage of living cells is high enough to allow precise cell cycle analysis. (B)Histograms showing the ratio of cells in the G1 to
S phases of the cell cycle after incubation at 32.5'C for the indicated times. For each celltype and time point, analysis was performed at least
three times with similar results.
cyclin-dependent kinases(cdks) andtheirregulatory
subunits, the cyclins.Activationofthe
cdks is regulated by
association with the cyclins andby the phosphorylation state
of both components of the complexes formed." The socalled G I cyclins (E and D), in particular the cyclin Ucdk2
complex, have been implicated in GI/S transition, whereas
the cyclin A/cdk2 complex has been implicated in the progression of cells during S phase." One means by which cdks
are known to exert positive growth control is by hyperphosphorylation and inactivation of negative cell cycle regulators,
such as the retinoblastoma gene product (pRb). thereby overriding their ability to suppress GI exit." Therefore. it was
of interest to determine the expression of these critical cell
cycle regulators, their phosphorylated state.
and the kinase
activity of the complexes formed in the M I p53 and M 1 p531
bcl-2 cell lines. which were observed to undergo apoptosis
and G1 arrest with distinct kinetics.
As shown in Fig 3A, no significant changes in the levels
of cyclin A, E. and D1 proteins or in their cyclin-associated
histone HI kinase activitieswere observed in the MI and
M 1 bcl-2 cells harvested at various times in culture at 32.S"C.
Also, there was no detectable change in the level of cyclin
D1 protein in MlpS3 and MlpS3/bcl-2 cells at 32.S°C, the
permissive temperature for activation of wt p53 function. In
contrast. the levels of cyclin A protein and cyclin A-associated kinase activity decreased both in MlpS3 and M Ips31
bcl-2cells after 12 and24 hours,respectively,at
325°C
with no detectable cyclin A protein and cyclin A-associated
kinase activity in the MlpS3/bcl-2 cells by 48 hours. As for
cyclin E. no change in the level of cyclin E protein and cyclin
E-associated kinase activity was observed in the M Ips3 and
M lpS3/bcI-2 cells after 18 hours of incubation at 32.S°C,
whereas in the MIpWbcl-2 cells. by 48 hours the cyclin Eassociated kinase was inactive with no apparent change in
the level of cyclin E protein. As shown in Fig 3B. no quantitative or qualitative changes in cdk2 and cdc2 proteins were
observed in any of the 4 cell lines after 18 hours at 32.S"C:
however. in MlpS3/bcl-2 thebandscorresponding
to the
active forms were absent by 48 hours. Consistent with this
finding was the observation that. in the MlpS3/bcl-2 cells.
the cdk2 and cdc2-associated kinase activities were not detectable at the 48-hour time point. Finally. as shown in Fig
3C. mainly the hyperphosphorylated forms of pRb and a mix
of different phosphorylation states of p107 were detected in
exponentially growing MI and Mlbcl-2 cells at 32.S"C. In
contrast.within
12 hoursafterplacingthe
MlpS3 and
M 1pS3hcl-2 cellsat 32.S"C. the protein band corresponding
to thehyperphosphorylatedformofpRbwasobserved
to
shift to faster SDS-PAGE gel migrating bands. representing
the hypophosphorylated forms of pRb. As for p107. the shift
fromthehyperphosphorylated
to thehypophosphorylated
form occurredwithin 12 and 24 hours. respectively.after
placing the MlpS3 and MlpS3/bcl-2 cells at 32.5"C.
In conclusion.theexpressionpatterns.phosphorylated
From www.bloodjournal.org by guest on February 6, 2015. For personal use only.
BLOCKING p53-INDUCED APOPTOSIS
G1
UNMASKS
ARREST
2695
M1
MlbCl-2
-- - -
Protein
CYCLIN A
Mlp53 I bcl-2
M1 p53
0
6
0
18
12
hf
12 48
24
18
6
-
Kinas
Proteln
CYCLIN E
Klnass
0
24
0
24
CYCLIN Dl
0
6 12 18
"0-
Proteln
Fig 3. Protein levels, associated kinase activities,
and phosphorylation status of cell cycle regulatory
proteins in M1, Mlbcl-2, Mlp53,
and Mlp53/bcl-2
cells at indicated times after activation of wt p53
function at the permissive temperature (32.5%). (A)
Analysisofcyclin A, E, and D l protein levels and
associated kinase activities (for cyclin A and E). (B)
Analysis of cdc2 and cdk2 protein levels and kinase
activities. Active (*A) and inactive (*l)forms of cdk2
are indicated. Phosphorylatedforms of c d d are indicated by a bracket. (C) AnalysisofpRb
and p107
protein levels and phosphorylation status. Hypophosphorylated forms of pRb and p107 are indicated
by arrows. For each Western blot experiment, 40 to
60 p g of total protein lysate was loaded per lane.
For kinase assays, l 0 0p g of protein was used. Analysis was performed at least six times with similar results.
0
U
"
"
.
Mlp53
0
6
6 12 18 2 4 4 8 hr
12
Mlp53 I bcl-2
18
0
hr
648
24
18
12
Protel
CDCP
Klnso
D
'I
*A
Proteln
CDKP
Kin-
c
Mlbcl-2
M1
n 24
M1p53
"
o
24
0
6
12
Mlp53 I bcl-2
18
0
6
12
18
24 48 hr
4
PRt
p10'
state, and kinase activities that have been observed for these
regulatory cell cycle elements provide further support for
the notion that activation of wt p53 function in M1 myeloid
precursors activates the genetic program associated with G l
growth arrest, in addition to induction of cell death. Events
that were observed to occur at early times during the p53induced G1 arrest (ie, decrease in the expression and kinase
activity of cyclin A and dephosphorylation of pRb and p107)
were detected in both the Mlp53 and the Mlp53hcl-2 cells,
whereas later events (ie, inactivation of the kinase activities
of cyclin E, cdk2, and cdc2) were seen only in the Mlp53/
bcl-2 cells. These observations are consistent with the rapid
kinetics of apoptosis of the Mlp53 cells that prevent the
cells from completing G1 arrest, as opposed to the delayed
apoptotic kinetics of the Mlp53hcl-2 cells, which afford the
cells sufficient time to G1 arrest before undergoing apoptosis, thereby unmasking p53-induced G1 arrest of the M1
cells.
Expression of genes implicated in p53-mediated growth
arrest and apoptosis. The data presented thus far establish,
both at the cellular and molecular level, that activation of
wt p53 function in M1 cells initiates pathways for both G1
growth arrest and apoptosis. It was of obvious interest to
examine the expression of genes that have been implicated
in mediating the effects of p53 on growth and apoptosis (ie,
gadd45, Wafl, mdm2, c-myc, bcl-2, and bux) in the M1 cell
system after activation ofwt p53 function. As shown in
Fig 4A, the expression of gadd45 and Wafl mRNAs were
undetectable inM1 and Mlbcl-2 cells incubated at either
32.5"C or 37.5"C, whereas mdm2 and bax mRNAs exhibited
low basal levels of expression in these cells. After activation
of wt p53 function at 32.5"C, similar kinetics of induction/
upregulation were observed for the mRNAs of gadd45,
Wafl, and mdm2 in the Mlp53 and Mlp53hcl-2 cells. In
addition, bax &A, which was upregulated in Mlp53, continued to increase in the Mlp53hcl-2 cells, which underwent
delayed apoptosis compared with the Mlp53 cells (Figs 1C
and 4A; compare Mlp53 at 18 hours with Mlp53hcl-2 at
48 hours). As seen in Fig 4B, endogenous bcl-2 and c-myc
mRNAs were expressed at similar levels in M1 and Mlbcl2 cells incubated at 32.5"C and in the Mlp53 and Mlp53/
bcl-2 cells were downregulated similarly after activation of
wt p53 function at 32.5"C. St is notable that the kinetics of
c-myc downregulation in the Mlp53 and Mlp53hcl-2 cells
were exceptionally rapid, with no c-myc mRNA detectable
by 6 hours; also notable is that the level of endogenous bcl2 mRNA continued to decrease inthe Mlp53hcl-2 cells
compared with Mlp53 cells, which could be analyzed only
up to 18 hours for RNA because of the rapid apoptotic
response (Fig 1C). These data show that a spectrum of p53
target genes implicated in p53-induced growth suppression
and apoptosis are similarly regulated upon induction of wt
p53 function in the MIp53 and Mlp53hcl-2 cells.
DISCUSSION
M1 myeloblastic leukemia cells, which do not express
endogenous p53, undergo rapid apoptosis after activation of
wt p53 function of a p53" mutant transgene. Using geneti-
From www.bloodjournal.org by guest on February 6, 2015. For personal use only.
GUILLOUF ET AL
2696
A
Mlbcl-2
Mlp53
~1
0
24
0 24 ~0 1 6 12
18
MlD53 I bcl-2
0 1 6 12 2 4 4 8 hr
GADD45
1
WAF1
(P211
D
BAX
C-MYC
Fig 4. Expression of genes implicated in p53-mediated G1 growth
arrest and apoptosis in M1, Mlbcl-2, Mlp53, and Mlp53/bcl-2 cells
after activation of wt p53 function at the permissive temperature
(32.5"C). (A) Analysis of the expression of gadd45, Waf1 ( ~ 2 1 )rndrn2,
.
and bax.(B) Analysis of the expression of c-rnycand bcl-2. Expression
).
bax, and c-myc mRNAs was analyzed
of gadd45, Waf1 ( ~ 2 1 rndrn2,
by hybridization to Northern blots, using total RNA (10 p g per lane)
extracted from the
cells at the indicated times aftershift
theto 32.5C.
Quantitation of bcl-2transcripts was performed RT-PCR
by
(Materials
and Methods) using RT-PCR for {32-microglobulin 1112M) as a control
to show that PCR amplification was the same for the different RNA
aliquots.
callyengineered
MI variants expressing pS3" and / x / - 2
transgenes. either separately or together. we have recently
shown that high-level ectopic expression of bd-2 tlclays the
rapid apoptoticresponseinduced
by pS3.I' In thisreport.
advantage has been taken of these M I variants to show. both
at the cellular and molecular level. that activation of wt p53
function in MI cells initiates pathways for both GI growth
arrest and apoptosis within the same cell type. Data obtained
from both f o w cytometric cell cycle analysis and expression
and functional analysis of key cell cycle regulatory genes
afteractivation of wt p53 functionareconsistent with the
rapid kinetics of apoptosis of the MlpS3 cells preventing
the cells from completing G I arrest: this is in contrast to the
delayed apoptosis of the MIpS3hcl-2cellsaffording the
to GI arrest
prior
to undergoing
cells sufficient
time
apoptosis. thereby unmasking p53-induced G I arrest of the
MI cells. These data also show that the pS3-induced genetic
program of apoptosiscan proceed in either GI arrested
(M lp53hcl-2)or cycling (M IpS3) cells. The subtle changes
in cell cycle distribution observed in MlpS3hcl-2 cells up
to 18 hours after activation of wt p53 function is very similar
to what was observed for M lpS3, despite the fact that in the
latter case only 20% of the cells were living. This observation is consistent with thc notion that cells undergoing p53induced apoptosis do not select from :I subpopulation of
cells with regard to cell cycle status. Elutriation experiments
performed in this laboratory, as well as reported elsewhere."
are in agreement with this notion.
Thc findings presented in this report lead to the conclusion
that the outcome of p53 activation in a given cell type is
dependent on its ability to induce G 1 arrest and/or apoptosis.
as well a s the relative kinetics of these processes. This provides a tangible working hypothesis to understand the molecularmechanisms that underliep53-mediatedresponses
in
different cell types. both in vitro and in vivo. For example.
it is predicted that in cells in which genes involved only in
the mediation of G I growth arrest are amenable to induction
by wt pS3. activation of p53 function will result in GI growth
Consistent with this notion are our recent observations that hn.r. unlike other p53 target genes (ie. gndd45 and
W C ! / / is
) an unique p53-regulatcd gene in that its induction
by genotoxic stress requires not only functional p53 but also
that the cells be apoptosis "proficient."'" In cells in which
genes mediating both G 1 arrest and apoptosis are responsive
to p53. p53 activation will result in the induction of both of
these cellular processes: completion of G I arrest will depend
on the time of apoptosis. as shown in this study.
It is surprising that until now induction of pS3-mediated
GIgrowth arrest and apoptosis were not documented to
occur in aparticular cell type as the result of the same
p53 into fibroblast
stimulus. Forexample.introductionof
cell lines devoid of endogenous wt p53 was documented to
result in only GI growth arre~t.".'~.'~.?~
Also. exposure of
cellstoDNA-damaging
agents".'".'" highlighted p53 asa
criticalparticipant in thephysiologicpathway
that causes
GI arrest of cells in response to genotoxic stresses. On the
other hand. activation of wt p53 function of ectopically expressed pS3" mutant in growing populations of hematopoietic cells, which lack endogenous p53 expression.'.''.''.'' or
in kidney cells transformed with E/A+pS3"." showed a role
for wt p53 as an inducer of programmed cell death. Activation of wt p53 function in M I myeloblastic leukemia or in
primary baby Fisher kidney (BRK) cellswas shown to result
in apoptosis in the absence of measurable GI growth arrest."." In murineerythroleukemiacells.activation
of wt
p53 function has lead to the conclusion that p53 induces cell
deathpredominantly in the GI phaseofactivelycycling
cells."
Given that inactivation of PS.? occurs in more than 50%
of a l l tumors' and that p 5 2 is required for induction of apoptotic cell death by y-radiation
and
chemotherapeutic
dn~gs,".)~
the role downstream effectors of p53 may play in
malignancy as well as in the response of tumors to radiation
and chemotherapeutic drugs also must be considered when
trying to decipher the molecular genetics of pS3. For example. in both the BRK and the murine erythroleukemia cells
that were genetically engineered to express a p.53" mutant
transgeneand high levelsof / x / - 2 . activation of wt p53
resulted in growtharrest that was leaky and. rather than
occurring at G I phase as in M 1 p 5 3 h c P cells. occurred nonspecifically at multiple points in the cell cycle.".-'" Clearly,
it will be of interest to determine towhat extent alteration(s)
in the expression or function of the genes that mediate p53induced GI arrest may be responsible for the failure of these
transformedcell types to arrest in G I . Intriguingly. p53dependent apoptosis in the absence of transcription has been
documentedrecently in cells that. beforeactivationof
wt
p53 function,have been exposed to high levels of DNAdamage inducing agents (ie. UV- or y-radiati~n).'~
From www.bloodjournal.org by guest on February 6, 2015. For personal use only.
BLOCKING P ~ ~ - I N D U C EAPOPTOSIS
D
UNMASKS G I ARREST
We have recently shown that transforming growth factor
P-1 (TGFP-l) induces growth arrest and apoptosis in M1
cells.’5,38The novel differentiation primary response gene
MyD118, whose amino-acid sequence and growth suppressive functions were observed to be closely related to
those of g ~ d d 4 . 5 was
, ~ ~ shown to be a TGFP-l-induced
primary response gene that positively modulates TGFP-1induced cell death.” gadd45, a primary response gene to
p53 (this report and unpublished data), was not induced by
TGFP-1, and activation of wt p53 in M1 cells did not induce
MyD118 (unpublished data). Thus, given the sequence similarities between gadd45 and MyDI18,a role for gadd4.5,
implicated in p53-induced G1 arrest, as a modulator of p53induced apoptosis is possible.
In conclusion, in this work we have used genetically engineered variants of M1 hematopoietic precursor cells as a
model system to molecularly dissect p53-induced G1 growth
arrest and apoptosis. It has been shown, at the molecular
and cellular level, that activation of wt p53 in M1 cells
resulted in the induction of the genetic programs of both G1
growth arrest and apoptosis, and that when apoptosis was
delayed by ectopic expression of bcl-2, G1 arrest was unmasked. The ability to induce M1 growth arrest and
apoptosis by either p53 or TGFP-1, and the availability of
the multitude of genetically engineered M1 variants, makes
it possible to compare and contrast the apoptotic pathways
induced by these two distinct stimuli using the same cells,
allowing for further analysis of the roles playedby differentiatiodgrowth arrest primary response genes, protooncogenes
and tumor suppressor genes in the regulation of p.53-dependent and independent pathways of growth arrest and programmed cell death.
ACKNOWLEDGEMENTS
We acknowledge Amgen’s support of this work (B.H. and
D.A.L.). We also thank John Gibas for the FACS analysis.
REFERENCES
1. Hoffman B, Liebermann DA: Molecular controls of apoptosis:
Differentiatiodgrowth arrest primary response genes, proto-oncogenes, and tumor suppressor genes as positive and negative modulators. Oncogene 9:1807, 1994
2. Fisher DE: Apoptosis in cancer therapy: Crossing the threshold.
Cell 78539, 1994
3. Hollstein M, Sidransky D, Vogelstein B, Harris CC: p53 mutations in human cancers. Science 253:49, 1991
4. Vogelstein B, Kinzler KW: p53 function and dysfunction. Cell
70:523, 1992
5 . Hartwell L: Defects in a cell cycle checkpoint may be responsible for the genomic instability of cancer cells. Cell 71543, 1992
6. Shaw P, Bovey R, Tardy S, Sahli R,Sordat B, Costa J: Induction of apoptosis by wild-type p53 in a human colon tumor-derived
cell. Proc Natl Acad Sci USA 894495, 1992
7. Yonish-Rouach E, Resnitzky D, Lotem J, Sachs L, Kimchi A,
Oren M: Wild-type p53 induces apoptosis of myeloid leukemic cells
that is inhibited by interleukin-6. Nature 352:345, 1991
8. Juven T, Barak Y, Zauberman A, George DL, Oren M: Wild
type p53 can mediate sequence-specific transactivation of an internal
promoter within the mdm2 gene. Oncogene 8:3411, 1993
9. Kastan MB, Zhan Q, El-Deiry WS, Carrier F, Jacks T, Walsh
WV, Plunkett BS, Vogelstein B, Fornace AJ Jr: A mammalian cell
2697
cycle checkpoint utilizing p53 and gadd45 is defective in Ataxiatelangiectasia. Cell 71:587, 1992
IO. El-Deiry WS, Tokino T, Velculesco VE, Levy DB, Parsons
R, Trent JM, Lin D, Mercer WE, Kinzler KW, Vogelstein B: WAFI,
a potential mediator of p53 tumor suppression. Cell 75:817, 1993
1 1 . Moberg KH, Tyndall WA,Hall DJ: Wild-type murine p53
represses transcription from the murine c-myc promoter in the human
glial cell line. J Cell Biochem 49:208, 1992
12. Miyashita T, Krajewski S, Krajewski M, Wang HG, Lin HK,
Liebermann DA, Hoffman B, Reed JC: Tumor suppressor p53 is a
regulator of bcl-2andbax gene expression in vitro andinvivo.
Oncogene 9:1799, 1994
13. Selvakumaran M, Lin H-K, Miyashita T, Wang HG, Krajewski S, Reed JC, Hoffman B, Liebermann D: Immediate earlyupregulation ofbax expression by p53 but not TGFPI: A paradigm
for distinct apoptotic pathways. Oncogene 9:1791, 1994
14. Oltvai ZN, Milliman CL, Korsmeyer SJ: Bcl-2 heterodimerizes in vivo with a conserved homolog, Bax, that accelerates programmed cell death. Cell 74:609, 1993
15. Selvakumaran M, Lin HK, Tjin Tham Sjin R, Reed J, Liebermann D, Hoffman B: The novel primary response gene MyDl18
and the proto-oncogenes myb, myc and bcl-2 modulate transforming
growth factor 01-induced apoptosis of myeloid leukemia cells. Mol
Cell Biol 14:2352, 1994
16. Hoffman-Liebermann B, Liebermann D: IL6fleukemia inhibitory factor induced terminal differentiation of myeloid leukemia cells
is blocked at an intermediate stage by constitutive c-myc. Mol Cell
Biol 11:2375, 1992
17. Liebermann D, Hoffman-Liebermann B: Proto-oncogene expression and dissection of the myeloid growth to differentiation
developmental cascade. Oncogene 4583, 1989
18. Papathanasiou MA, Kerr NC, Robbins JH, McBride OW,
Alamo IJ, Barrett SF, Hickson ID, Fornace AJ Jr: Induction by
ionizing radiation of the gadd45 gene in cultured human cells: Lack
of mediation by protein kinase C. Mol Cell Biol 11:1009, 1993
19. Selvakumaran M, Liebermann D, Hoffman-Liebermann B:
Deregulated c-myb disrupts IL-6LIF induced myeloid differentiation prior to c-myc: Role in leukemogenesis. Mol Cell Biol 12:2493,
1992
20. Graiia X, Claudio PP, De Luca A, Sang N, Giordano A:
PISSLRE, a human novel CDC2-related protein kinase. Oncogene
9:2097, 1994
21. Grafia X, De Luca A, Sang N. Fu Y, Claudio PP, Rosenblatt
J, Morgan DO, Giordano A: PITALRE, a nuclear CDC2-related
protein kinase that phosphorylates the retinoblastoma protein in
vitro. Proc Natl Acad Sci USA 91:3834, 1994
22. Sherr CJ: Mammalian G1 cyclins. Cell 73:1059, 1993
23. Yonish-Rouach E, Grunwald D, Wilder S, KimchiA,May
E, Lawrence J, May P, Oren M: P53-mediated cell death: Relationship to cell cycle control. Mol Cell Biol 13:1415, 1993
24. Baker SJ, Markowitz S, Fearon ER, Willson JK, Vogelstein
B: Suppression of human colorectal carcinoma cell growth by wildtype p53. Science 249:912, 1990
25. Michalovitz D, Halevy 0, Oren M: Conditional inhibition of
transformation and of cell proliferation by a temperature-sensitive
mutant of p53. Cell 62:671, 1990
26. Zhan Q, Fan S, Bae I, Guillouf C, Liebermann DA, O’Connor
PM, Fomace AJ Jr: Induction of BAX by genotoxic stress in human
cells correlates withnormalp53
status and apoptosis. Oncogene
9:3743, 1994
27. Diller L, Kassel J, Nelson CE, Gryka MA, Litwak G, Gebhardt M, Bressac B, Ozturk M, Baker SJ, Vogelstein B, Freind SH:
p53 functions as a cell cycle control protein in osteosarcomas. Mol
Cell Biol 105772, 1990
28. Martinez J, Georgoff I, Martinez J, Levine AJ: Cellular local-
From www.bloodjournal.org by guest on February 6, 2015. For personal use only.
2698
ization and cell cycle regulation by temperature-sensitive p53 protein. Genes Dev S: I S 1, 199I
29. Kastan MB, Onyekwere 0, Sidransky D, Vogelstein B, Craig
RW: Participation of p53 protein in the cellular response to DNA
damage. Cancer Res S1:6304, 1991
30. Kuerbitz SJ, Plunkett BS, Walsh WV, Kastan MB: Wild type
p53 is a cell cycle checkpoint determinant following irradiation.
Proc Natl Acad Sci USA 89:7491, 1992
31. Ryan JJ, Danish R, Gottlieb CA, Clarke MF: Cell cycle analysis of pS3-induced cell death in murine erythroleukemia cells. Mol
Cell Biol 13:711, 1993
32. Wang Y, Szekely L, Okan I, Klein G, Wiiman KG: Wildtype p53 triggered apoptosis is inhibited by Bcl-2 in a v-myc-induced
T-cell lymphoma line. Oncogene 8:3427, 1993
33. Chiou SK, Rao L, White E: Bcl-2 blocks p53-dependent
apoptosis. Mol Cell Biol14:2SS6, 1994
34. Lowe SW, Schmitt EM, Smith SW, Osborne BA, Jacks T:
p53 is required for radiation-induced apoptosis in mouse thymocytes.
Nature 362:847, 1993
GUILLOUF ET AL
35. Clarke AR, Purdie CA, Harrison DJ, Moms RG, Bird CC.
Hooper ML, Wyllie AH: Thymocyte apoptosis induced by pS3dependent and independent pathways. Nature 362:849, 1993
36. Ryan JJ, Prochownik E, Gottlieb CA, Ape1 IJ, Merino R,
Nunez G, Clarke MF: c-myc and bc12 modulate p53 function by
altering p53 subcellular trafficlung during the cell cycle. Proc Natl
Acad Sci USA 915878, 1993
37. Caelles C, Heimberg A, Karin M: pS3-dependent apoptosis in
the absence of transcriptional activation of pS3-target genes. Nature
370:220, I994
38. Selvakumaran M, Reed JC, Liebermann D, Hoffman B: Progression of the myeloid differentiation program is dominant to transforming growth factor-p1 -induced apoptosis in M I myeloid leukemic cells. Blood 84:1036, 1994
39. Zhan Q, Lord KA, Alamo 1 Jr, Hollander MC, Carrier F, Ron
D,KohnKW,
Hoffman B, Liebermann DA, Fomace AJ Jr: The
gadd and MyD genes define a novel set of mammalian genes encoding acidic proteins that synergistically suppress cell growth. Mol
Cell Biol 14:2361, 1994
From www.bloodjournal.org by guest on February 6, 2015. For personal use only.
1995 85: 2691-2698
Dissection of the genetic programs of p53-mediated G1 growth arrest
and apoptosis: blocking p53-induced apoptosis unmasks G1 arrest
C Guillouf, X Grana, M Selvakumaran, A De Luca, A Giordano, B Hoffman and DA Liebermann
Updated information and services can be found at:
http://www.bloodjournal.org/content/85/10/2691.full.html
Articles on similar topics can be found in the following Blood collections
Information about reproducing this article in parts or in its entirety may be found online at:
http://www.bloodjournal.org/site/misc/rights.xhtml#repub_requests
Information about ordering reprints may be found online at:
http://www.bloodjournal.org/site/misc/rights.xhtml#reprints
Information about subscriptions and ASH membership may be found online at:
http://www.bloodjournal.org/site/subscriptions/index.xhtml
Blood (print ISSN 0006-4971, online ISSN 1528-0020), is published weekly by the American
Society of Hematology, 2021 L St, NW, Suite 900, Washington DC 20036.
Copyright 2011 by The American Society of Hematology; all rights reserved.
© Copyright 2026